4564
Movement of blood within the placenta1Sir Peter Mansfield Imaging Centre, School of Physics and Astronomy, Nottingham, United Kingdom, 2Division of Child Health, Obstetrics and Gynaecology, School of Medicine, Nottingham, United Kingdom, 3Nottingham University Hospitals NHS Trust and University of Nottingham, NIHR Nottingham Biomedical Research Centre, Nottingham, United Kingdom
Synopsis
Healthy placental function requires optimum percolation of blood throughout the intervillous space to provide adequate feto-maternal exchange. This depends on blood flow from the spiral arteries and permeability of the intervillous space - both being altered in conditions leading to fetal growth restriction. This study explores the use of diffusion based MRI to visualise and depict the blood flow within the placenta and explore the underlying micro-structure, including the repeatability of the measures.
Introduction
Healthy placental function requires optimum percolation of blood throughout the intervillous space to enable adequate transfer of gases, nutrients and waste products between the fetus and mother. This percolation depends on the flow of blood from the spiral arteries and the permeability of the intervillous space - both parameters that are altered in conditions leading to fetal growth restriction. Placental perfusion has previously been assessed using ASL1, IVIM2 and power Doppler ultrasound3. However we are not aware of any reported measures of net blood flow velocity within the placenta, which is a key measure for modelling blood flow through the intervillous space.
Aim
To measure coherent maternal blood flow within the placenta and identify its relationship to incoherent blood movement.Methods
Scanning: 7 normal women (27-36 weeks gestational age [GA]) were recruited with local ethics committee approval. They were scanned on a 3T Philips Ingenia with a torso coil at SAR<2.0W/kg, in the left or right decubitus position4. Two subjects where discarded due to gross motion and low signal (posterior placentas).
IVIM measurements were acquired using single-shot, respiratory-gated, pulsed gradient spin echo (PGSE), EPI: TE/TR 61ms/1.8s, diffusion weighting b=0,1,3,9,18,32,54,88,147,200,350,400,500s/mm2, 5 transaxial slices, resolution 2.5x2.5x6mm3, repeated twice. The signal from high b values (b=88-500s/mm2) was smoothed before fitting for diffusion coefficient (D). Next unsmoothed signals S(b) were fitted to the IVIM model:
$$ S(b) = S_{0} [(1 - f_{IVIM})e^{-bD} + f_{IVIM}e^{-bD*}] $$
where D was fixed at the value obtained from the fit of high b values, S0 was the signal with no diffusion weighting, fIVIM represents the moving blood volume fraction, D* was the pseudo diffusion coefficient.
Kurtosis5 (K) The unsmoothed data were also fitted to:
$$ S(b) = S_{0} [(1 - f_{IVIM})e^{-bD + \frac{1}{6}b^{2}D^{2}K} + f_{IVIM}e^{-bD*}] $$
Velocity was measured in three orthogonal directions using another PGSE sequence[6] repeated twice, and was calculated from:
$$ v_{x,y,z} =\dfrac{ \Delta\phi}{\gamma G_{x,y,z} T \Delta} $$
where ΔΦ was the net phase accumulated due to the diffusion gradients, Gx,y,z=21.6mT/m was gradient amplitude, $$$Δ$$$=15.9ms was lobe length and T=31.3ms was time between lobes.
Results
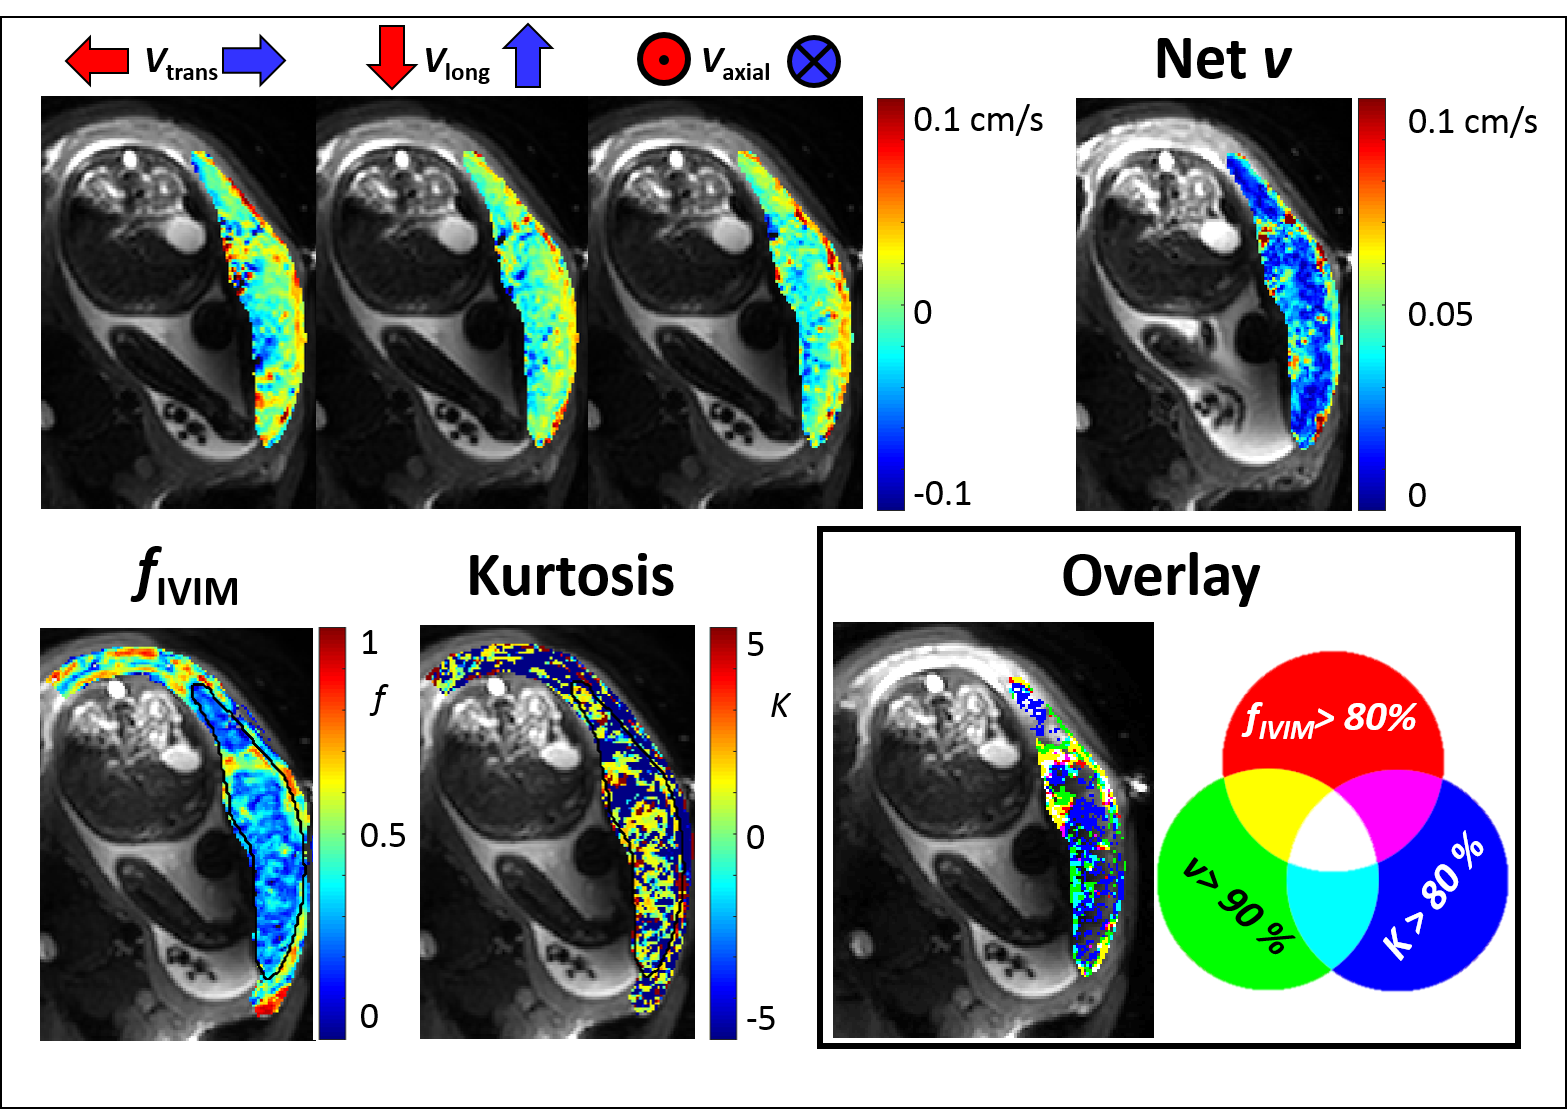
Fig.2 shows velocity, fIVIM and kurtosis for one subject. Flow into the placenta was observed on the maternal side and was in the opposite direction on the fetal side. The maximum net flow velocity was ~0.1cm/s. Fig.1 (overlay) indicates the relationship between regions of high vflow, fIVIM and kurtosis. Fast flow (green, yellow) occured at the edge of the placenta, with high fIVIM regions overlapping (yellow) or occuring more centrally (green). High kurtosis occurred in areas of low fIVIM and slow vflow (blue, little magenta or turquoise).
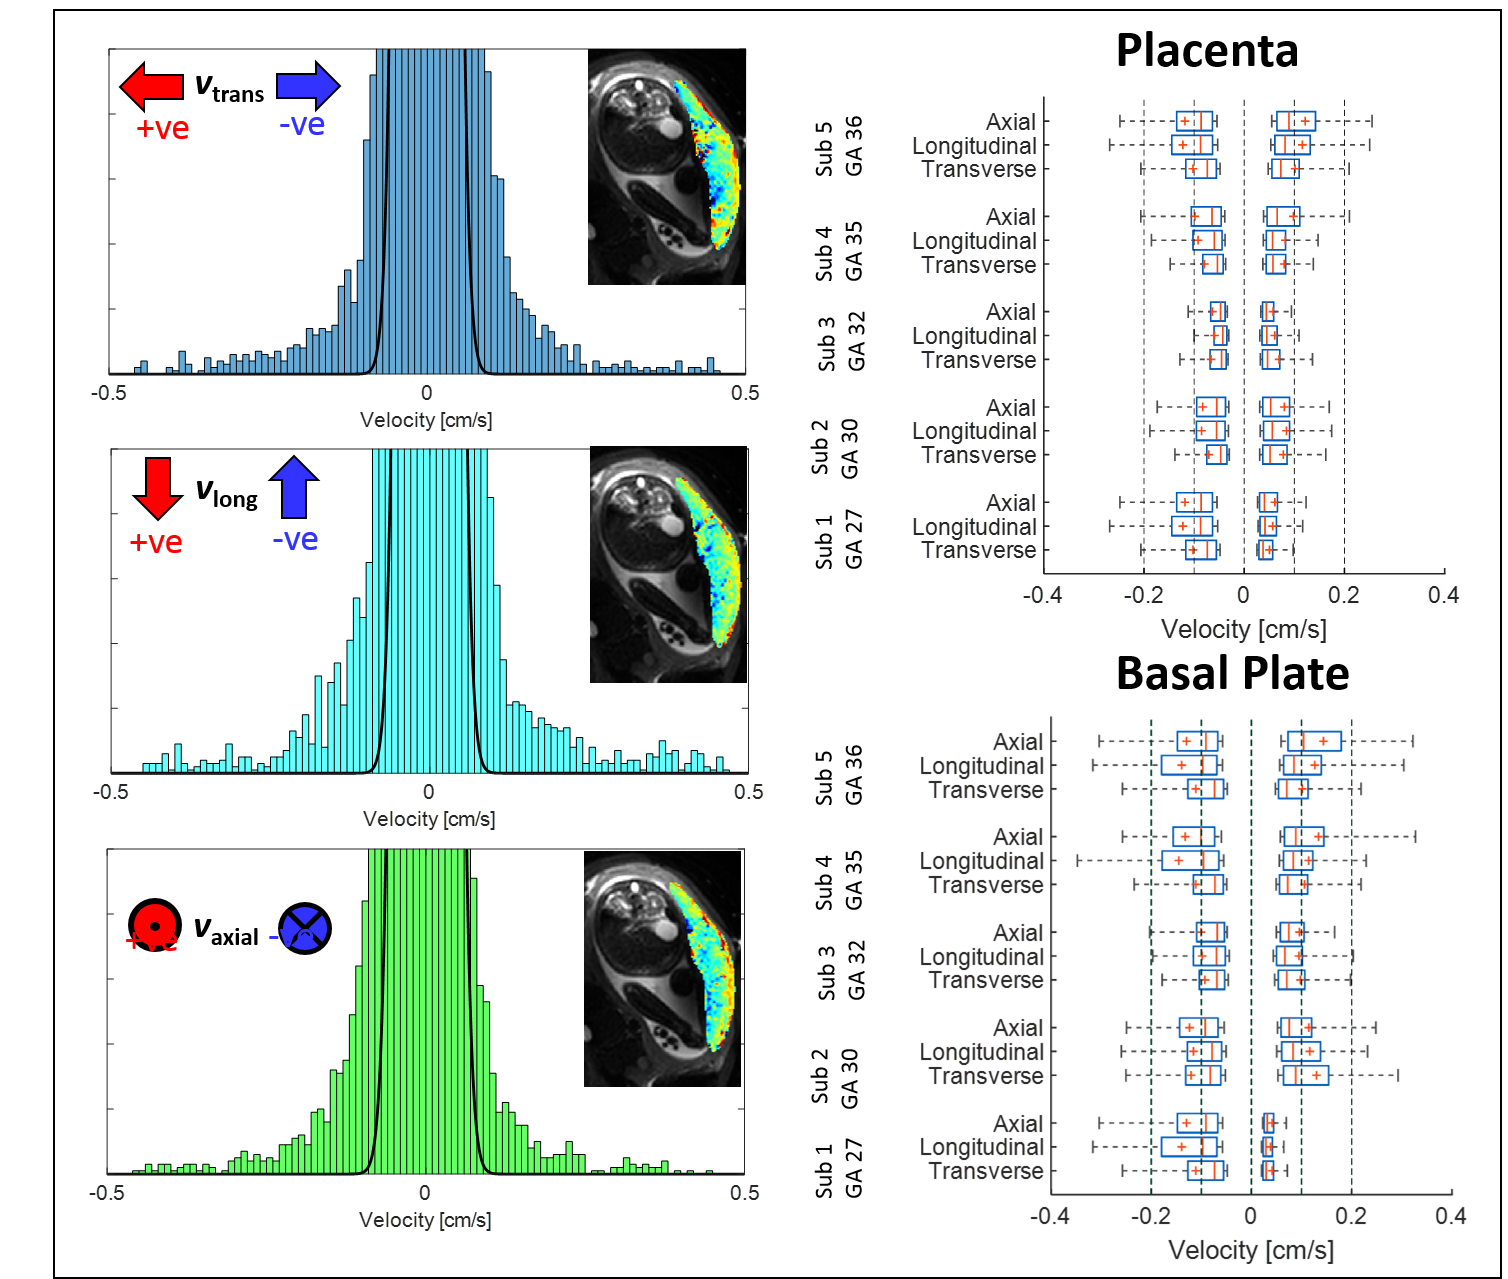
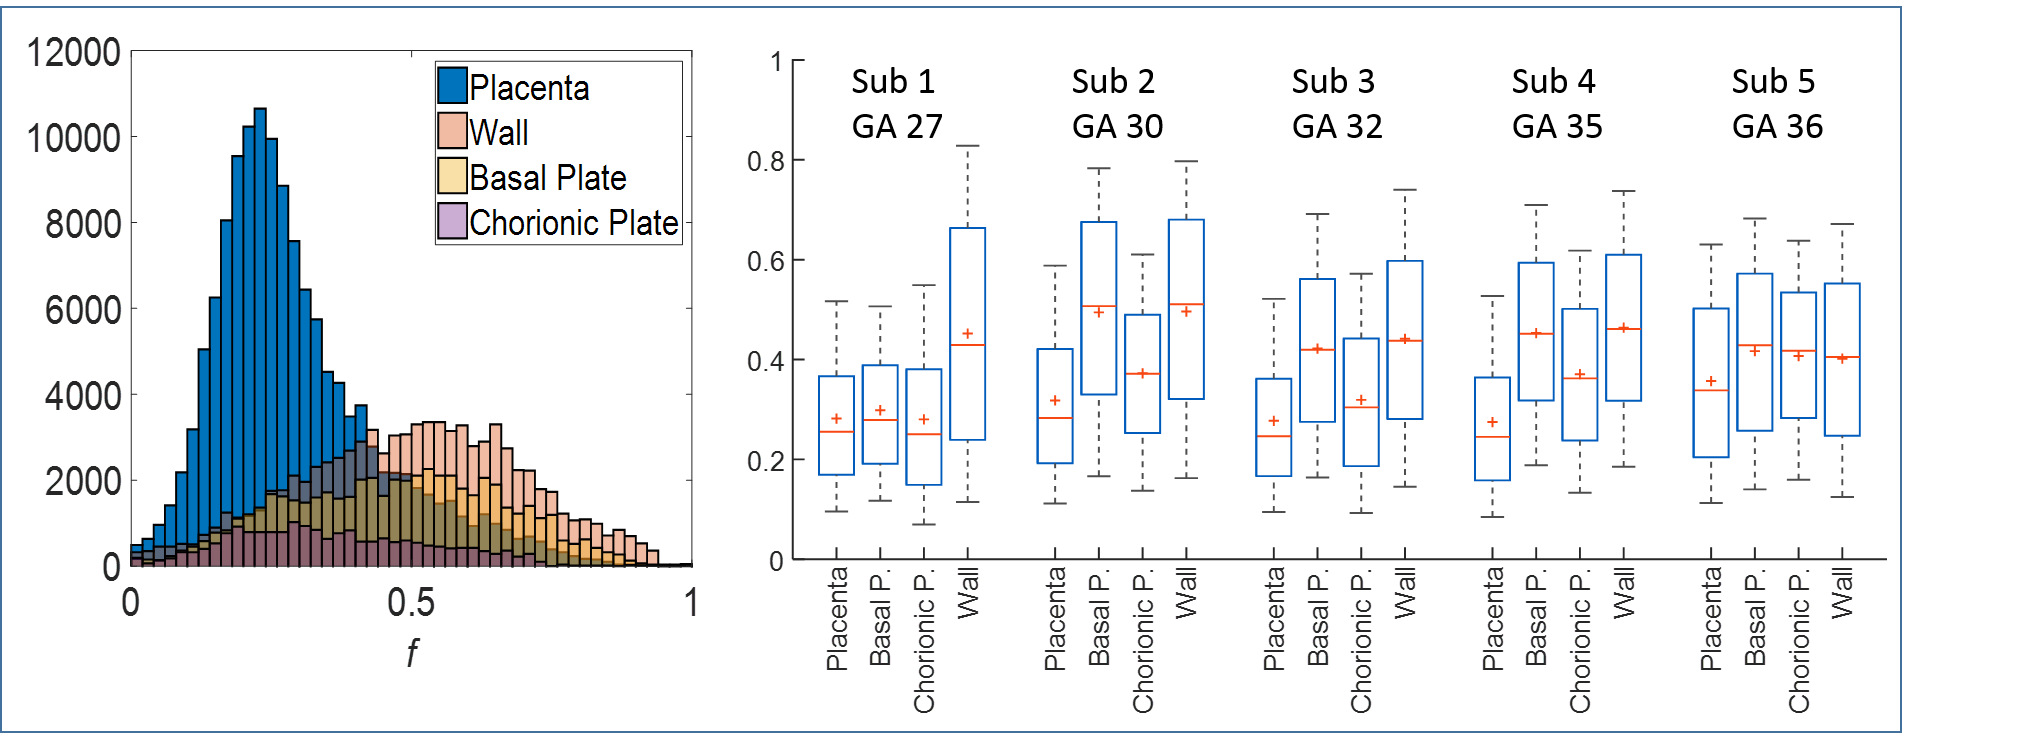
Fig.3 shows velocity histograms with a normal distribution fitted to the central peak. The box-plots show velocities above and below the 95th centile of the fitted peak. Forward and backward velocities were similar, but were higher in the basal plate than the placenta (P<0.0001 Mann Whitney test, each direction separately). Fig.4 shows example histograms and box-plots of fIVIM. fIVIM was significantly higher in the uterine wall and basal plate than the placenta (p=0.004 and 0.02 paired t-test).
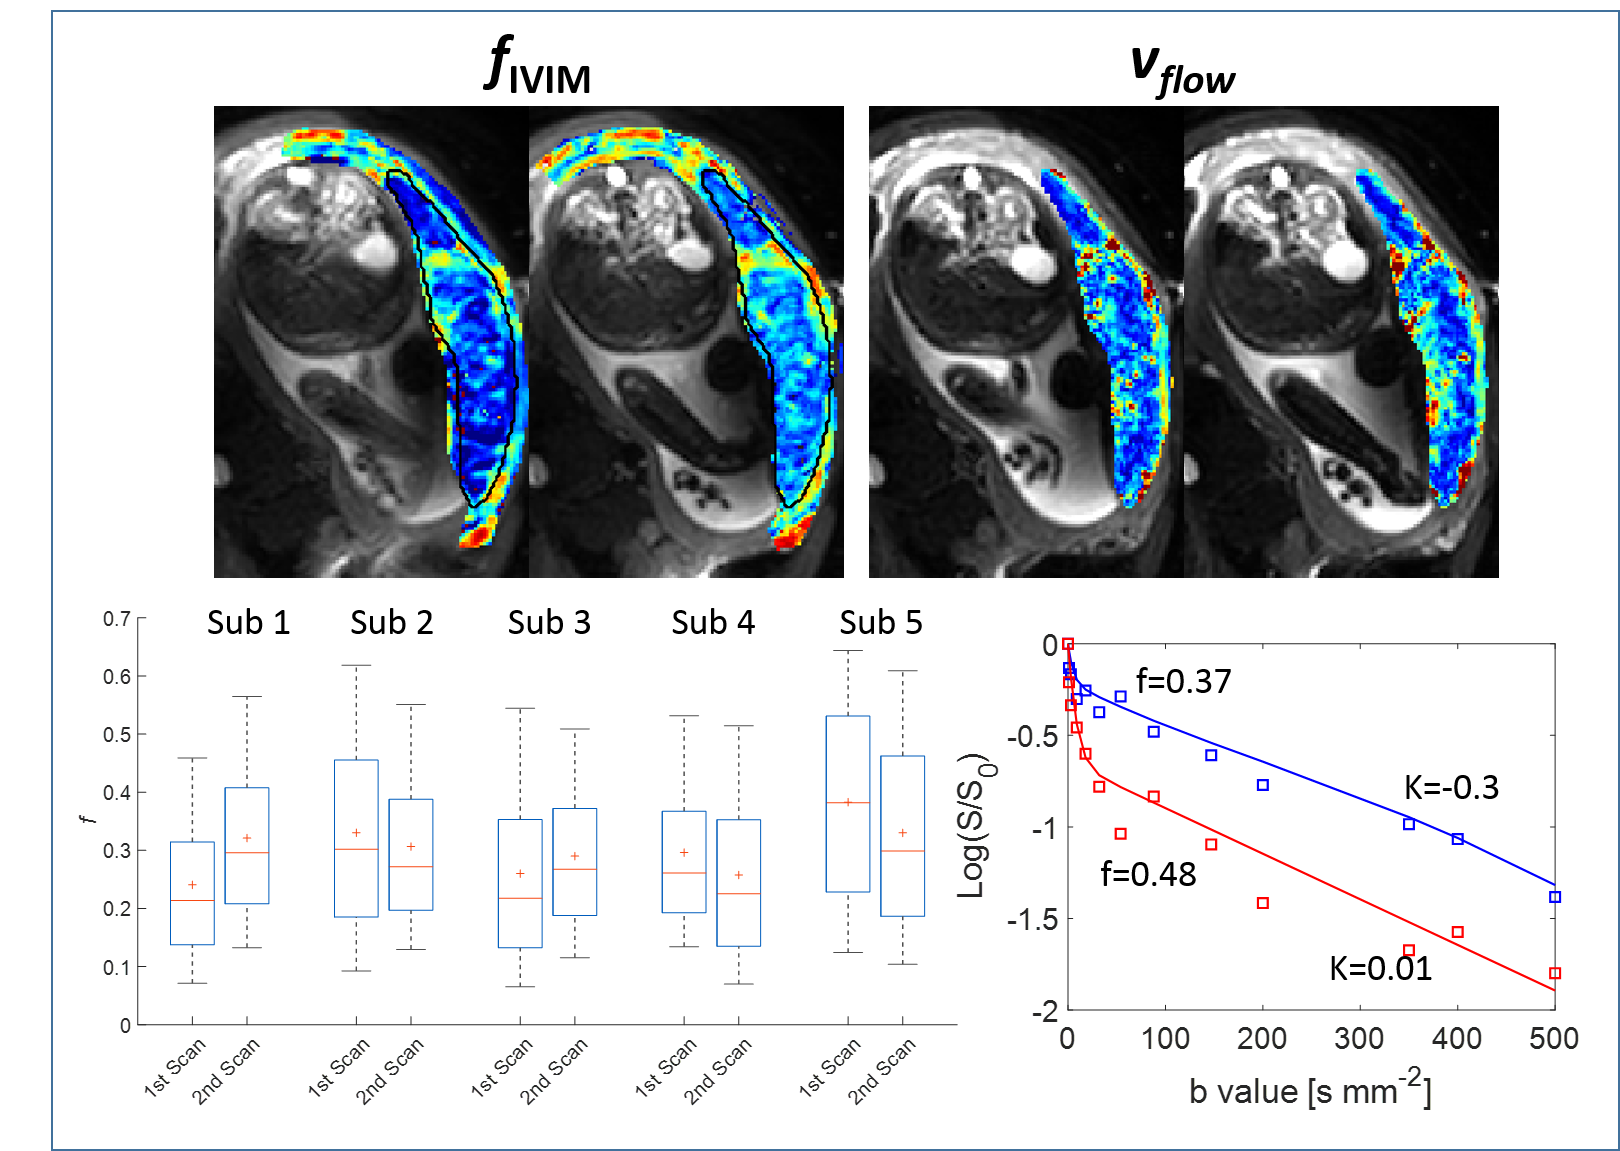
Fig.5 indicates repeatability comparing data from two scans collected on each subject and example decay curves from two placental ROIs.
Discussion
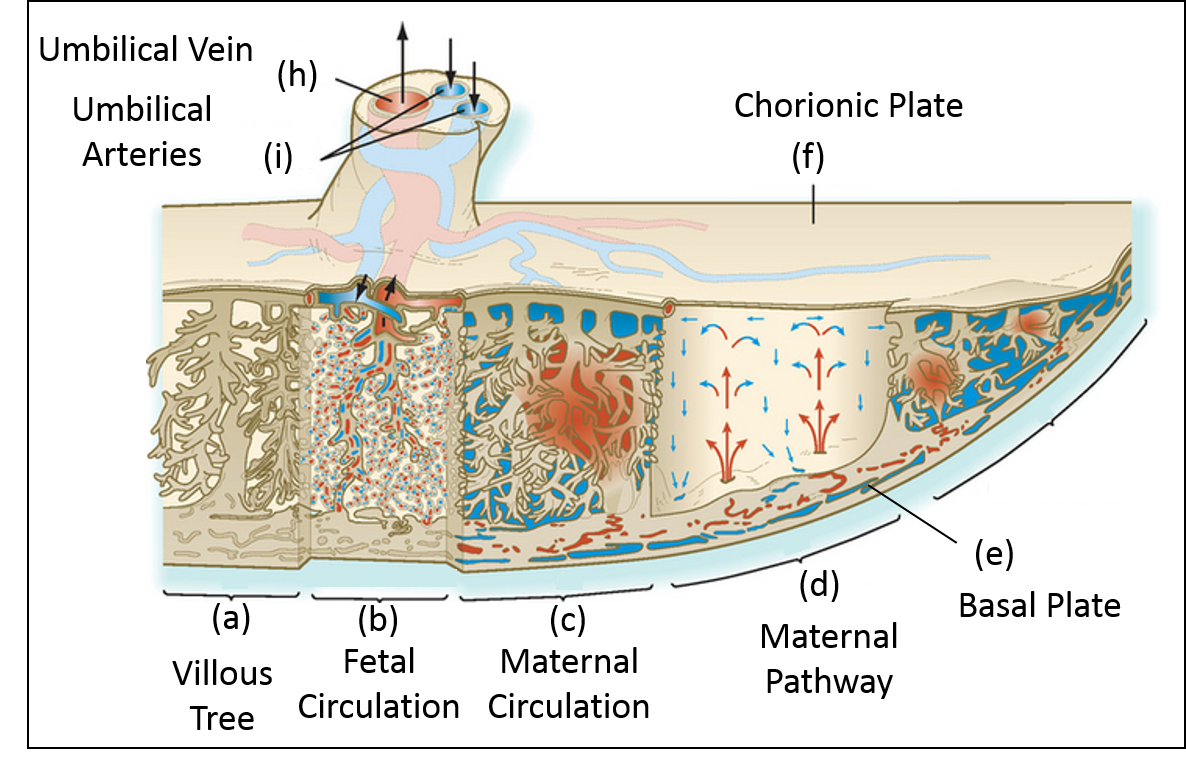
This work measured coherent flow velocities within the placenta for the first time, and compared it to fIVIM and kurtosis, interpreted as blood percolating through the villous tree with large or small mean free paths respectively. Net flow near the basal plate is consistent with flow from the spiral arteries, and net negative flow on the fetal side suggests that deoxygenated blood is pooling between the villous trees. We are not sensitive to fetal flow in the villous trees at this spatial resolution.
vflow and fIVIM were higher in the basal plate than the placenta in all subjects (except vflow in Sub.1’s basal plate). The overlay maps indicate spatial correspondence between areas of high vflow and high fIVIM. Areas with lower vflow or fIVIM corresponded to areas of high kurtosis probably related to slow percolation away from the spiral arteries.
Sub.1 (earlier gestational age and experiencing uterine contractions) showed slow placental flow and low basal plate fIVIM (data sets acquired independently) but the placental flows and fIVIM were unchanged. The data showed good agreement between repeated measurements.
Conclusion
We have measured flow velocities in the placenta and related them to IVIM and kurtosis. These results will depend on the scan parameters (voxel size and echo time). The analysis is now being extended to compare MR signals to more physical models of placental flow.Acknowledgements
This work was funded by the NIH-funded Placenta imaging Project: 1U01HD087202-01References
[1] Gowland, P. A., Francis, S. T., Duncan, K. R., Freeman, A. J., Issa, B., Moore, R. J., Bowtell, R. W., Baker, P. N., Johnson, I. R. and Worthington, B. S. (1998), In vivo perfusion measurements in the human placenta using echo planar imaging at 0.5 T. Magn. Reson. Med., 40: 467–473.
[2] Moore, R. J., Strachan, B. K., Tyler, D. J., Duncan, K. R., Baker, P. N., Worthington, B. S., Johnson, I. R. & Gowland, P. A. In utero perfusing fraction maps in normal and growth restricted pregnancy measured using IVIM echo-planar MRI. Placenta 21, 726–732 (2000).
[3] Pairleitner H, Steiner H, Hasenoehrl G, Staudach A. Threedimensional power Doppler sonography: imaging and quantifying blood flow and vascularization. Ultrasound Obstet Gynecol 1999; 14: 139–143.
[4] Kerr MG, Scott DB, Samuel E. Studies of the Inferior Vena Cava in Late Pregnancy. Br Med J (Clin Res Ed). Feb 29; 1964 1(5382):522, 524–533.
[5] Jens H. Jensen, Joseph A. Helpern, Anita Ramani, Hanzhang Lu, and Kyle Kaczynski Diffusional Kurtosis Imaging: The Quantification of Non Gaussian Water Diffusion by Means of Magnetic Resonance Imaging, Magnetic Resonance in Medicine 53:1432–1440 (2005)
[6] Stejskal EO, Tanner JE. Spin diffusion measurements: spin echoes in the presence of a time‐dependent field gradient. The journal of chemical physics. 1965 Jan 1;42(1):288-92.
Figures