4563
Oxygen transfer through the placenta on hyperoxia1Sir Peter Mansfield Imaging Centre, School of Physics and Astronomy, Nottingham, United Kingdom, 2Division of Child Health, Obstetrics and Gynaecology, School of Medicine, Nottingham, United Kingdom, 3Nottingham University Hospitals NHS Trust and University of Nottingham, NIHR Nottingham Biomedical Research Centre, Nottingham, United Kingdom
Synopsis
Rapid transport of oxygen through the placenta is important to ensure efficient exchange. The aim of this work was to measure the rate of oxygenation distribution across the placenta on hyperoxia using susceptibility mapping. It also attempts to relate the rate of uptake of oxygen in the placenta to the total flow to the placenta. It was observed that upon hyperoxia the susceptibility decreased as the BOLD signal increased in the placenta. We propose that that the rate of homogenization of susceptibility is a marker of transport through the placenta.
Introduction
Rapid and homogeneous transport of oxygen through the placenta is important to ensure efficeint gas exchange. It has previously been shown that BOLD signal changes in the placenta can be detected in response to maternal hyperoxia1,2. However since the BOLD signal is dependent on local inhomogeities, it is not a good measure of mesoscopic variations in oxygen distribution within the placenta. This abstract aims to measure the rate of oxygenation distribution across the placenta on hyperoxia using susceptibility mapping, and to relate the rate of uptake of oxygen in the placenta to the total flow to the placenta.Theory
Let the concentration of oxygen in maternal blood in the placenta be $$$ [O_{2}]_{p} $$$, concentration of oxygen in in-flowing maternal blood be $$$ [O_{2}]_{m} $$$, rate of flow into and out of the placenta be $$$F$$$ and placental volume be $$$V$$$. Assuming good mixing:
$$ V \dfrac{d[O_{2}]_{p}(t)}{dt} = -FMRO_{2} + F[O_{2}]_{m} - F[O_{2}]_{p}(t) $$ $$$ eq.[1]$$$
Solving this assuming that
at t=0 $$$ [O_{2}]_{p} $$$ is in steady state and $$$ [O_{2}]_{m} $$$ increases to $$$ [O_{2}]_{m,0} $$$ gives
$$ [O_{2}]_{p}(t) = \left[[O_{2}]_{m0} - \dfrac{FMRO_{2}}{F}\right] + \left[[O_{2}]_{p}(0) - [O_{2}]_{m0} + \dfrac{FMRO_{2}}{F}\right]e^{\frac{-ft}{V}} $$ $$$ eq.[2]$$$
Therefore the rate of increase in oxygenation can be related to the rate of flow of blood into the placenta per unit volume.
Methods
Scanning: 4 healthy pregnant women (30-36 weeks gestational age) were recruited with local ethics committee approval. They were scanned on a 3T Philips Ingenia with a torso coil with SAR<2W/kg, in the left or right decubitus position. Single-shot, respiratory-gated, gradient-echo EPI scans were acquired (TE/TR=35ms/9s, 39 transaxial slices, resolution 2.5x2.5x4mm3). The mother was fitted with a rebreathing mask and underwent 4-minutes of normoxia (21% O2), 4-minutes hyperoxia (100%O2 15 l/min) and 2-minute normoxia.
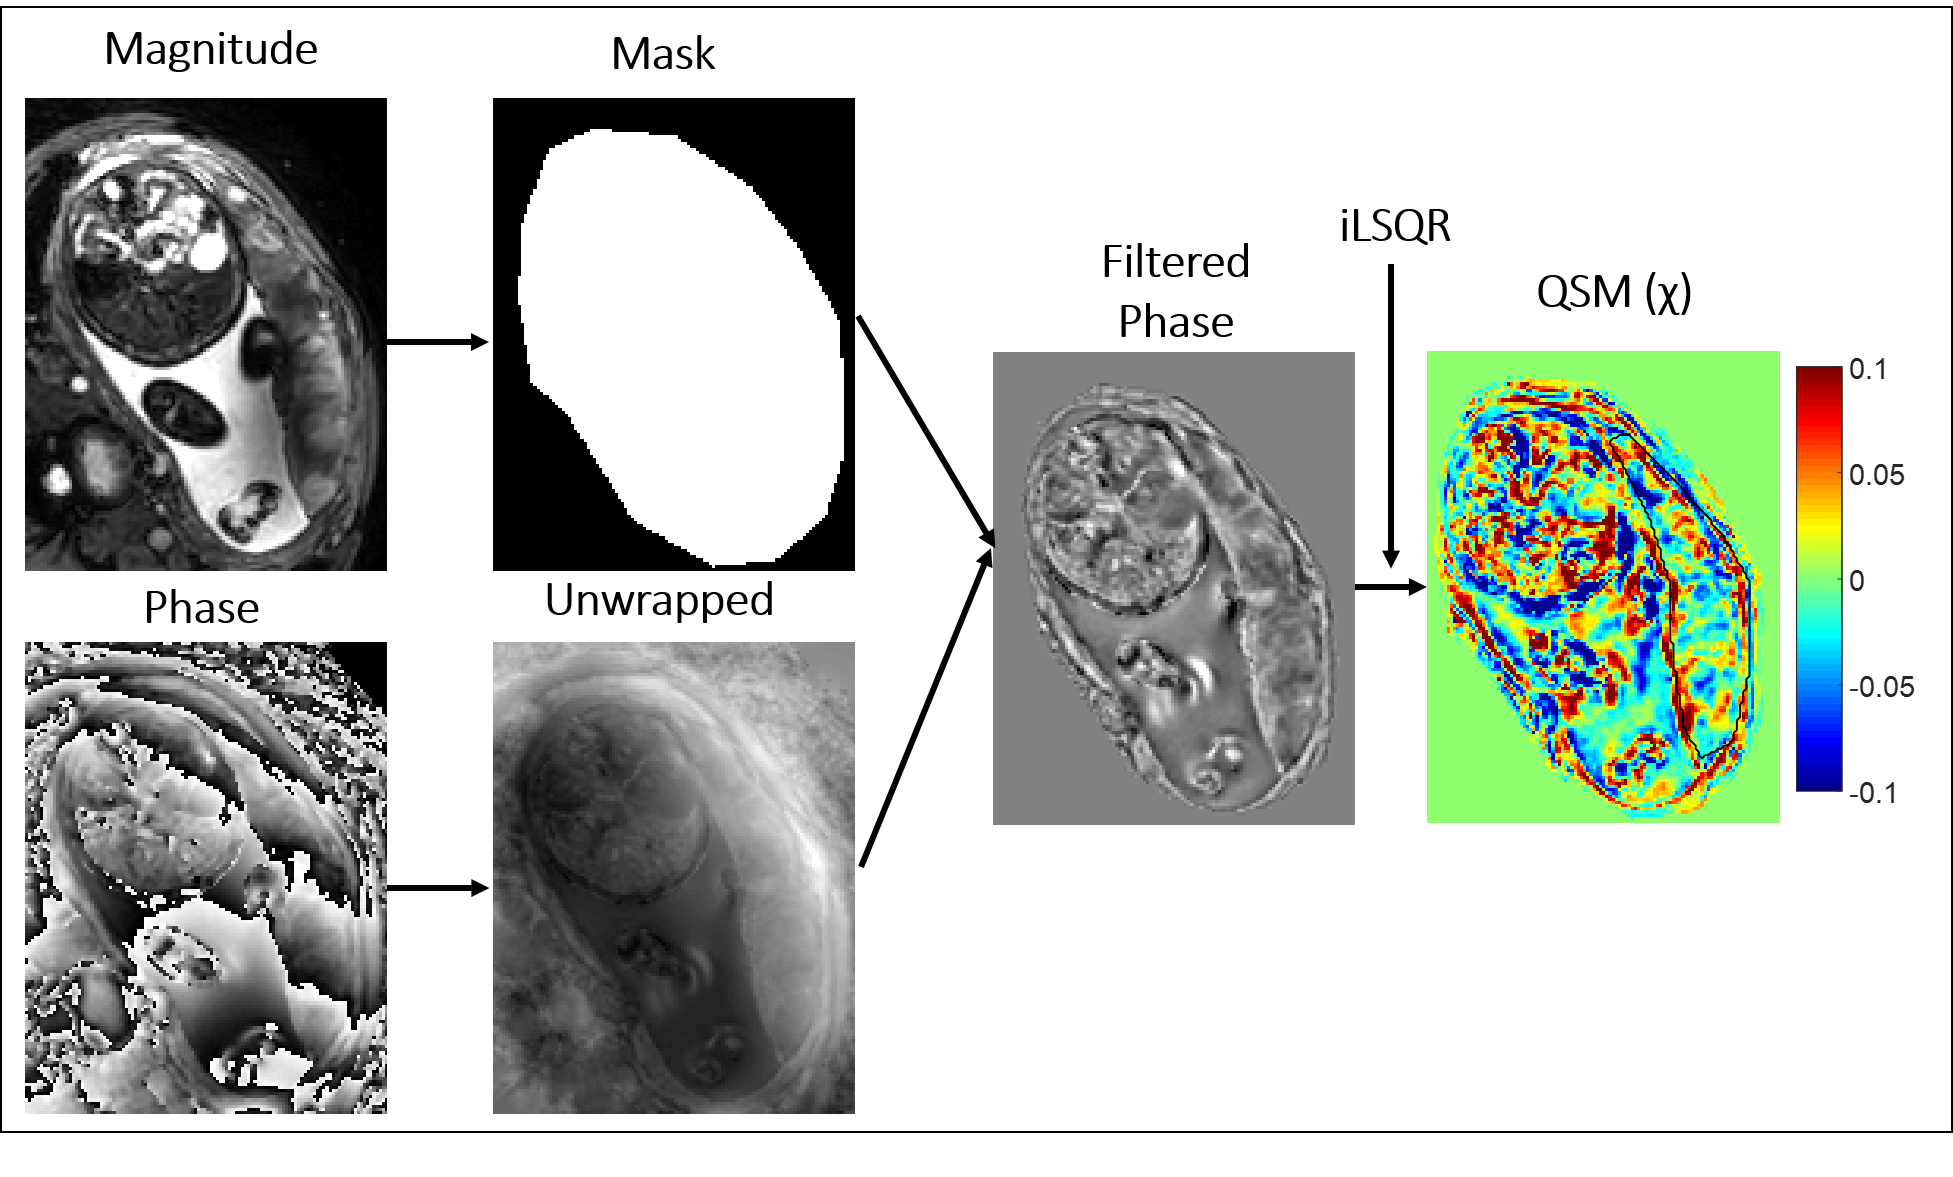
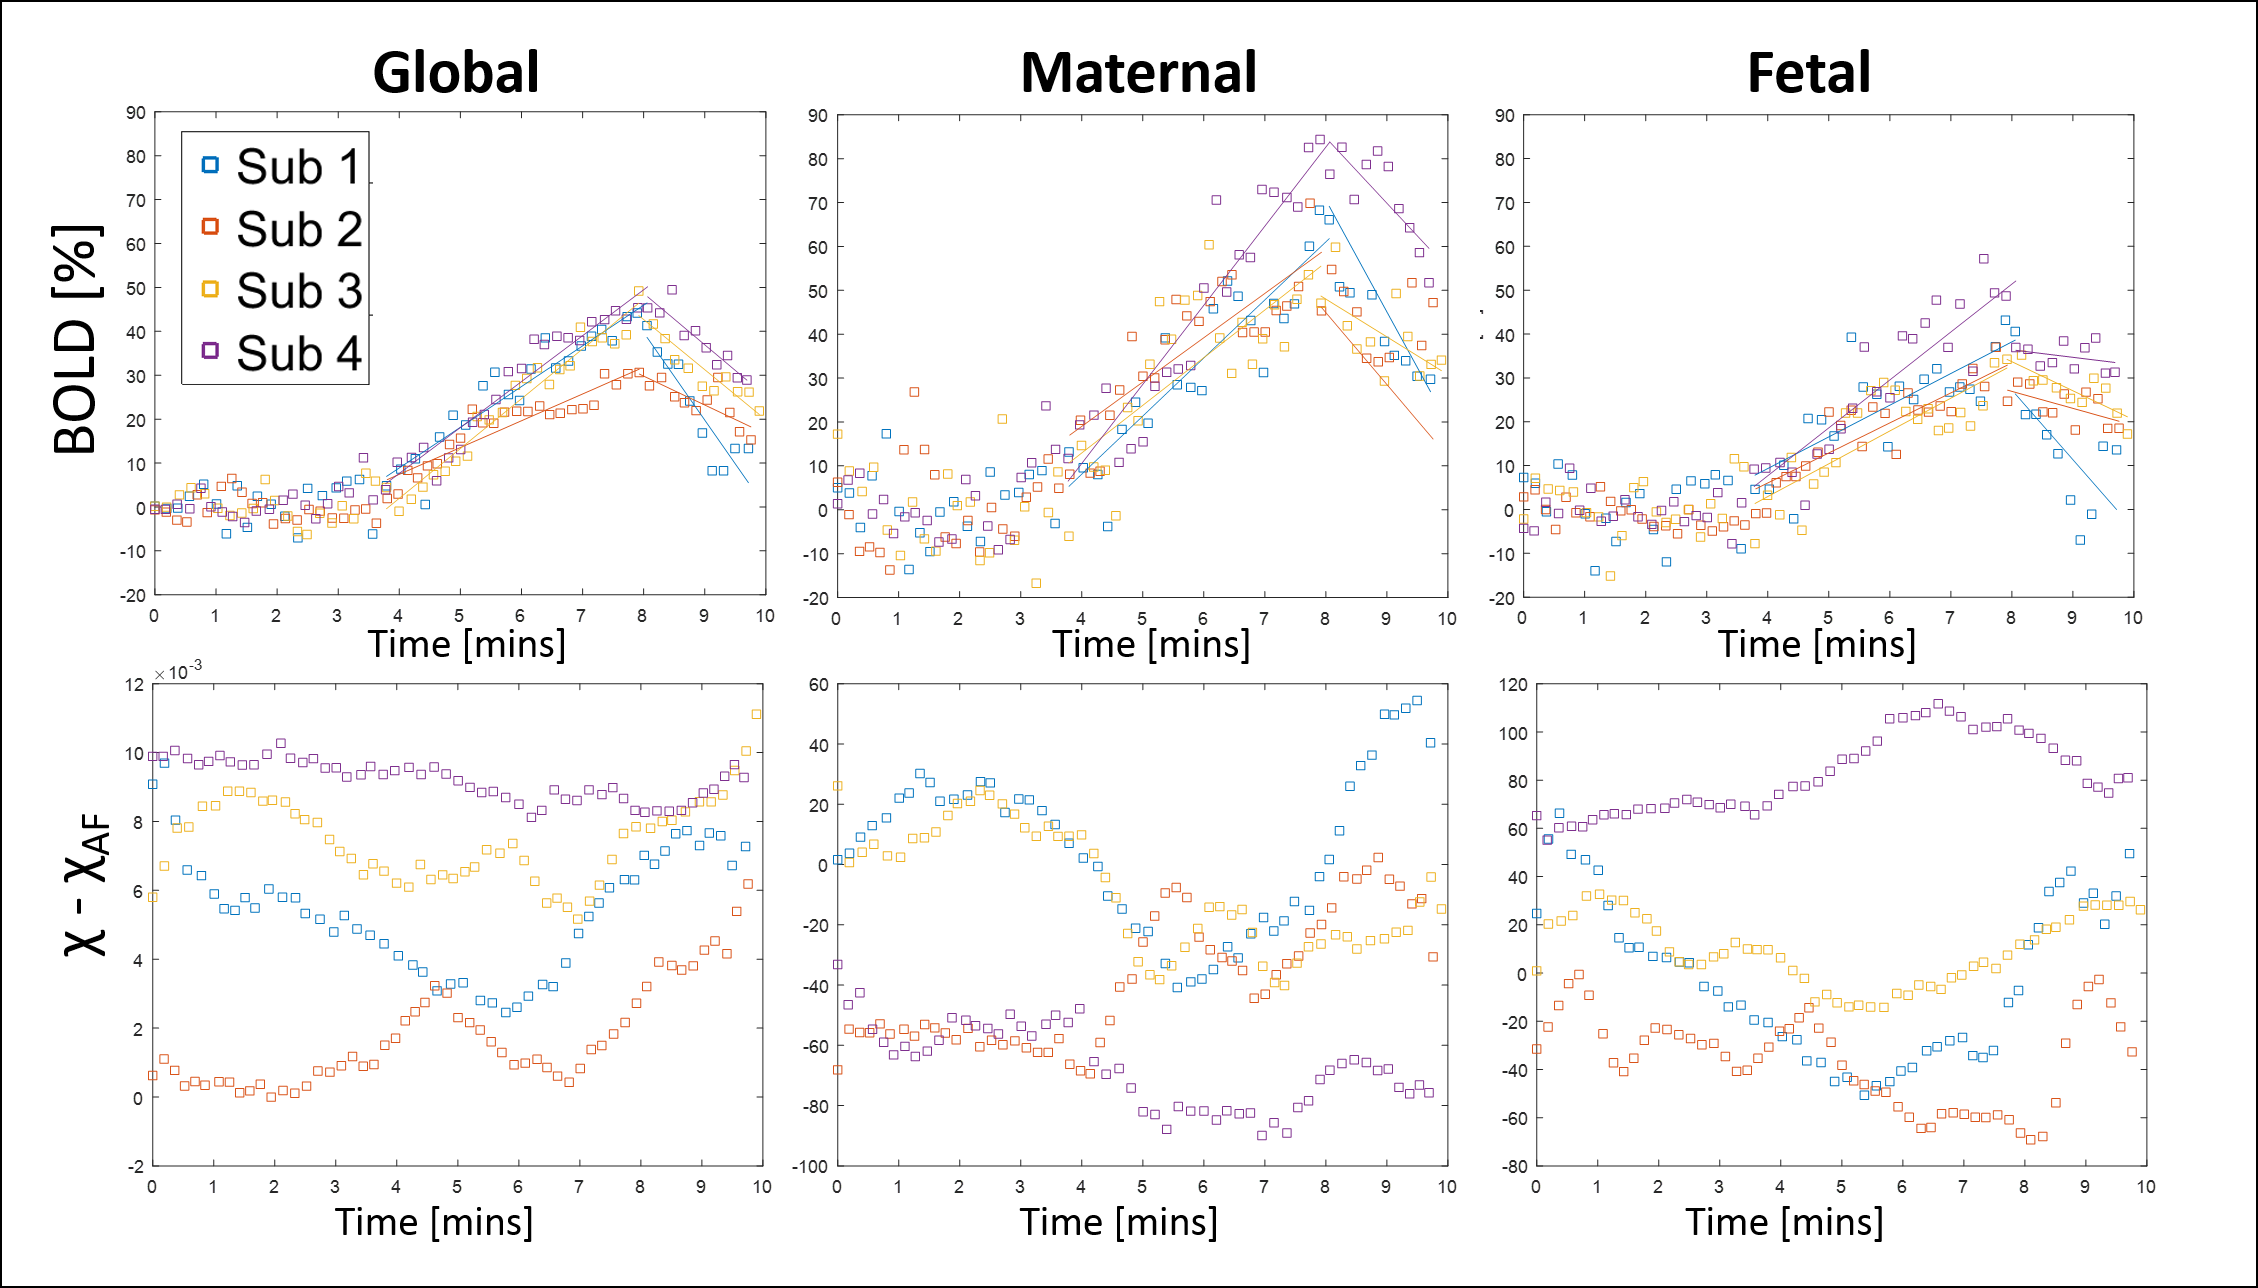
Analysis: A quantitative susceptibility mapping pipeline (Fig.1) was used to create susceptibility (χ) maps using STI suite3. ROIs were drawn round the whole placenta, and on the fetal and maternal sides. Average BOLD and χ in those regions and variation in these parameters over the whole placenta were plotted against time (χ normalized to amniotic fluid). Placental volume was measured from masks of each slice and rate of change in oxygenation was estimated by fitting the BOLD data to an exponential recovery.
Results
Fig.2 shows the BOLD response to O2 was faster on the maternal side of the placenta in all cases (average rise times 15±3%/min for global, 22±5%/min for maternal and 13±3%/min for fetal ROIs). Fig.2 also shows the change in susceptibility is very variable although it decreases most robustly in the maternal ROI. Averaging over all subjects, the change in susceptibility in the placenta on hyperoxia was -0.6±0.8 ppb (1.0±0.4 ppb excluding outlier). For one subject the placental volume was measured from the EPI data set V=624cm3 and the BOLD data was fitted to Eq.2 to give f/V = 0.0112s-1, indicating flow into the placenta of 7 mL/s.
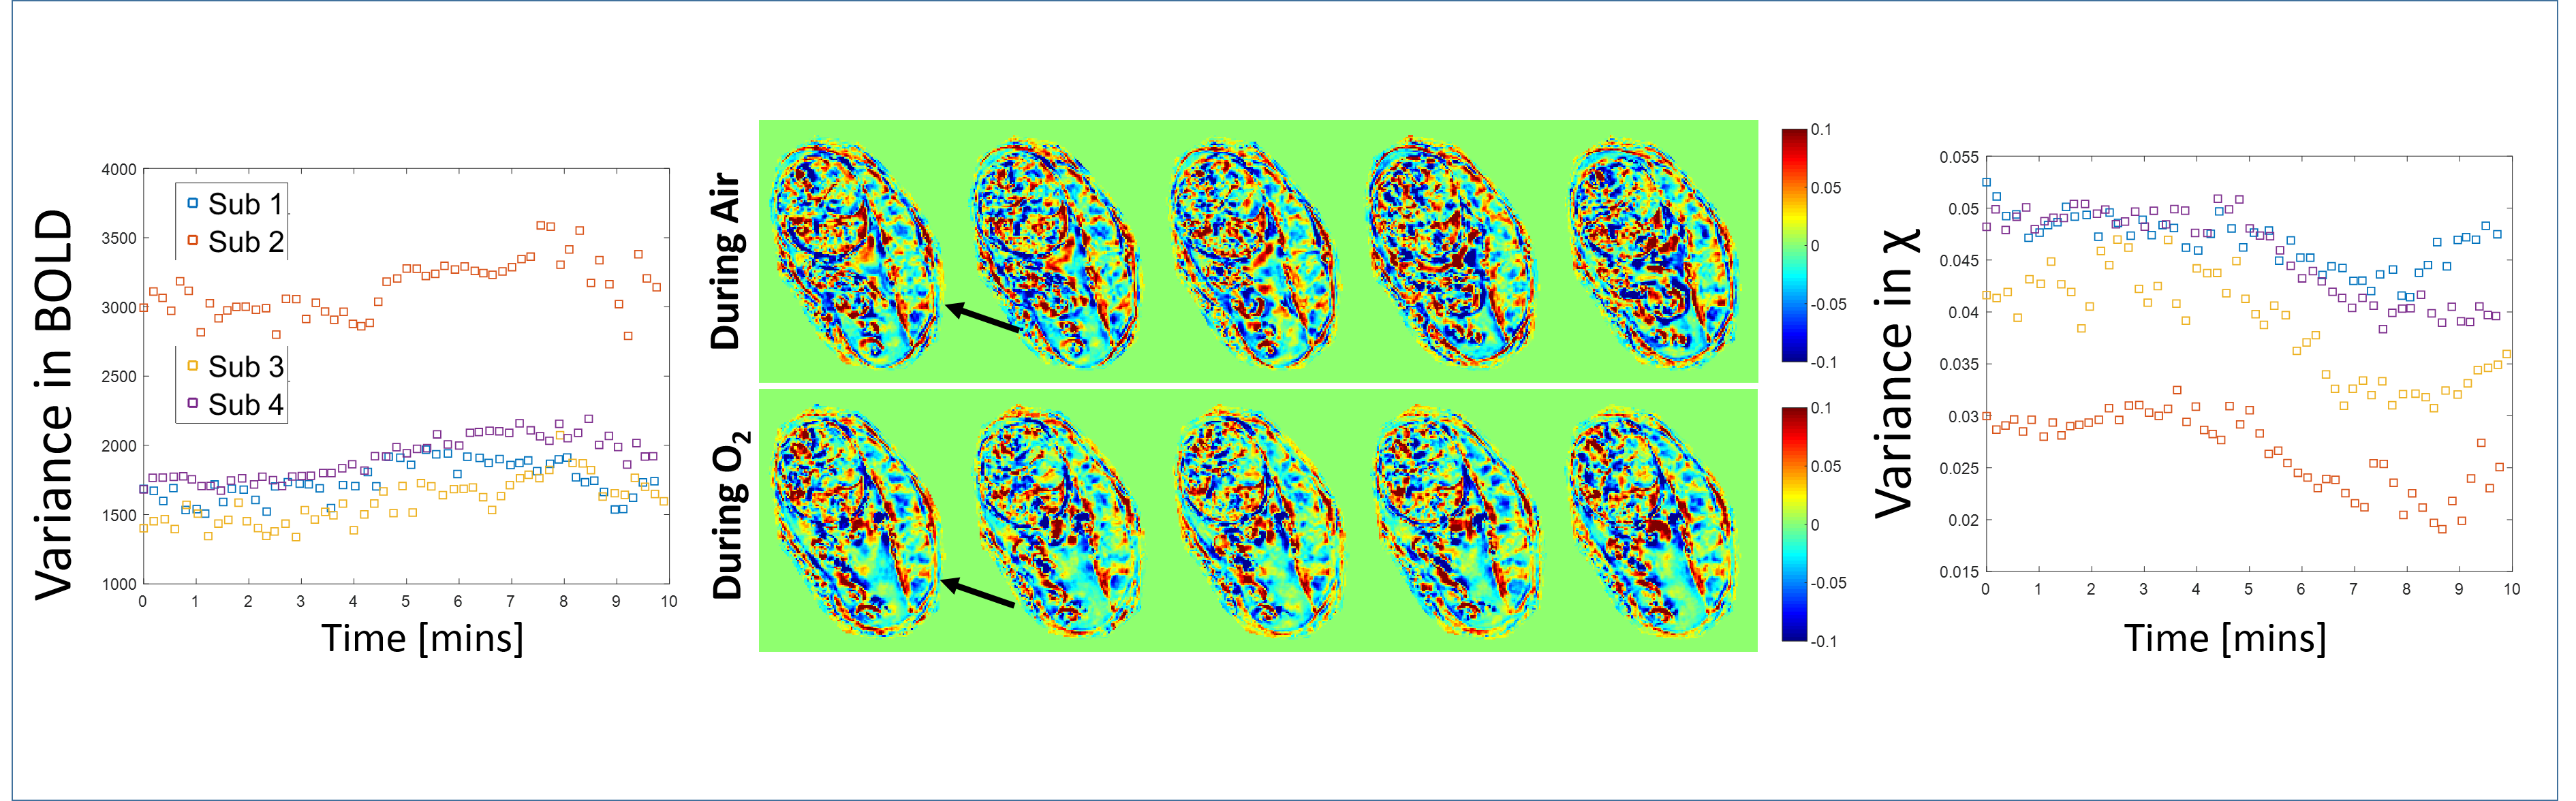
Fig.3 shows example χ maps during normoxia and hyperoxia, and graphs showing that the spatial variance in susceptibility falls significantly on hyperoxia, but the change in the heterogeneity of the BOLD signal is less robust.
Discussion
The BOLD signal shows a robust change in response to hyperoxia which varies across the placenta as previously reported. The rate of change of signal was used to estimate the rate of blood flow to the placenta, with the measured value agreeing with the accepted 500 mL/min [3]. Susceptibility mapping showed a very variable response to oxygenation (decreasing as expected in 3 out of 4 subjects). This change in susceptibility could be converted to a change in blood oxygenation if the blood volume within the placenta could be estimated (e.g. by comparison to a vessel full of blood) and the susceptibility of the villous components of the placenta could be determined (e.g. from an ex utero placenta).
Importantly there was a striking decrease in the heterogeneity of placental susceptibility. The rate of this decrease in spatial variance indicates the rate at which oxygenated blood distributes into deoxygenated regions. We propose that this rate of change of variance of susceptibility could be a marker of transport through the placenta which depends on both blood flow and villous morphology.
Conclusion
Hyperoxia causes a decrease in susceptibility and increase in BOLD signal in the placenta (which can be used to estimate flow to the placenta). However the most striking effect of hyperoxia is to cause a homogenization of susceptibility within the placenta. We propose that that the rate of homogenization of susceptibility is a marker of transport through the placenta.Acknowledgements
This work was funded by the NIH: Placenta Imaging Project: 1U01HD087202-01References
[1] Sørensen, A. et al. Changes in Human Fetal Oxygenation during Maternal Hyperoxia as Estimated by BOLD MRI. Prenatal Diagnosis 2013, 33, 141–145.
[2]Luo J, Turk EA, et al In Vivo Quantification of Placental Insufficiency by BOLD MRI: A Human Study. Scientific Reports. 2017 Jun 16;7(1):3713.
[3] Li W, Wu B, Liu C. Quantitative susceptibility mapping of human brain reflects spatial variation in tissue composition, NeuroImage. 2011; 15;55:1645
[4 ]Maternal, Fetal, & Neonatal Physiology: A Clinical Perspective. By Susan Tucker Blackburn
Figures