4561
3D Water-Fat MRI Detection of Developmental Maturity in Fetal Adipose Tissue Compartments1Medical Biophysics, Western University, London, ON, Canada, 2Schulich School of Medicine and Dentistry, Western University, London, ON, Canada, 3Obstetrics and Gynaecology, Western University, London, ON, Canada, 4Division of Maternal, Fetal and Newborn Health, Children's Health Research Institute, London, ON, Canada
Synopsis
Fetal adipose tissue begins development at different gestational ages in different regions of the body. Proton density fat fraction (PDFF) increases with gestational age as fetal adipocytes fill with lipid. The PDFF was found to be significantly different in different regions of the body in mid-late gestation fetuses.
Introduction
Fetal adipose tissue development is reflective of the energy balance within the fetus; therefore, assessment of abnormalities in fetal adipose tissue development may provide insight into the metabolic health of the fetus1. As adipose cells develop, they grow from water-based fibroblast cells to lipid-based adipocytes2, a process which can be detected by water-fat MRI using proton density fat fraction (PDFF) quantification.
It is also known that fetal adipose tissue starts development in different regions at different gestational ages3. Adipose tissue begins to develop in the head first, then extends to the thorax, abdomen and limbs3. If these compartments develop at different rates, they will also have different lipid contents at a given gestational age. The objective of this study was to detect differences in the lipid content of the cheeks, thorax, upper arms, forearms, abdomen, perirenal, thighs, and lower legs of individual fetuses using water-fat MRI.
Methods
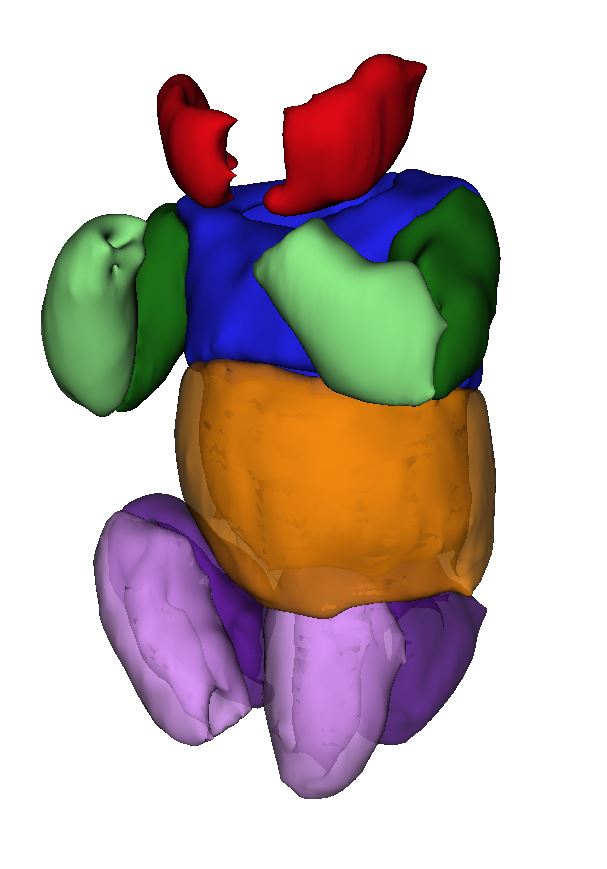
Volunteers with singleton pregnancies and gestational ages between 29 and 38 weeks were recruited from low-risk and high body mass index (BMI) clinics and imaged in a wide-bore (70 cm) 1.5T MRI (GE MR450w). During an approximately 30 min MRI exam, 3D water-fat MRI (specific implementation: Quantitative IDEAL, TR 9.7-12.7 ms, flip angle 6-7°, Field of View 50 cm, 160×160 pixels, slice thickness 4-6.5 mm, 42-78 slices, ARC acceleration 2x phase 2.5x slice and 32x32 calibration lines, acquisition time 12-24 s) was used to image fetal adipose tissue during maternal breath hold. Fetal adipose tissue compartments including cheeks (high intensity adjacent to mouth), upper arm (shoulders diagonally cut to elbow diagonally cut), lower arm (elbow diagonally cut to wrist), thorax (top of shoulders to bottom of lungs), abdomen (bottom of lungs to where thigh meets body), thighs (along body orthogonal to thigh length to knee diagonally cut), lower leg (knee diagonally cut to ankle), and perirenal (surrounding kidneys) were manually segmented using 3D Slicer (v4.7.0-2016-12-06)4 (Figure 1). The PDFF was measured after eroding the compartments with a 4-neighbour erosion to reduce partial volume effects. The mean PDFF of the different compartments were compared using a repeated-measures one-way ANOVA with Dunn’s multiple comparisons test in GraphPad Prism (v7.03).Results
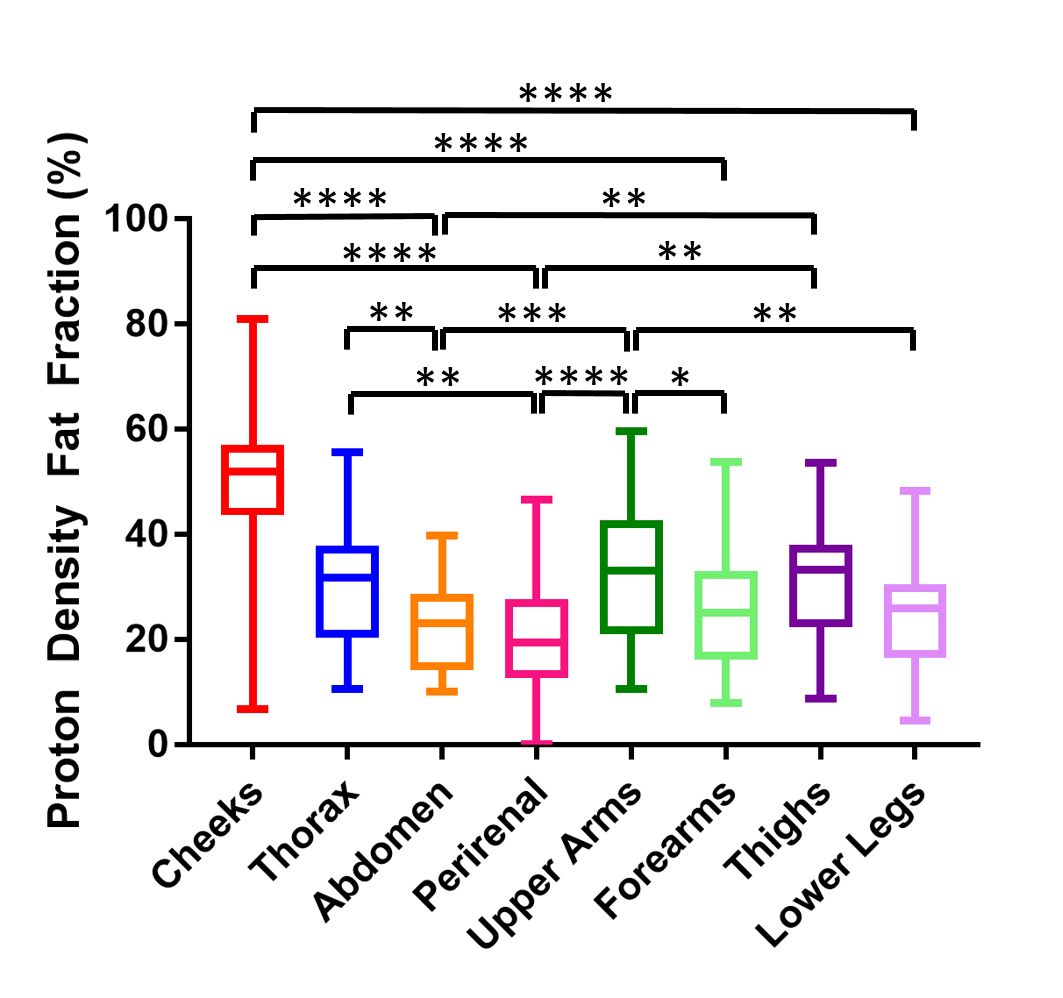
17 women participated in the study and had BMI ranging from 16.6 – 42.9 kg/m2 and had their MRI between 29 and 37 weeks GA. The ANOVA showed a significant effect of compartment location on mean PDFF (p<0.0001). The results of the multiple comparisons tests are shown in Figure 2.Discussion
The differences in the PDFF between the fetal adipose tissue compartments demonstrate that water-fat MRI is sensitive to the differing lipid content of those compartments. The PDFF was higher in compartments that begin development earlier in gestation than those which begin development later in gestation. This information will help further the understanding of normal fetal fat development, and allow regional assessment of fetal fat development in pathological pregnancies.
The presence of brown adipose tissue (BAT) serves as a confounding factor in the interpretation of these results. In neonates, BAT has a lower PDFF than white adipose tissue (WAT)5. Perirenal adipose tissue is completely BAT and is therefore expected to have a lower PDFF that WAT, which is precisely the result we show here. Adipose tissue in the thorax and abdomen is a mixture of BAT and WAT. Based on developmental timing, the thorax and abdomen had a lower PDFF than expected relative to that of the upper arm and thighs. This is likely because they contain some BAT, which is lowering the measured PDFF.
Our data suggests we can differentiate BAT and WAT in the fetus based on PDFF. Therefore, PDFF measurement may be a useful tool in distinguishing the metabolically active and thermoregulatory BAT from WAT accumulated for storage and insulation. Changes in development of these two tissues can have different implications for the baby's future health.
Future work investigating the combined effects of gestational age, adipose tissue region, and BAT on PDFF will improve our understanding of normal and altered fetal adipose tissue development.
Conclusion
In conclusion, water-fat MRI can be used to detect differences in PDFF of fetal adipose tissue compartments and has the potential to be used to investigate fetal adipose tissue development in pathological pregnancies.Acknowledgements
Grant support from the Children’s Health Research Institute, Natural Sciences and Engineering Research Council of Canada, Canadian Institutes of Health Research and General Electric.References
(1) Toro-Ramos, T., et al. Eur J Clin Nutr 2015; 69(12):1279-1289. (2) Ali A.T., et al. Eur J Cell Biol 2013; 92(6-7):229-236. (3) Poissonnet, C.M., et al. Early Hum Dev 1984; 10(1-2):1-11. (4) Federov, A., et al. Magn Reson Imaging 2013;30(9):1323-1341. (5) Hu, H.H., et al. J Magn Reson Imaging 2012;35(4):938-942.Figures