4560
The development of fat in fetus: Observation by magnetic resonance imaging1Radiology, Taipei Veterans General Hospital, Taipei, Taiwan, 2National Yang-Ming University School of Medicine, Taipei, Taiwan
Synopsis
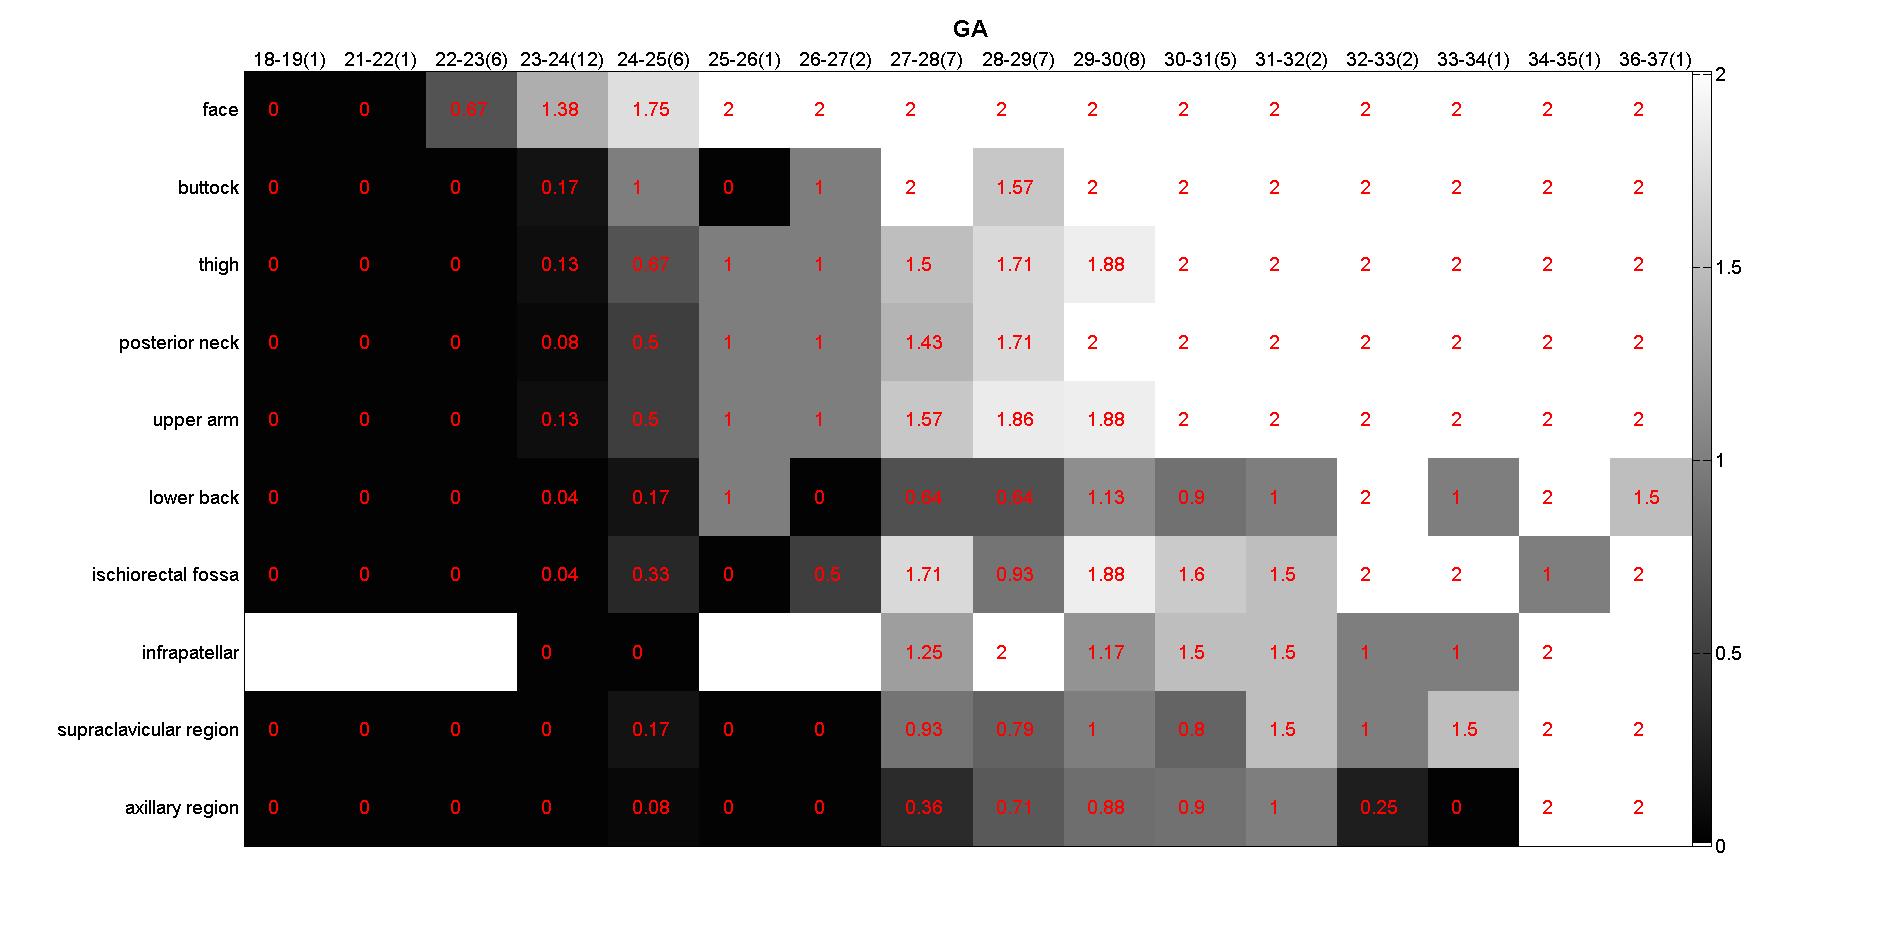
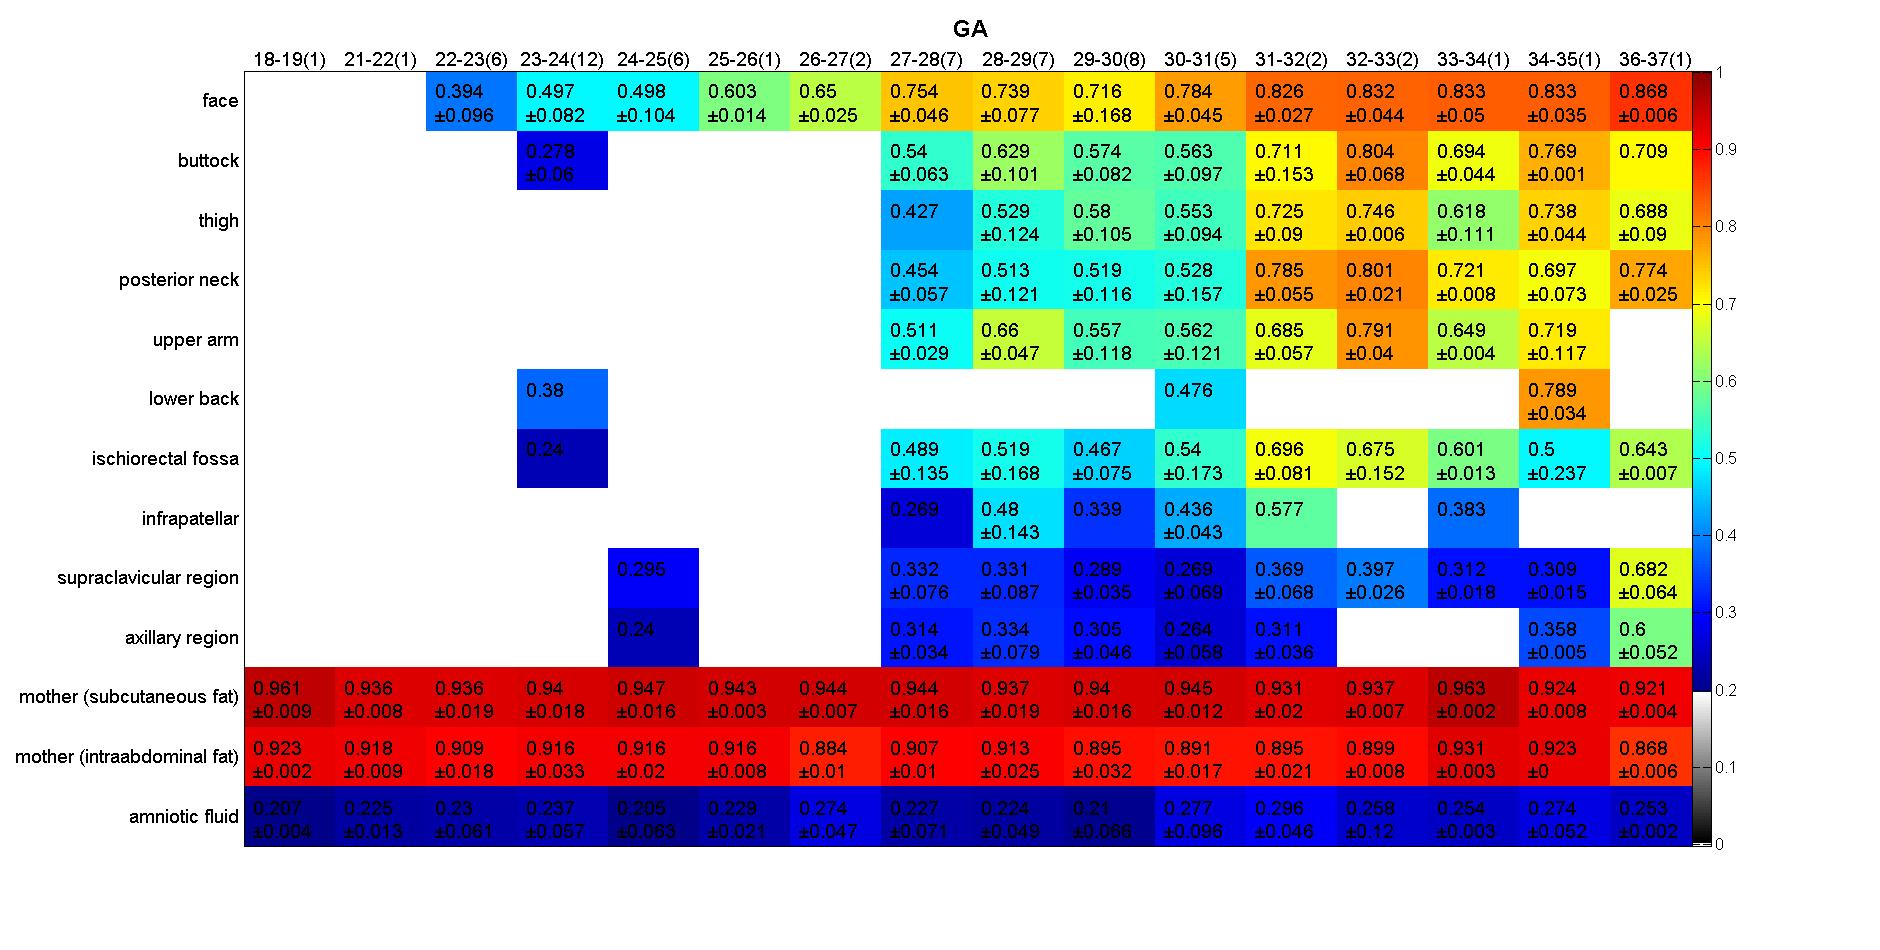
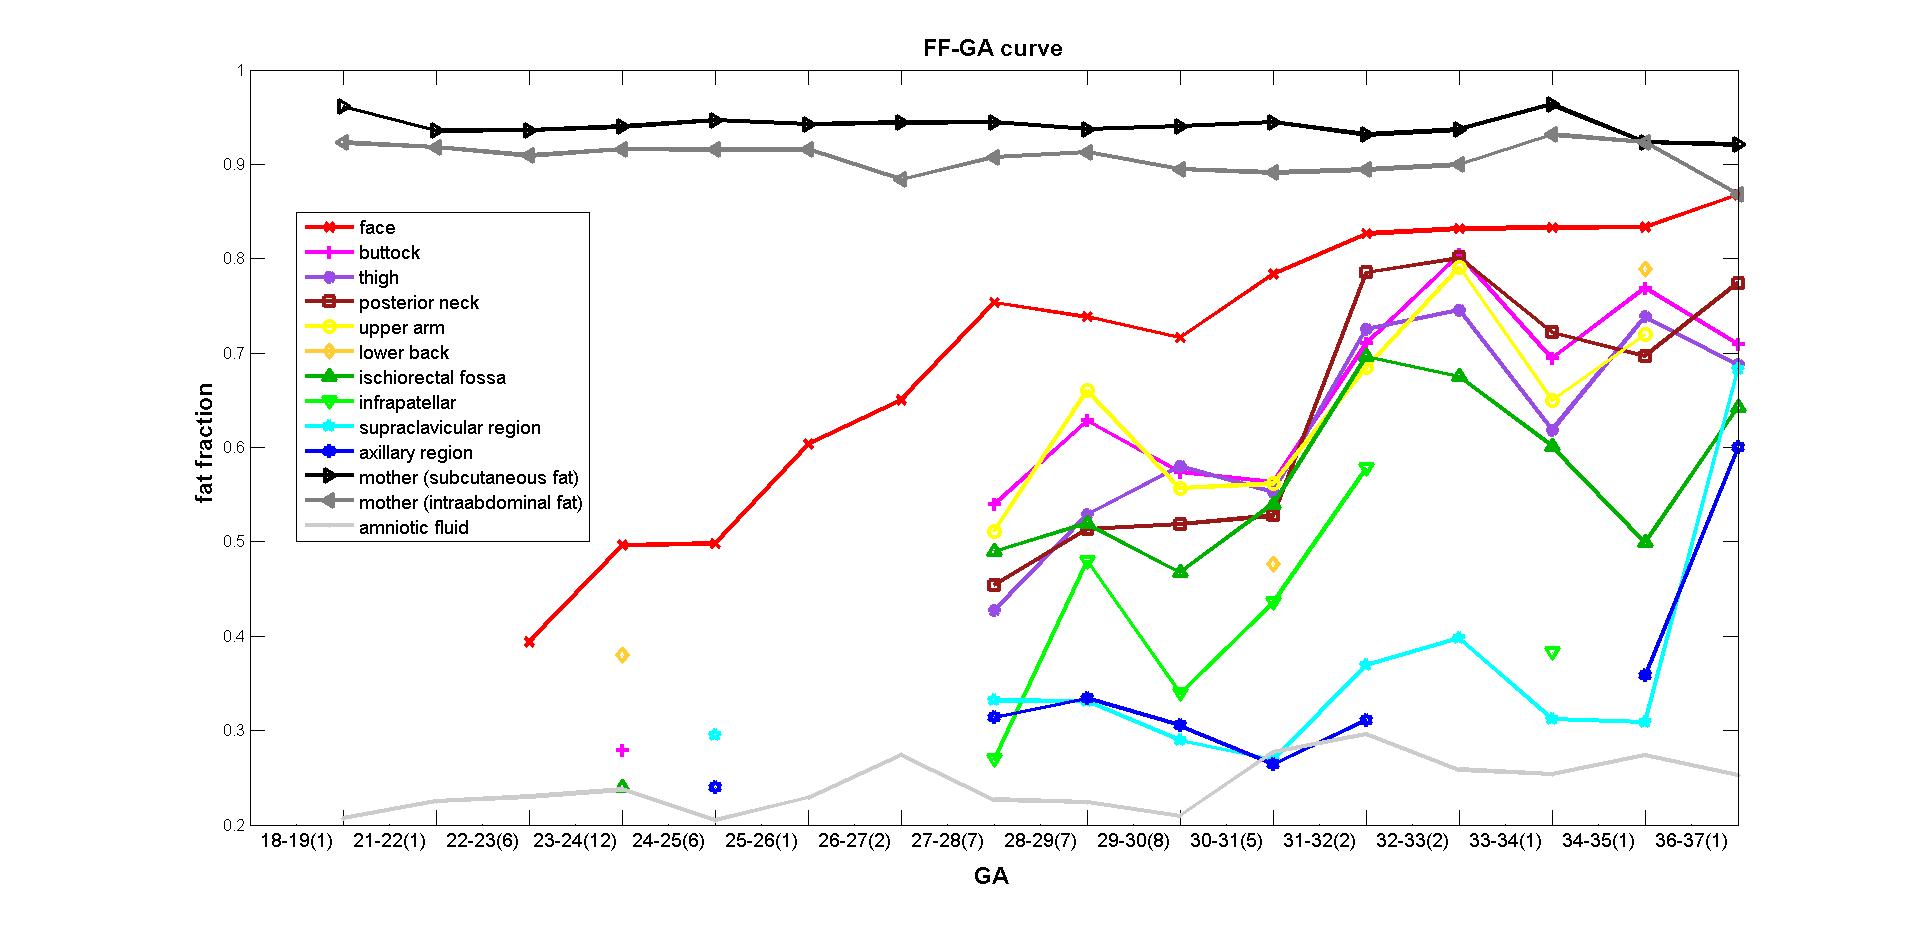
The fetal structures including fat change vigorously during the development progress. In this study, by using 2-point Dixon method, we demonstrated that the fetal fat development followed a predictable chronological sequence in terms of both location and composition. The fat at face appears the earliest at 22-23 weeks, followed by subcutaneous fat of other body part in the order of buttock, thigh, posterior neck, upper arm and lower back. Most subcutaneous fat could be well visualized at 27-28 weeks. The fat at deep part appeared later. The fat fraction in all body part gradually increased as the development progress.
Introduction
The fetal structures, including fat, change vigorously during the development progress. It has been demonstrated that the imaging presentation of lipomatous lesions in fetus differ according to the gestational ages. 1 Metabolic diseases such as maternal diabetes also influence the thickness of the fetus. 2, 3 Understanding the normal developing process of fat tissue in fetus is important for correctly diagnosing the lipomatous pathologies. Magnetic resonance imaging (MRI) provides fast and reliable imaging without scanning dead space. It has been an important 2nd line tool for prenatal consultation. Previous studies revealed that the subcutaneous fat could be demonstrated by MRI in fetus older than 29 weeks of gestational age. 2, 4 However current knowledge about the sequential developmental process of fetal fat is limited. This study was conducted to evaluate the chronological sequence of fetal fat development regarding morphology and fat composition. Using 2-point Dixon method, the morphology of fat could be evaluated by fat-only image and the fat composition could be evaluated by the fat fraction maps.Methods
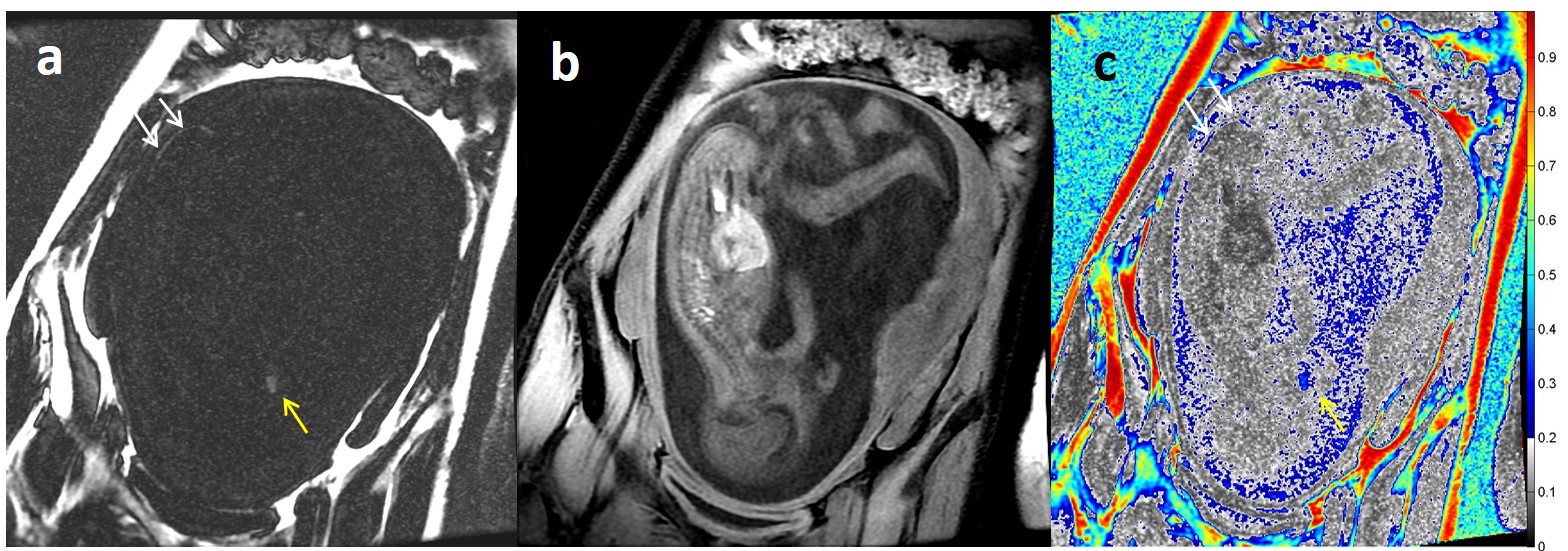
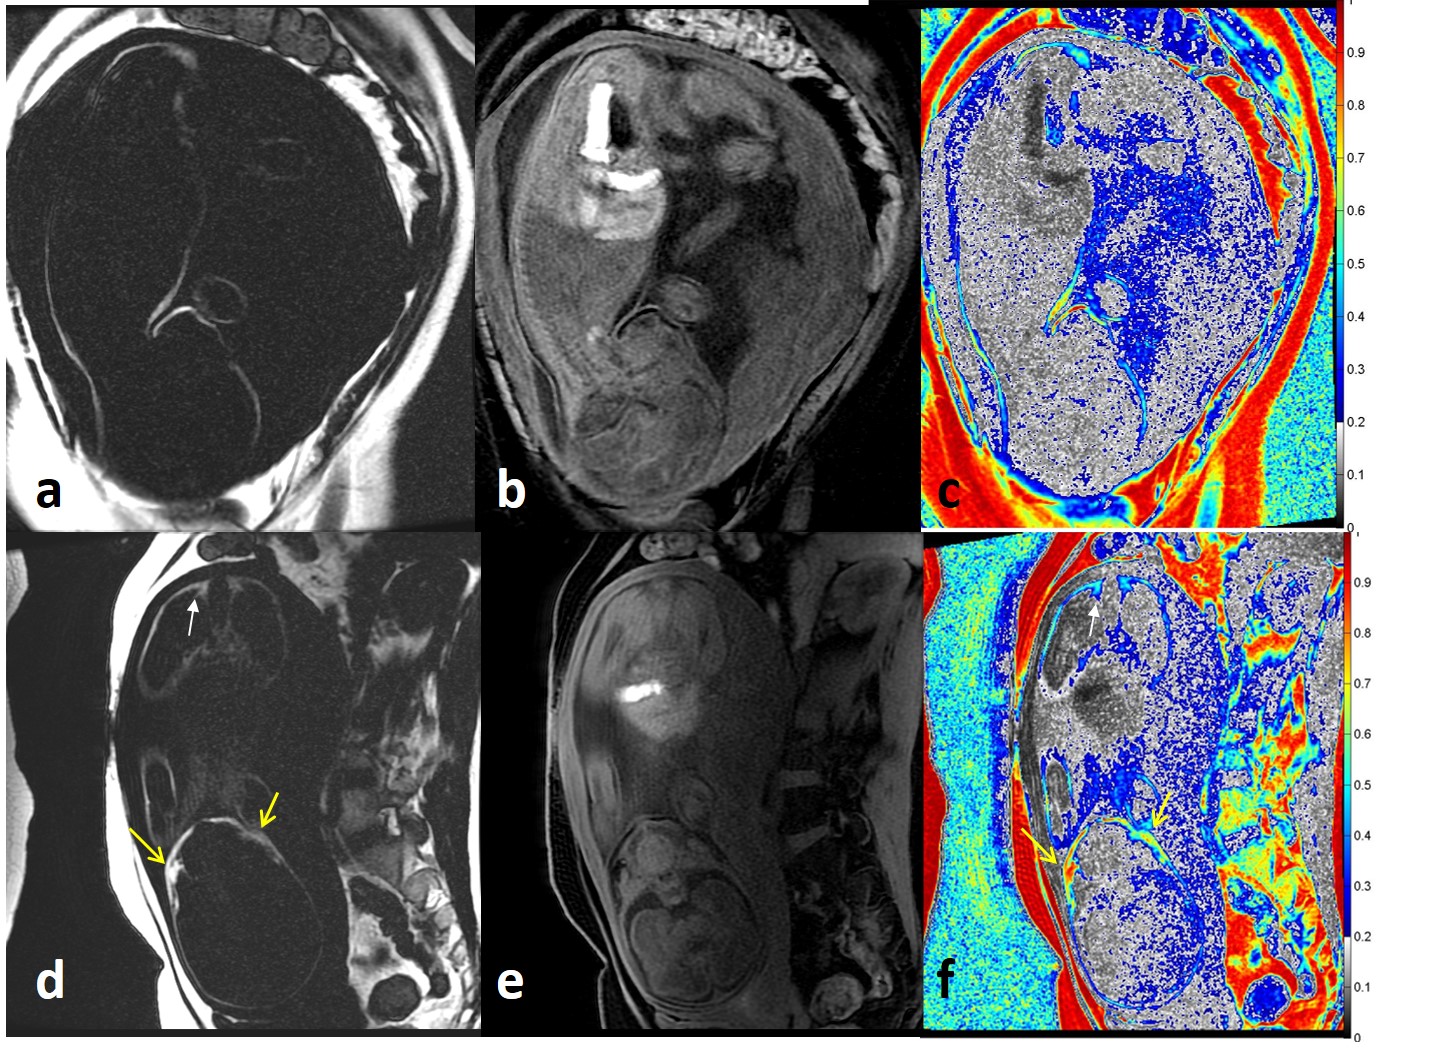
This study was approved by institutional review board. We retrospectively reviewed the fetal MRI exams (gestational age 19-37 weeks) from 2010 to 2016. Only those without intrauterine growth retardation confirmed by US were recruited. Those with severe/ multiple congenital anomaly were excluded. Three orthogonal sagittal, coronal, and axial planes of fetal brains and bodies were routinely performed with fast MR imaging techniques (Single Shot Fast Spin-Echo) on a 1.5T MR scanner (Optima MR450w®, General Electric Healthcare). In addition, 2-point Dixon method (liver acquisition with volume acceleration, LAVA-Flex) was performed using the following protocol: TR: 6.3-6.4 msec, TE1/TE2: 2.1/4.2 msec, flip angle: 12°, field of view: 290×290 mm to 360×360 mm, matrix size 270×270, slice thickness 4 mm, 2 mm overlapping slices. Fat-only, water-only, and fat fraction maps (fat / (fat+water)) were generated for the acquired 3D volume. On fat-only image, we defined the following grading system for the presence of fat: Grade 0 referred to no visible fat; Grade 1referred to faint and blurred high signal intensity; and Grade 2 referred to bright high signal intensity. Each grade was assigned for face, posterior neck, upper arm, supraclavicular region, axillary region, lower back, buttock, ischiorectal fossa, thigh, and infrapatellar regions. For measuring the fat fraction, hand-drawn regions of interest (ROIs) were selected for the above mentioned locations if considered presence. ROIs at the subcutaneous fat and intraabdominal fat of mother and amniotic fluid were also placed as references. The fat fraction (fat / (fat+water)) was calculated for each region.Results
Total 61 pregnant women and 63 fetus (Number of twin: 2) received MR exam. The fat grading and fat fraction of the fetus in different gestational ages were listed in Fig 1 and 2. The relationship of the gestational age and fat fraction of different body locations were demonstrated in Fig 3. The fat at face appears the earliest in body, followed by subcutaneous fat of other body part in the order of buttock, thigh, posterior neck, upper arm and lower back (Fig 4 and 5). Most subcutaneous fat could be well visualized at 27-28 weeks. The fat at deep part (supraclavicular region, axillary region, ischiorectal fossa, and infrapatellar regions) appeared later, and became obvious at 27-28 weeks. Generally the subcutaneous fat had higher fat fraction as compared to deep fat, whereas the fat fraction in all body part gradually increased during the developmental process (Fig 3).Discussion
It has been demonstrated that the composition of fat, namely fat fraction, could be demonstrated by two-point 3D spoiled gradient echo technique. 5 Using the technique, we found that the fat development within fetal body followed a predictable chronological sequence not only in terms of location but also composition. The fat at face appears the earliest and persistently visible since 22-23 weeks. The fat developed quickly and become apparent during the early third trimester (27-29 weeks). The fat in the fetal body, regardless of location, all show increased fat fraction during the process of gestation.Conclusion
By this project, the normal developmental pattern of fetal fat was established. The results could be applied as a reference for evaluating the development of fetus with congenital abnormality and maternal metabolic disease.Acknowledgements
No acknowledgement found.References
1. Atallah A, Lacalm A, Massoud M, et al. Limitations and pitfalls in prenatal diagnosis of pericallosal curvilinear lipoma based on a specific imaging pattern. Ultrasound in obstetrics & gynecology : the official journal of the International Society of Ultrasound in Obstetrics and Gynecology. 2017.
2. Berger-Kulemann V, Brugger PC, Reisegger M, et al. Quantification of the subcutaneous fat layer with MRI in fetuses of healthy mothers with no underlying metabolic disease vs. fetuses of diabetic and obese mothers. Journal of perinatal medicine. 2011;40(2):179-184.
3. Anblagan D, Deshpande R, Jones NW, et al. Measurement of fetal fat in utero in normal and diabetic pregnancies using magnetic resonance imaging. Ultrasound in obstetrics & gynecology : the official journal of the International Society of Ultrasound in Obstetrics and Gynecology. 2013;42(3):335-340.
4. Deans HE, Smith FW, Lloyd DJ, et al. Fetal fat measurement by magnetic resonance imaging. The British journal of radiology. 1989;62(739):603-607.
5. Franz D, Karampinos DC, Rummeny EJ, et al. Discrimination Between Brown and White Adipose Tissue Using a 2-Point Dixon Water-Fat Separation Method in Simultaneous PET/MRI. Journal of nuclear medicine : official publication, Society of Nuclear Medicine. 2015;56(11):1742-1747.
Figures