4557
Feasibility of Estimating Umbilical Vein Oxygen Saturation with Susceptometry-Based Oximetry1Department of Radiology, University of Pennsylvania, Philadelphia, PA, United States, 2Department of Obstetrics and Gynecology, Division of Maternal-Fetal Medicine, University of Pennsylvania, Philadelphia, PA, United States
Synopsis
Quantitative MRI allows the estimation of fetal oxygen transport in vivo, for which knowledge of the oxygen saturation (HbO2) of blood in the umbilical vein (UV) is required. The method of choice to estimate HbO2 in fetal applications is T2-based oximetry, which requires a sequence-specific calibration equation to convert blood T2 to HbO2. Therefore, in the present work we examined the feasibility of using susceptometry-based oximetry (SBO) to measure HbO2 at the UV as it is calibration-free and implementable across field strengths. Results show, in a limited number of participants, no difference in HbO2 measured with both MRI-based oximetric techniques.
INTRODUCTION
Quantitative MRI allows the estimation of fetal oxygen transport in vivo,1 for which knowledge of the oxygen saturation (HbO2) of blood in the umbilical vein (UV) is required. Two MRI-based oximetric methods exist: T2– and susceptometry–based oximetry (T2Ox and SBO, resp.).2,3 Both techniques have unique strengths and limitations that make them suitable for different applications. For example, T2–based oximetry requires a sequence-specific calibration curve to convert whole blood T2 to HbO2 levels. Such calibration curves are laborious to produce, and once established, identical scanning parameters must be maintained. In fact, the study of fetal oxygen metabolism has primarily relied on T2Ox.1 On the other hand, SBO is a phase-based method limited to relatively straight vessels w.r.t. the main field. In addition, SBO requires vessel-adjacent tissue as a phase reference, a condition which is not always met. However, SBO is calibration-free, resulting in a sequence implementable across field strengths and system platforms. Therefore, in the present work we explore the feasibility of utilizing SBO to quantify HbO2 in the UV.METHODS
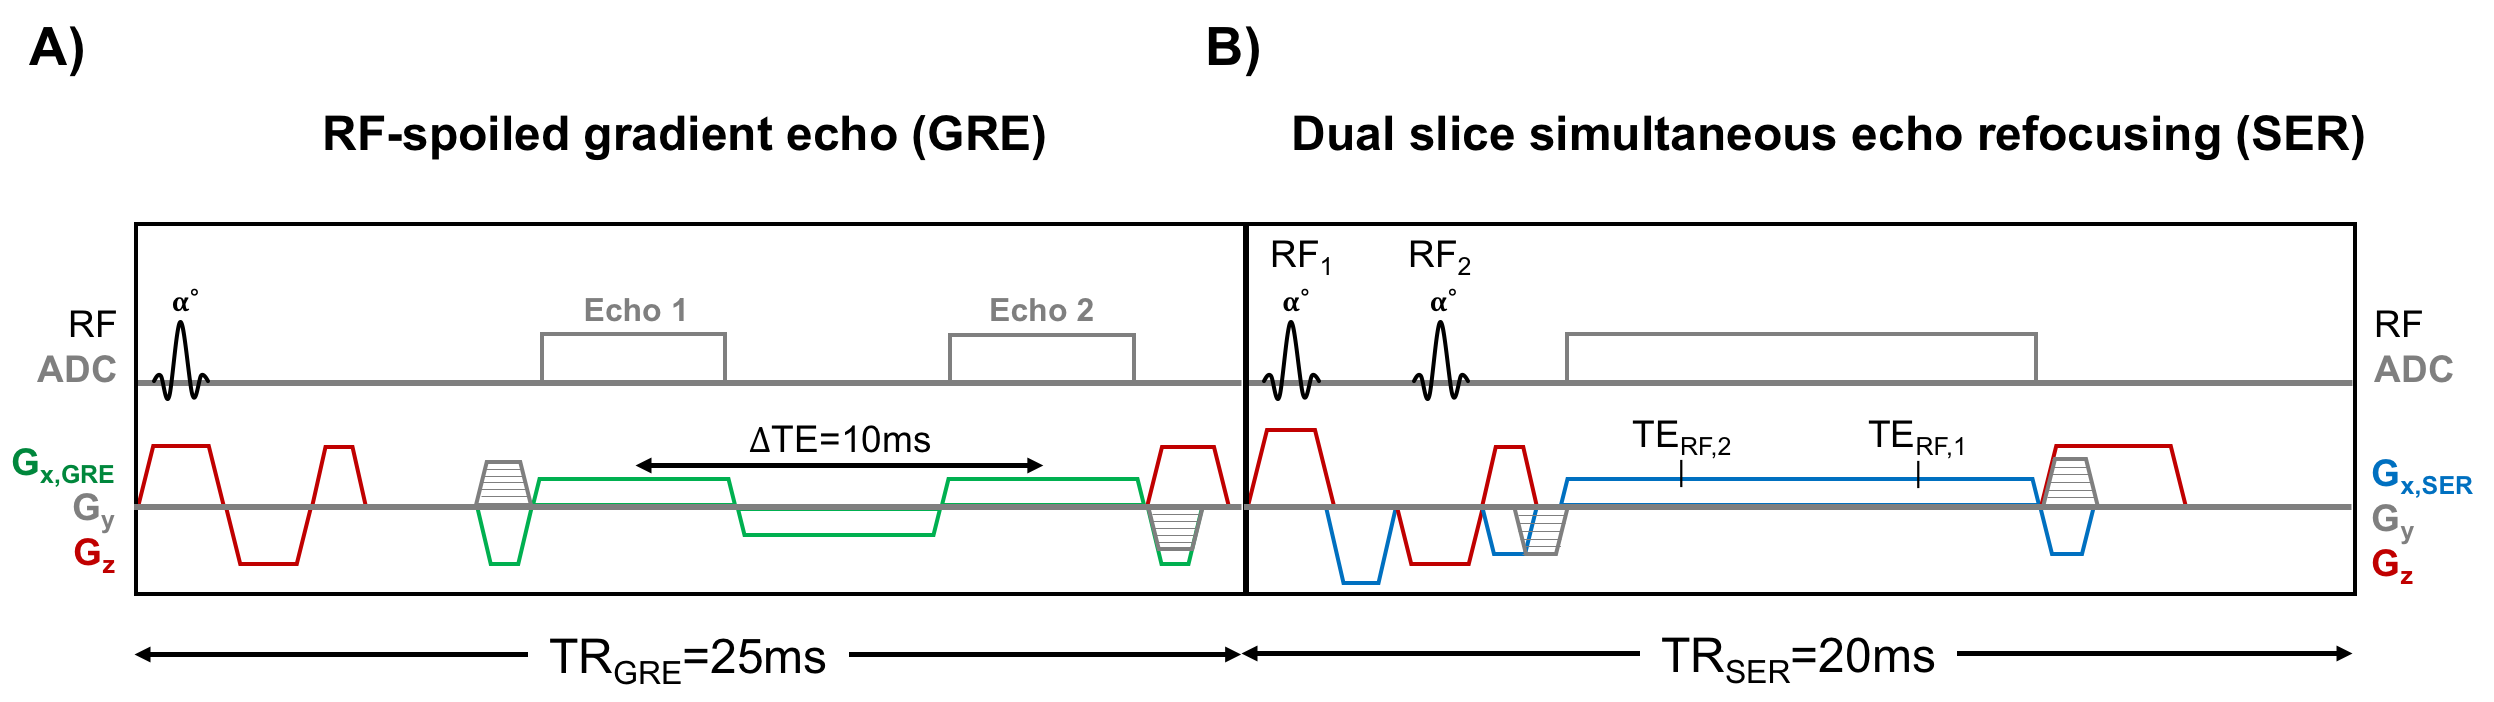
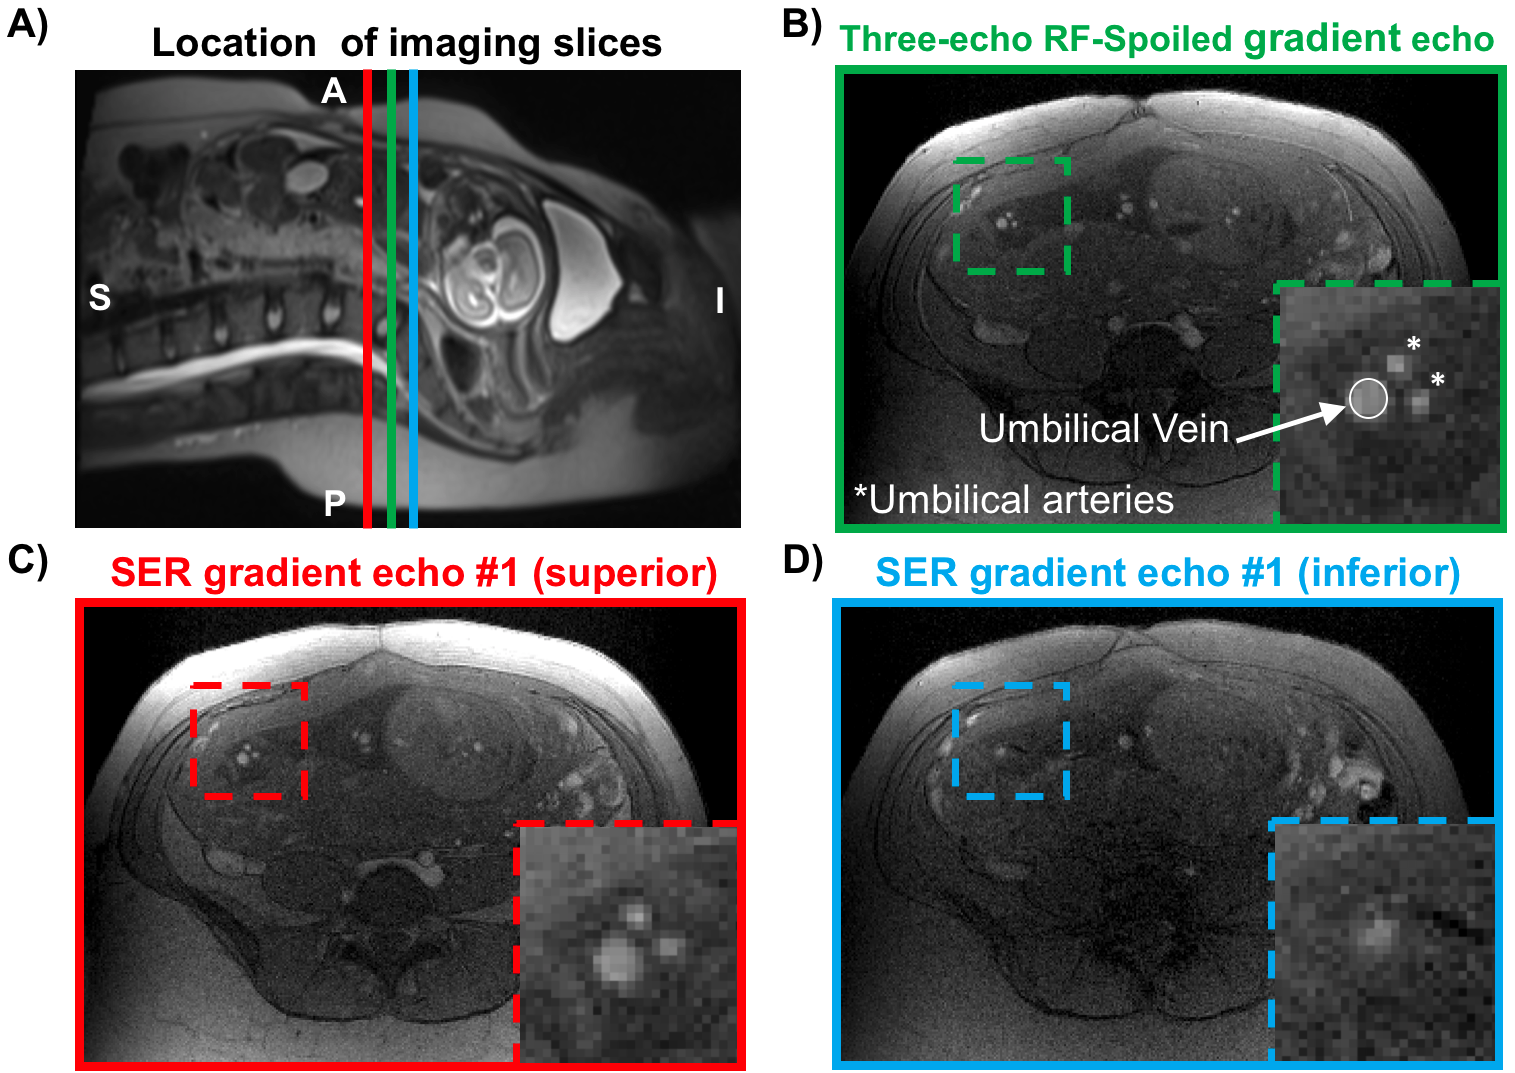
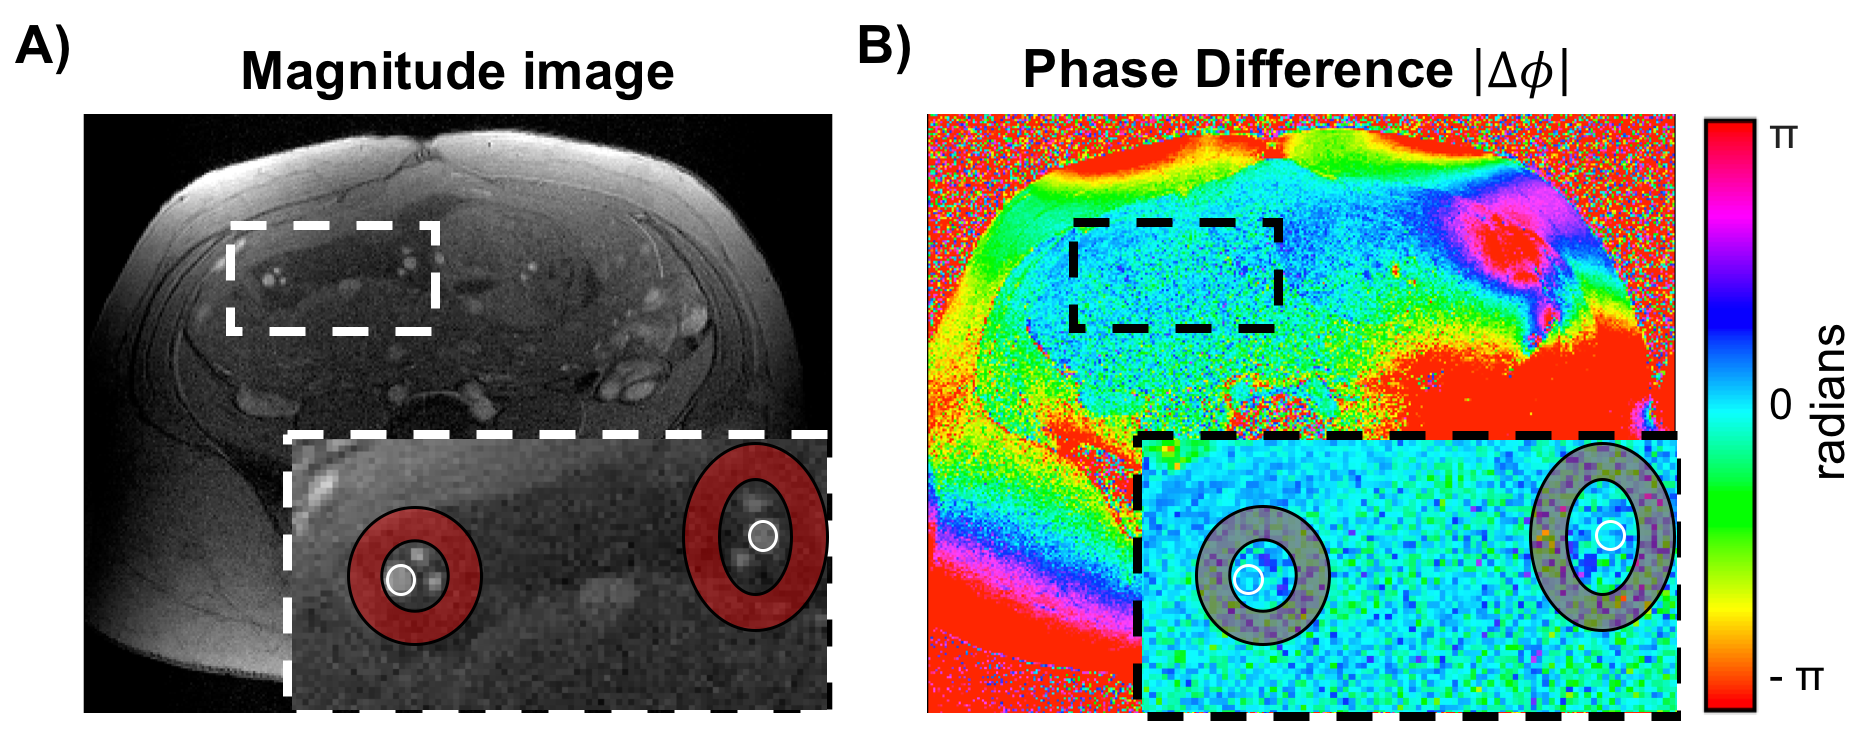
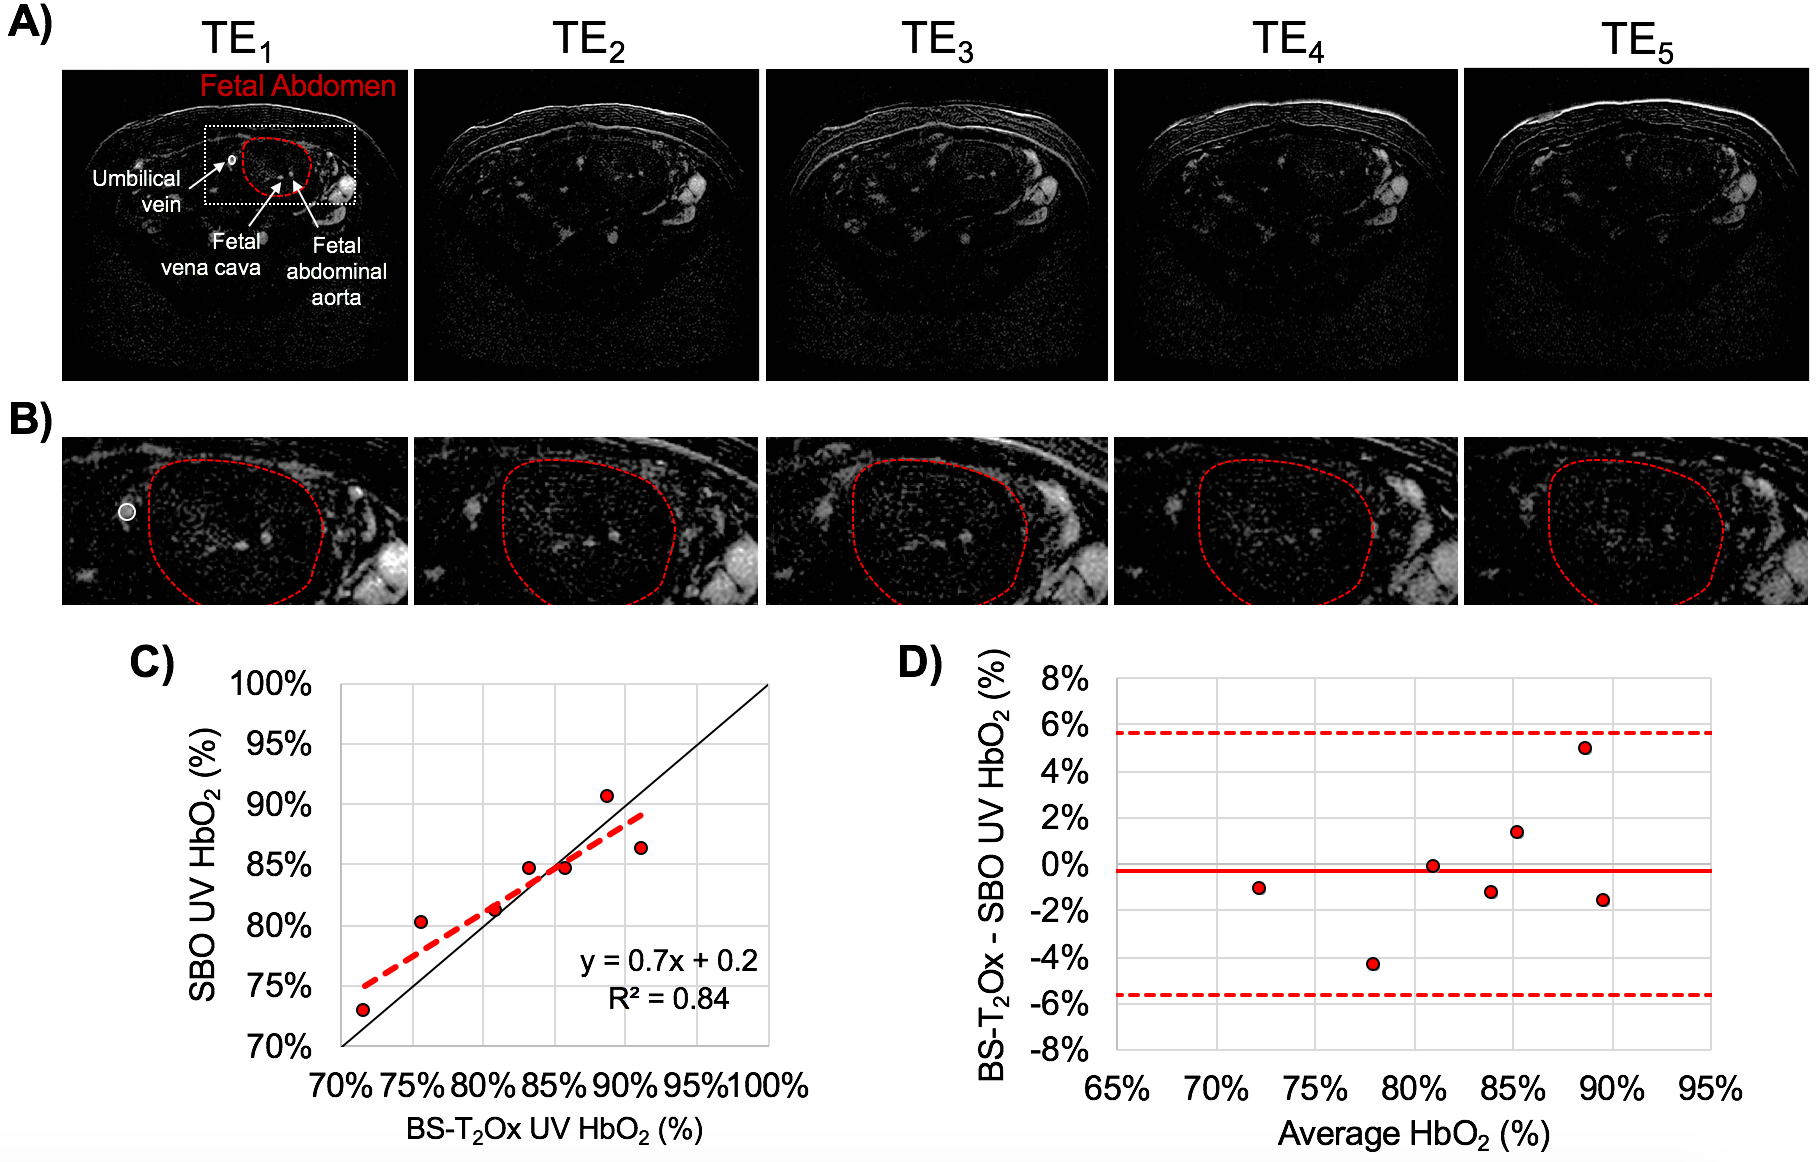
Fourteen pregnant women (gestational age, GA=26±7wks, range=17-37wks) were scanned at 1.5T (Siemens Avanto, Erlangen, Germany) with two flexible body coils placed on the abdomen. UV HbO2 was estimated using SBO as $$$HbO_2=[1-\frac{2|\Delta\phi|}{\gamma\chi_{do}\Delta TE \cdot{B_0}(\cos^2\theta-1/3)Hct}]$$$, where Δφ is the average phase difference between intravascular blood and the surrounding tissue, χdo is the susceptibility difference between fully deoxygenated and fully oxygenated erythrocytes, ΔTE is the inter-echo spacing, θ is the angle of the UV w.r.t. B0 and Hct is the hematocrit.3 Once a relatively straight section of the UV was identified SBO data were acquired using an axial single-slice three-echo RF-spoiled gradient echo (GRE) acquisition (Figure 1A) interleaved with a dual-slice acquisition using simultaneous echo refocusing (SER, Figure 1B). These two slices were located 10mm superior and inferior to the SBO imaging slice, yielding a total of three images (Figure 2A). Imaging parameters: TRGRE=25ms, TEGRE=10ms, TRSER=20ms, TESER,1=8.8ms, TESER,2=3.5ms, FOV=307×307mm2, voxel size=1×1×5mm3, FA=15°, and scan duration of 20sec. Phase accrual difference between the UV and surrounding tissue, Δφ , was estimated between the first and third echoes of the RF-spoiled GRE multi-echo GRE (Figure 2B). UV and reference tissue regions of interest (ROIs) were manually traced on the magnitude image using ImageJ4 and applied to a bias field corrected phase map.5 The angle θ was estimated using the two images acquired with SER (Figures 2C&D). Hematocrit (Hct) is needed in both oximetric methods, in the present work population averages were used.6 The average Hct for GA<22wks was not available, in such cases Hct(GA=22) was used. T2Ox HbO2 data were acquired using a background suppressed (BS)7 T2-prepared balanced steady-state free precession (BS-T2bSSFP)8 sequence, not necessarily in the axial plane. Fetal blood T2 values were converted to HbO2 values using an established calibration equation.9 Imaging parameters: T2-preparation TEs=0,48,96,144,192ms, bSSFP TR/TE=4.1/2.05ms, duration of BS module 3000ms, FOV=300×300mm2, voxel size=0.8×0.8×5mm3, FA=60°, half-Fourier with 14 reference lines, inter-pulse interval (τ180) of 12ms and scan duration of 1:06 minutes. Intra-class correlation coefficient (ICC), Bland-Altman and paired t-tests were used to evaluate agreement between both oximetry methods.RESULTS
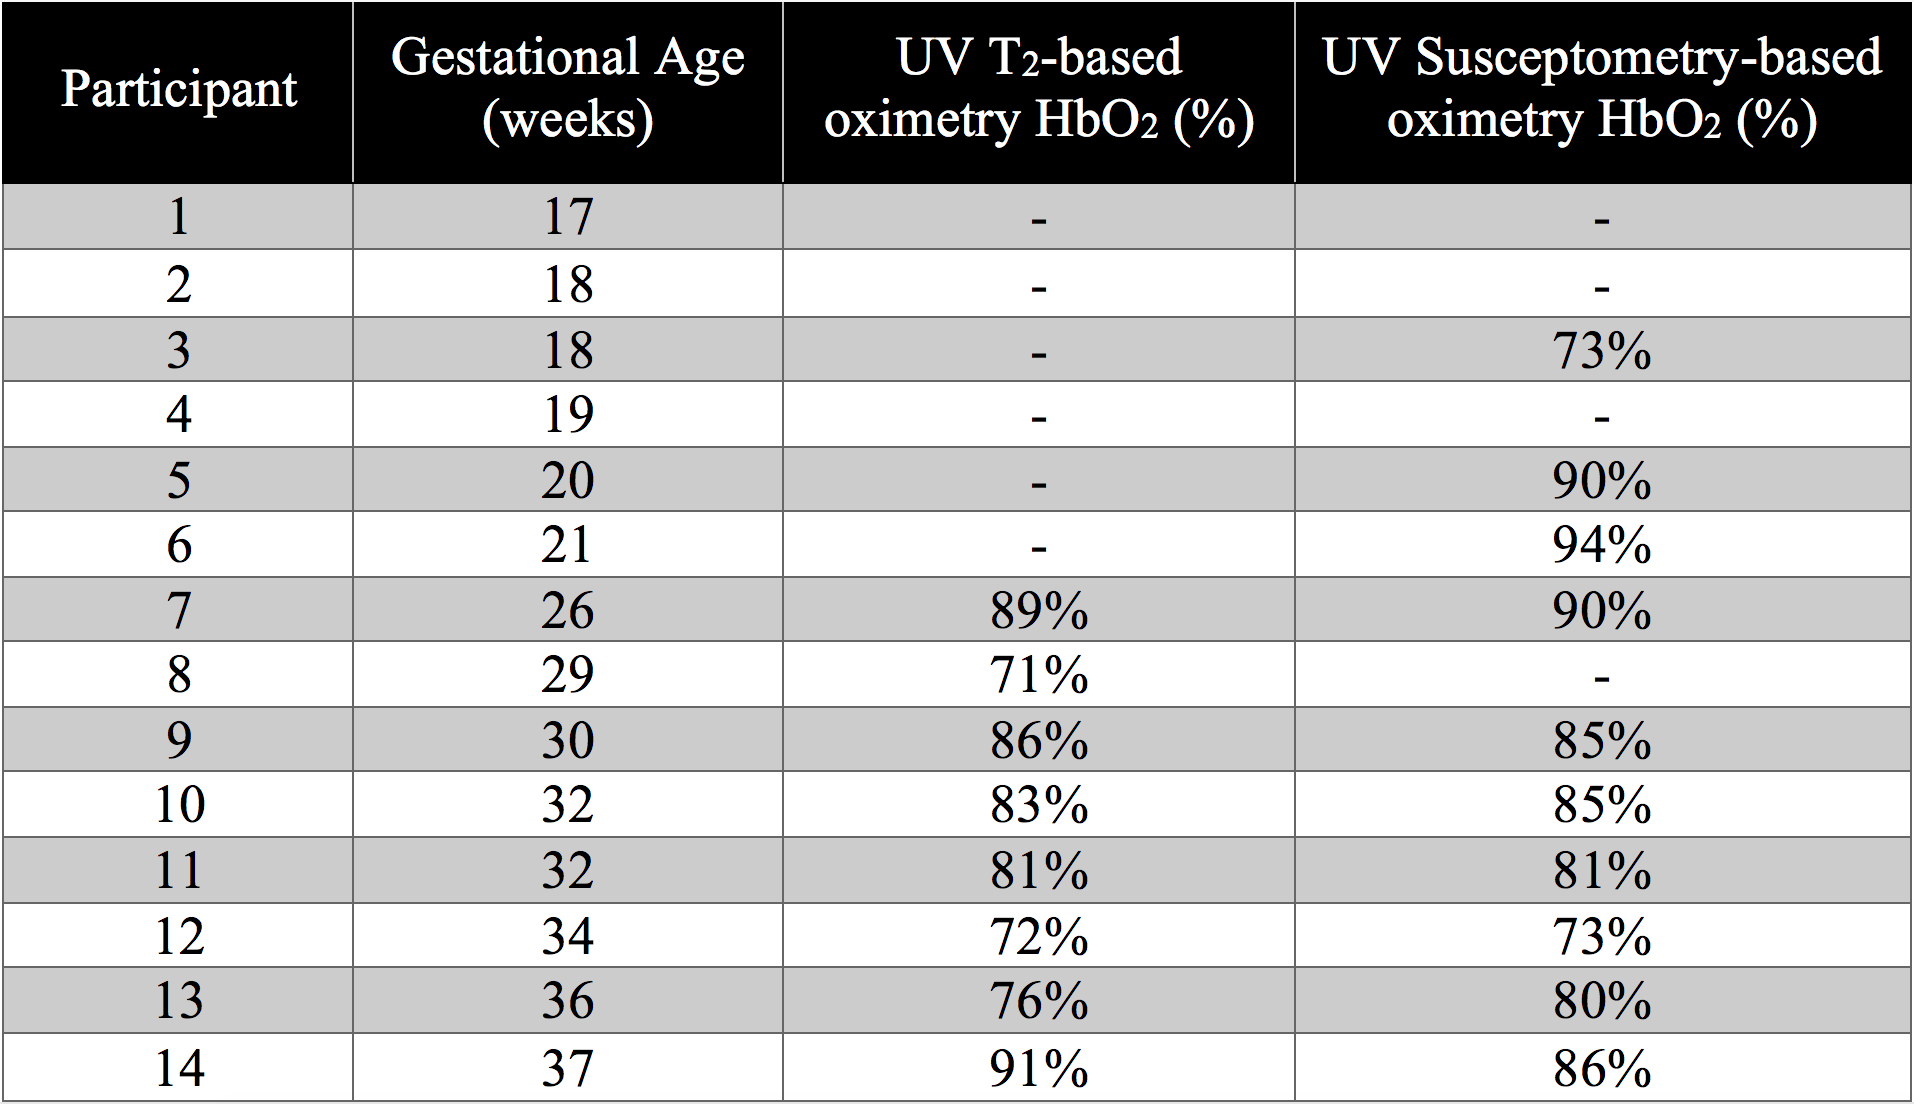
Example datasets are shown in Figures 3 and 4. T2Ox was successfully acquired in 8 pregnant women of GA≥26wks, while SBO was possible in 10 cases at GA≥18wks (Table 1). HbO2 was estimated with both T2Ox (average HbO2=83±7%) and SBO (average HbO2=83±6%) in seven cases all at GA≥26wks (Table 1). Results from the two methods were well correlated (HbO2,SBO=0.7·HbO2,T2+0.2, R2=0.84, intra-class correlation coefficient 0.71, Figure 4C). However, no significant difference was found between methods (paired t-test, p>0.05), confirmed by the Bland-Altman analysis showing a mean difference (HbO2,T2–HbO2, SBO) of -0.3%, well within the 95% confidence interval (±2.9%, Figure 4D).DISCUSSION AND CONCLUSIONS
Good agreement was found between BS-T2Ox and SBO in the UV. The earliest GA at which it was possible to extract UV HbO2 via T2Ox was 26 weeks for the present study and 23 weeks in general in the authors’ experience. Here, we explored the feasibility of utilizing SBO for this purpose and found that such measurements were achievable as early as 18 weeks of GA. Although HbO2 measurements by both oximetry methods were not found to be different from each other, these data should be interpreted with some caution given the small number of participants. Further, it must be kept in mind that SBO HbO2 may be susceptible to partial volume effects, which lead to overestimated HbO2 values and, of course, is subject to the usual limitations in terms of vessel angle with respect to static magnetic field. It is of particular clinical relevance to determine how early during pregnancy either method is applicable.Acknowledgements
Human Placental Project U01 HD087180.References
1. Sun L, Macgowan CK, Sled JG, Yoo SJ, Manlhiot C, Porayette P, Grosse-Wortmann L, Jaeggi E, McCrindle BW, Kingdom J and others. Reduced fetal cerebral oxygen consumption is associated with smaller brain size in fetuses with congenital heart disease. Circulation 2015;131(15):1313-23.
2. Wright G, Hu B, Macovski A. Estimating oxygen saturation of blood in vivo with MR imaging at 1.5T. Magn Reson Med. 1991;1:275-83.
3. Fernandez-Seara MA, Techawiboonwong A, Detre JA, Wehrli FW. MR susceptometry for measuring global brain oxygen extraction. Magn Reson Med. 2006;55:967-73.
4. Schneider, C.A., Rasband, W.S., Eliceiri, K.W. "NIH Image to ImageJ: 25 years of image analysis". Nature Methods 9, 671-675, 2012.
5. Langham MC, Magland JF, Floyd TF, Wehrli FW. Retrospective correction for induced magnetic field inhomogeneity in measurements of large-vessel hemoglobin oxygen saturation by MR susceptometry. Magn Reson Med 2009;61(3):626-33.
6. Jopling J, Henry E, Wiedmeier SE, Christensen RD. Reference ranges for hematocrit and blood hemoglobin concentration during the neonatal period: data from a multihospital health care system. Pediatrics 2009;123(2):e333-7.
7. Maleki N, Dai W, Alsop DC. Optimization of background suppression for arterial spin labeling perfusion imaging. MAGMA 2012;25(2):127-33.
8. Rodríguez-Soto AE, Abdulmalik O, Langham MC, Schwartz N, Lee H, Wehrli FW. T2 -prepared balanced steady-state free precession (bSSFP) for quantifying whole-blood oxygen saturation at 1.5T. Magn Reson Med 2017.
9. Rodríguez-Soto AE, Langham MC, Abdulmalik O, Englund E, Schwartz N, Wehrli FW. MRI Quantification of Human Fetal O2 Delivery Rate in the Second and Third Trimesters of Pregnancy. Magn Reson Med 2017. In Press.
Figures