4555
Support vector machine prediction of clinical pain response using resting-state fMRI1Functional MRI Laboratory, University of Michigan, Ann Arbor, MI, United States, 2Biomedical Engineering, University of Michigan, Ann Arbor, MI, United States, 3Anesthesiology, University of Michigan, Ann Arbor, MI, United States, 4Pfizer Inc., Groton, CT, United States
Synopsis
The mechanisms of chronic pain and its response to pharmacological treatment remains an open challenge. Multivariate pattern analysis can offer an alternative to standard analysis techniques. This study applies SVM classification in resting-state fMRI data to predict improvements in clinical pain after drug therapy.
Introduction
In functional neuroimaging, multivariate pattern analysis (MVPA) and classification can offer an alternative to standard univariate analysis techniques1. Applications in resting-state fMRI have included classification of autism vs controls2 and prediction of brain age3.
The exact mechanisms operative in some forms of chronic pain and their responses to pharmacological treatment remain an open challenge. Previous univariate work in fibromyalgia, a common chronic pain condition, has examined drug effects on brain connectivity and functional response4,5. Recently, MVPA has been applied to explaining neural responses in pain6,7.
This study applies SVM multivariate analysis to resting state functional connectivity maps in chronic pain subjects that underwent drug therapy with pregabalin, milnacipran, or placebo to predict improvements in clinical pain after therapy.
Methods
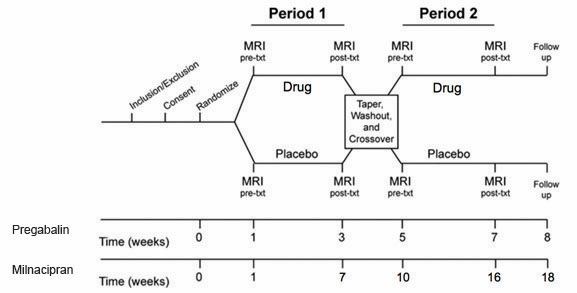
Subjects: A population of subjects with fibromyalgia underwent drug therapy: a set of thirteen subjects underwent pregabalin/placebo therapy4, and a separate set of fifteen subjects underwent therapy with milnacipran/placebo5. Subjects were scanned during an fMRI resting-state paradigm (eyes open, fixation cross) at baseline and after completing each treatment arm (see Figure 1). Clinical pain was assessed at each neuroimaging visit with a numerical rating scale.
Data acquisition: Resting-state fMRI data was acquired on a 3.0 T GE scanner using a T2*-weighted spiral-in sequence (TR/TE/FA/FOV=2.0s/30ms/90/22cm, 64x64 matrix, 3mm slice thickness, 43 slices). 180 volumes were collected in each resting-state scan (six minutes total). Structural T1 overlays matching the prescription of the functional data and whole-brain T1 SPGRs were also collected for use in normalization and anatomical inspection.
Preprocessing: Data were preprocessed and analyzed using FSL (www.fmrib.ox.ac.uk/fsl) and SPM (FIL, London, UK), including physiological noise correction using RETROICOR8, motion correction, spatial normalization and spatial smoothing (8 mm FWHM).
Connectivity Analysis: Preprocessed data then underwent connectivity analyses via the Functional Connectivity Toolbox v2.0 (CONN) (www.nitrc.org/projects/conn) in SPM8. Component-based noise correction was done using CompCor9. A band pass filter (0.01–0.1 Hz) was used to remove high-frequency noise and linear drift artifacts. Regressors of no interest included motion, white matter and CSF timecourses. Connectivity maps images were then generated using a priori ROIs in the insula, inferior parietal lobule (IPL), posterior cingulate cortex (PCC), periaqueductal gray (PAG), amygdala, anterior cingulate, and dorsolateral prefrontal cortex (DLPFC).
Multivariate analysis: Support vector machine learning was performed using the libsvm toolbox version 3.1810 in MATLAB, using the resting-state connectivity images for each subject, labeled by change in pain score after intervention (high/low, median split). SVM classification was performed using a linear kernel, with leave-one-subject-out cross-validation in the testing data to calculate classification accuracies and predicted labels. Permutation testing was used to generate significance maps for the average SVM model weights to investigate their spatial distribution.
Results
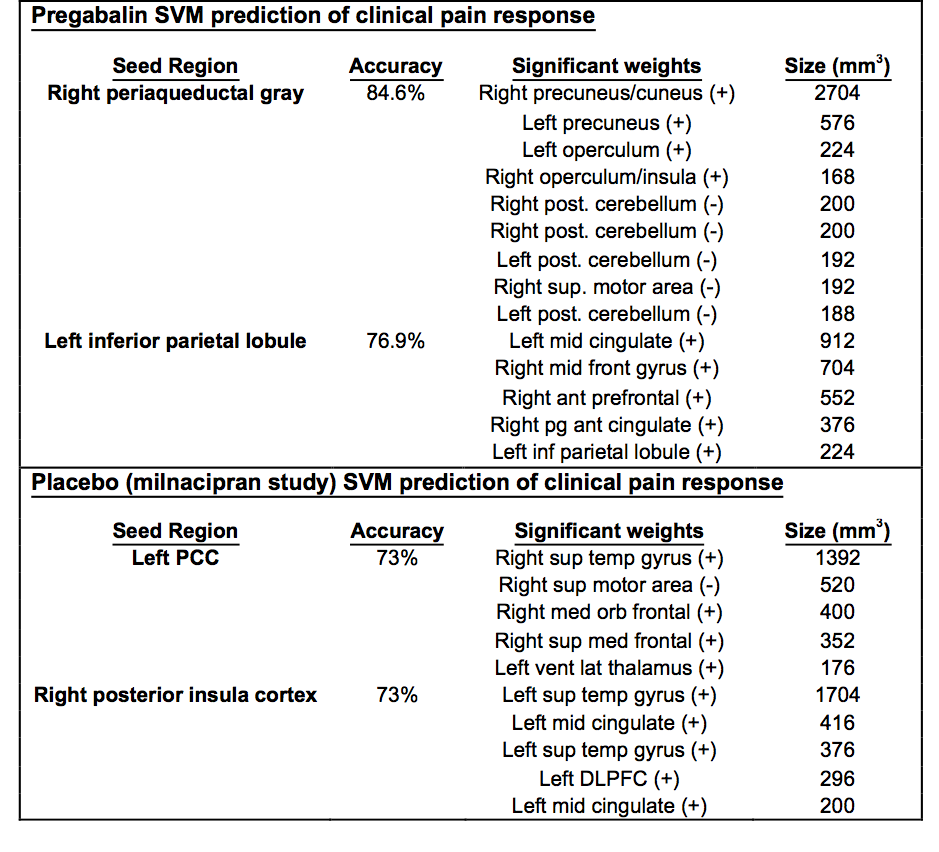
High classification accuracy was obtained for several ROI connectivity maps in both the drug and placebo conditions (see Table 1 for ROIs with accuracy > 70%). In particular, the RPAG connectivity maps yielded 85% and the LIPL yielded 77% classification accuracy in predicting high vs. low change in clinical pain response in the pregabalin group, and the LPCC and RpINS both yielded 73% accuracy in the placebo arm of the milnacipran placebo group.
Results for the placebo arm of pregabalin, and the milnacipran drug arm were obtained, but as their accuracy was below 70%, they were omitted here for space.
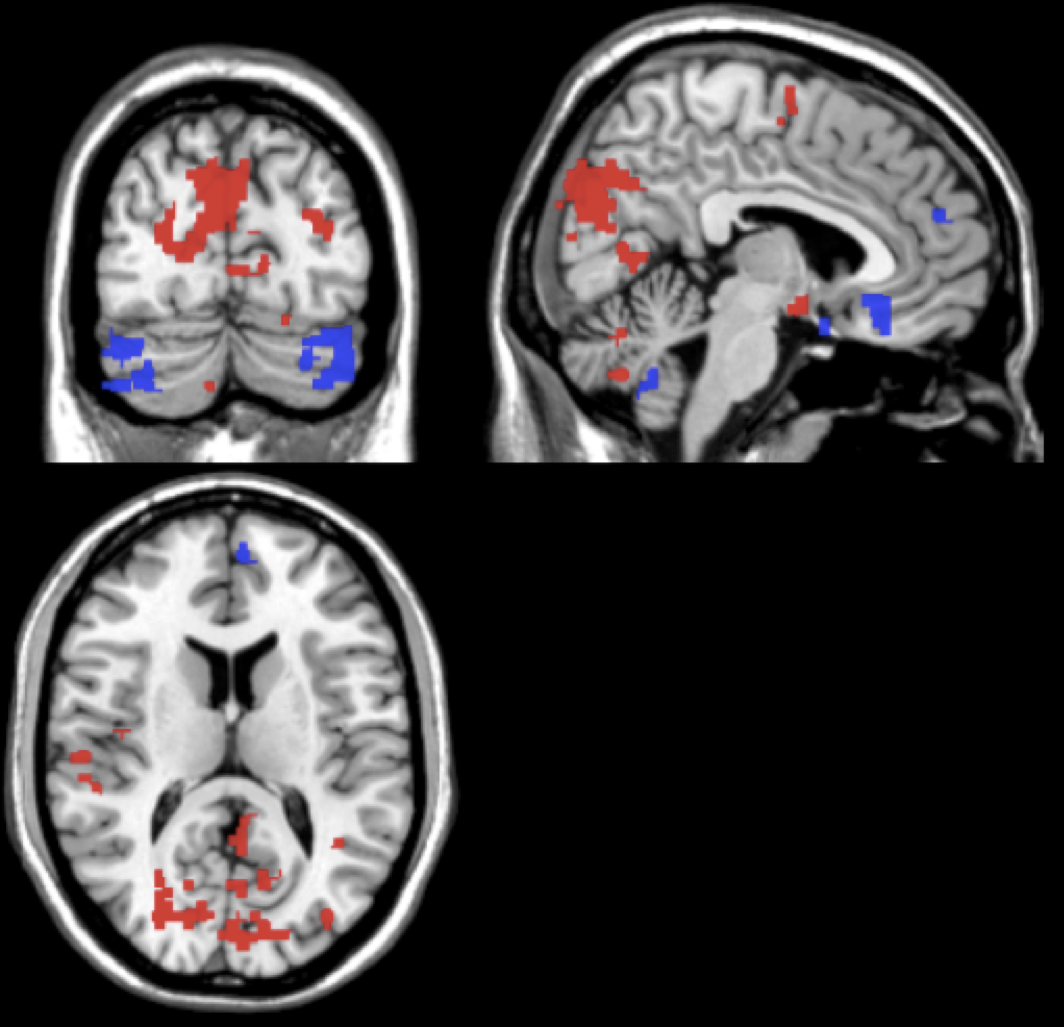
The average support vector weight models for the pregabalin SVM displayed larger weights in the precuneus, operculum/insula, cerebellum, and supplementary motor area for the RPAG seed in pregabalin (Table I, Fig 2).
Conclusions
Baseline resting state connectivity maps were found to differentially predict with high accuracy improvements in clinical pain scores following drug/placebo treatment. Top model weights included both pain-related regions (insula, thalamus) and default mode areas (precuneous, cingulate). Previous univariate fMRI analyses suggest that these regions are highly interconnected in fibromyalgia. Thus, alterations in connectivity between these networks may indicate change in pain response after pharmacological intervention.
Multivariate analysis of resting state activity could thus be used as a prognostic marker for subsequent response to pain medication. Further work will investigate if this is generalizable to other pharmacologic interventions in other chronic or acute pain conditions.
Acknowledgements
Original data collection was funded by research grants from Pfizer and Forest; Authors Harris and Clauw have consulted for Pfizer.References
1) LaConte, S. 'Support vector machines for temporal classification of block design fMRI data', NeuroImage, 2005, 26:317.
2) Anderson, JS. 'Functional connectivity magnetic resonance imaging classification of autism', Brain, 2011, 134:3742.
3) Dosenbach, N. 'Prediction of Individual Brain Maturity Using fMRI', Science, 2010, 329:1358.
4) Harris, R. 'Pregabalin rectifies aberrant brain chemistry, connectivity, and functional response in chronic pain patients', Anesthesiology, 2013, 119:1453.
5) Schmidt-Wilcke, T. 'Resting state connectivity correlates with drug and placebo response in fibromyalgia patients', Neuroimage Clinical, 2014, 6:252.
6) Wager, T. 'An fMRI-Based Neurologic Signature of Physical Pain', N Engl J Med, 2013, 368:1388.
7) Harte, SE. 'Pharmacologic attenuation of cross-modal sensory augmentation within the chronic pain insult', Pain, 2016, 157:1933.
8) Glover, G. 'Image-based method for retrospective correction of physiological motion effects in fMRI: RETROICOR', Magnetic Resonance in Medicine, 2000, 44:162.
9) Behzadi, Y. 'A component based noise correction method (CompCor) for BOLD and perfusion based fMRI', NeuroImage, 2007, 37:90.
10) Chang, C. 'LIBSVM: A library for support vector machines', ACM Transactions on Intelligent Systems and Technology, 2011, 2:27.
Figures