4554
The alexithymic trait is reflected in emotional processing in subjects below the threshold of alexithymic disorder.1VTT Technological Research Centre of Finland, Kuopio, Finland, 2Department of Applied Physics, University of Eastern Finland, Kuopio, Finland, 3Institute of Public Health and Clinical Nutrition, University of Eastern Finland, Kuopio, Finland, 4Institute of Clinical Medicine, Kuopio University Hospital, Kuopio, Finland, 5School of Educational Sciences and Psychology, University of Eastern Finland, Joensuu, Finland, 6Kuopio University Hospital, Kuopio, Finland, 7Department of Clinical Physiology and Nuclear Medicine, Kuopio University Hospital, Kuopio, Finland
Synopsis
Alexithymia is a disorder linked to altered brain processing of emotions and to other disorders and substance abuse. In sub-disorder range, alexithymia can be considered a personality trait. In this paper, we first characterize the fMRI results of emotion induction in non-alexithymic subjects, and then explore the correlation between brain activation in amygdala, anterior cingulate cortex and prefrontal cortex; and the degree of the alexithymic trait assessed by TAS-20 questionnaire. As conclusion, the alexithymic trait seems to be reflected in emotional processing already in subjects well below the threshold of alexithymia disorder.
Introduction
The interconnections between personality and behavioral characteristics, and brain responses to emotion-eliciting stimuli1 are a topic of active research. Alexithymia, the difficulty in identification, recognition and verbalization of emotions, is a trait associated with altered brain responses to cues of sadness and fear2,3,4. It is linked to other disorders and substance abuse5. In this paper, we first characterize the brain activation to visual stimuli of varying valence in healthy subjects, and then explore the correlation to the degree of the sub-disorder-threshold alexithymic trait.Methods
The alexithymic trait was assessed using TAS-20 questionnaire in 20 healthy women, age 25 – 45 years. TAS scores ranged from 28 to 53, indicating none of them were alexithymic (TAS cut-off 61). They underwent an fMRI scan (3 T, 3x3x3 mm3, gradient echo EPI, TE /TR 35/3000 ms) of block design: 12 s of visual stimulation (single picture) and 12 s washout (rasterized landscape); 40 picture pairs were shown. The stimuli presented four categories: Palatable food items (positive food) and pleasant scenes from family life and nature (positive non-food). The negative pictures included spoiled, inedible foods (negative foods) and e.g. violence and bodily injuries (negative non-food.) The subjects also rated their perceived arousal and liking for each picture on a scale 0 – 10, and selected nouns to describe their feelings associated with the pictures from a list of 58 words.
The fMRI data were analyzed using SPM12. Standard preprocessing was used for timing, motion, and co-registration. Contrast vectors of meaningful comparisons between image categories, as well as food vs. non-food and positive vs. negative were created. On group level, contrasts were analyzed (1-sample t-test) using the covariates: age, BMI, perceived hunger, and TAS-20 score. The analysis was focused on amygdalae, anterior cingulate cortex (ACC) and medial prefrontal cortex (MPFC), which have previously been shown to function abnormally in subjects with high degree of alexithymia2,3,4. The analysis was done on ROIs6 (1-sample t-test, p<0.05, FWE). Also, the correlations between covariates and contrasts were calculated. In addition, whole-brain analysis was run (p<0.05 FWE, min. 10 voxels per cluster) and the areas were identified using WFU PickAtlas toolbox7.
Results
As expected, in subjective ratings, the positive and negative categories were perceived different. The most used words chosen for food pictures were desire, delight and pleasure for positive ones vs. unpleasantness and disgust for negative ones; and for non-food pictures, unhurriedness, calmness, and intimacy for positive ones vs. sadness, worry, and injustice for negative ones.
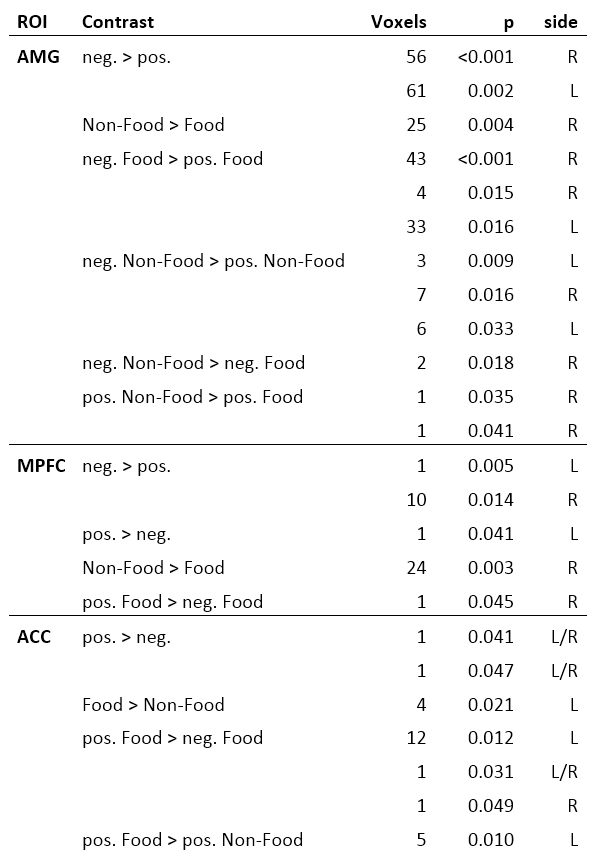
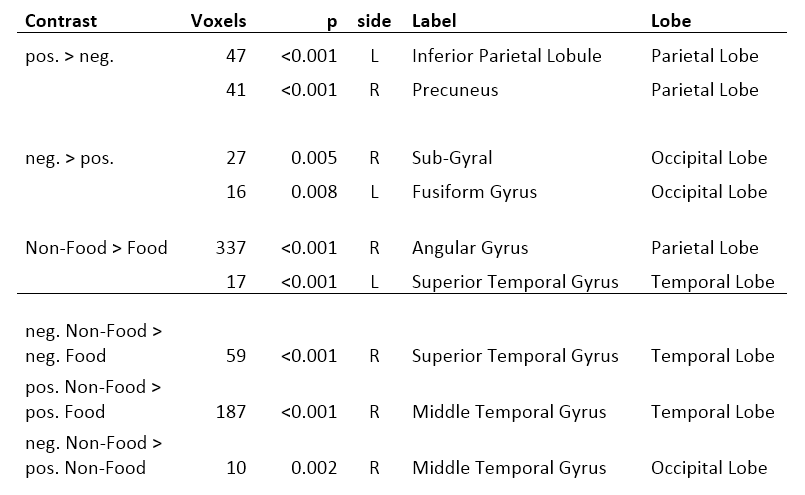
In ROIs, contrast negative vs. positive was significant in both amygdalae, and the effect was stronger for non-food than for food. Similar pattern was observed in MPFC bilaterally but there was an additional cluster in dorsal MPFC showing a reversed response. In ACC, positive pictures induced higher activity than negative. All significant responses are shown in Table 1. Significant correlations to TAS-20 score were seen in right amygdala for neg. food vs. pos. food, and in left MPFC for pos. non-food vs. neg. non-food. The activations in whole brain analysis are shown in Table 2. No significant correlations with any covariate was seen.
Discussion
The ROI results for contrasts of positive vs. negative stimuli were in line with literature on emotion induction1 which confirms the stimuli functioned as expected. The activations seen with TAS-20 score as covariant were similar as seen in alexithymic individuals2,3,4. This suggests that even in non-alexithymic individuals, the extent of the trait is reflected in brain function.
The whole-brain analysis failed to show any activations in brain areas related to emotion processing. The activations surviving the multiple comparison correction were located in the dorsal visual processing pathway and probably reflect the systematic difference in visual layout of the pictures of food and non-food. However, this difference should not influence the ROIs as those areas are not involved in automatic visual processing.
The pictures within food and non-food categories were bipolar in perceived valence but induced somewhat different reported emotions. Negative food was disgusting while negative non-food was more frightening and sad. For positive, food was desirable while non-food was pleasant and calming. Also, arousal is easy to induce by negative valence but much harder with positive content. This is the probable reason for the interesting difference in activations for pictures of the same valence but different topic.
Conclusions
The higher score in alexithymia scale seems to be reflected in emotional processing already in subjects well below the threshold of alexithymia.Acknowledgements
Academy of Finland (Grants #286028, #289382, #290183).References
1. Phan KL, Wager T, Taylor SF et al. Functional Neuroanatomy of Emotion: A Meta-Analysis of Emotion Activation Studies in PET and fMRI. NeuroImage2002; 16(2): 331–348.
2. Pouga L, Berthoz S, de Gelder B et al. Individual Differences in Socioaffective Skills Influence the Neural Bases of Fear Processing: The Case of Alexithymia. Human Brain Mapping 2010; 31(10): 1469-1481.
3. van der Velde J, Servaas MN, Goerlich KS et al. Neural correlates of alexithymia: A meta-analysis of emotion processing studies. Neuroscience & Biobehavioral Reviews 2013; 37(8): 1774–1785.
4. Berthoz S, Artiges E, Van de Moortele P-F et al. Effect of impaired recognition and expression of emotions on frontocingulate cortices: An fMRI study of men with alexithymia. American Journal of Psychiatry 2002; 159(6): 961–967.
5. De Vries AMM, Forni V, Voellinger R et al. Alexithymia in Cancer Patients: Review of the Literature. Psychotherapy and Psychosomatics 2012; 81(2): 79–86.
6. Tzourio-Mazoyer N, Landeau B, Papathanassiou D et al. Automated Anatomical Labeling of Activations in SPM Using a Macroscopic Anatomical Parcellation of the MNI MRI Single-Subject Brain. NeuroImage 2002; 15(1): 273–289.
7. Maldjian JA, LAurienti PJ, Kraft RA et al. An automated method for neuroanatomic and cytoarchitectonic atlas-based interrogation of fMRI data sets. NeuroImage 2003; 19(3): 1233–1239.
Figures