4545
Functional and metabolic magnetic resonance evaluation of the role of the aquaporin-4 in the cerebral response to appetiteIrene Guadilla1, María José Guillén1, Sebastián Cerdán García-Esteller1, and Pilar López-Larrubia1
1Instituto de Investigaciones Biomédicas CSIC-UAM, Madrid, Spain
Synopsis
Aquaporin-4 (AQP4) is the main water channel protein found in the brain. It is located at the end-feet of astrocytes allowing to maintain the ion and water balance. In our group, we previously employed functional diffusion magnetic resonance imaging to detect the swelling of astrocytes in response to appetite. In this line, we wanted to study the function of the AQP4 in the volume changes of these glial cells. For that, we administrated a glucose bolus and the aquaporin inhibitor TGN to assess the role of this protein in the brain response to a feeding stimulus.
Introduction
Aquaporin 4 (AQP4) [1] is a transmembral water channel protein that is highly expressed at the end-feet of astrocytes [2,3,4]. These glial cells have different functions in the brain like provide nutrients to the nervous tissue or maintain the extracellular ion and water balance. This balance is achieved by water transport between the two sides of the membrane and depends on concentration gradients of solutes [2,3]. Previously, our group has shown that functional diffusion magnetic resonance imaging (fDMRI) can detect the swelling of astrocytes associated to feeding/fasting paradigms [5]. In this work, we wanted to study the AQP4 role in these processes. For that, we employed diffusion MRI and an AQP4 inhibitor (TGN) [6] to assess the astrocyte changes that take place after a glucose bolus administration.Methods
Animal model. C57 BL6/J adult male mice were distributed in 3 groups (n=5 each one): i) control (nothing was injected), ii) administration of vehicle (425μL) plus glucose (200μL, 3.3mmol/kg per dose), iii) injection of TGN (525μL, 1mmol/Kg per dose) plus glucose (200μL, 3.3mmol/kg per dose). Intraperitoneal administration through a catheter was made in all cases. The protocol setup was (Fig.1): i) basal diffusion studies (at time T=0); ii) TGN administration; iii) glucose injection 20 min later and diffusion imaging right after injection (T1); iv) last diffusion acquisition 30 min after glucose administration to evaluate the astrocytes response (T2). Diffusion MRI. Anesthetized mice (1.5-2% isofluorane/oxygen) were studied in a 7T system. Two sets of diffusion studies were acquired in three orthogonal directions and 4b values (0, 150, 400 and 1000 s/mm2) the first one, and 6b values (0, 300, 600, 900, 1200, 1500, 1800 s/mm2) the second. The following parameters were employed: Δ /δ=20/4ms, TR=2500ms, TE=31ms, in-plane resolution 0.172mm/pixel, slice thickness 1.5mm, axial orientation. Images were computed with homemade software by fitting the signal in a pixel-by-pixel bases to a monoexponential (4b) and biexponential (6b) model. ROIs in hippocampus, hypothalamus and cortex were manually selected and analyzed. HRMAS study. Animals were sacrificed with a high-power focused microwave and the excised brains were regionalized in: cortex, prefrontal cortex, hippocampus, thalamus and hypothalamus. 1H HRMAS spectra were acquired in a 11.7T system using a CPMG sequence, processed with LCModel and analysed with R.Results
In control mice, the ADC decreased significantly with time probably due to the anesthesia effects. Nevertheless, the glucose administration induced the opposite effect, causing an increase of ADC in all regions assessed. This phenomenon did not happen when TGN is previously administrated to the animal (Fig.2). FDC also decreased in control hypothalamus, but there are not changes in the values when we injected glucose, and the TGN injection lead to an increase of the FDC. We found a similar behavior in FDP, although the differences are not statistically significant (Fig.3). Metabolomic studies also signaled changes in osmolites related to the volume control in cells, detected in mice with TGN. There are significant differences in glutamate and taurine in cortex and hippocampus as well as GABA in hypothalamus (Fig.4).Discussion / Conclusion
A glucose bolus administration induces a direct brain response detectable with DWI as an ADC increase due to the astrocytes shrinking by a feeding stimulus. The use of TGN blocks the AQP4 and avoids this effect, indicating that this channel is directly involved in the astrocyte volume regulation because a cerebral activation. The use of a biexponential model fitting confirms the changes induced by the inhibitor TGN through the measurements of FDC and FDP. Metabolic results correspond with an alteration of the glutamate cycle in astrocytes, because of the obstruction of the AQP4, that yield a net increase of this metabolite concentration.Acknowledgements
No acknowledgement found.References
[1] G.M. Preston, P. Agre. Isolation of the cDNA for erythrocyte integral membrane protein of 28 kilodaltons: member of an ancient channel family. Proceedings of the National Academy of Science 1991, 88:11110-11114. [2] Nielsen et al. Specialized Membrane Domains for Water Transport in Glial Cell: High-Resolution Immunogold Cytochemistry of Aquaporin-4 in Rat Brain. The Journal of Neuroscience 1997, 17(1):171-180. [3] Venero et al. Aquaporins in the central nervous system. Progress in Neurobiology 2001, 63:321-336. [4] Yoneda et al. Regulation of aquaporin-4 expression in astrocytes. Molecular Brain Research 2001, 89:94-102. [5] Lizarbe et al. Imaging hypothalamic activity using diffusion weighted magnetic resonance imaging in the mouse and human brain. Neuroimage 2013, 64:448-57. [6] Igarashi et al. Pretreatment with a novel aquaporin 4 inhibitor, TGN-020, significantly reduces ischemic cerebral edema. Neurol Sci 2011, 32:113-116.Figures
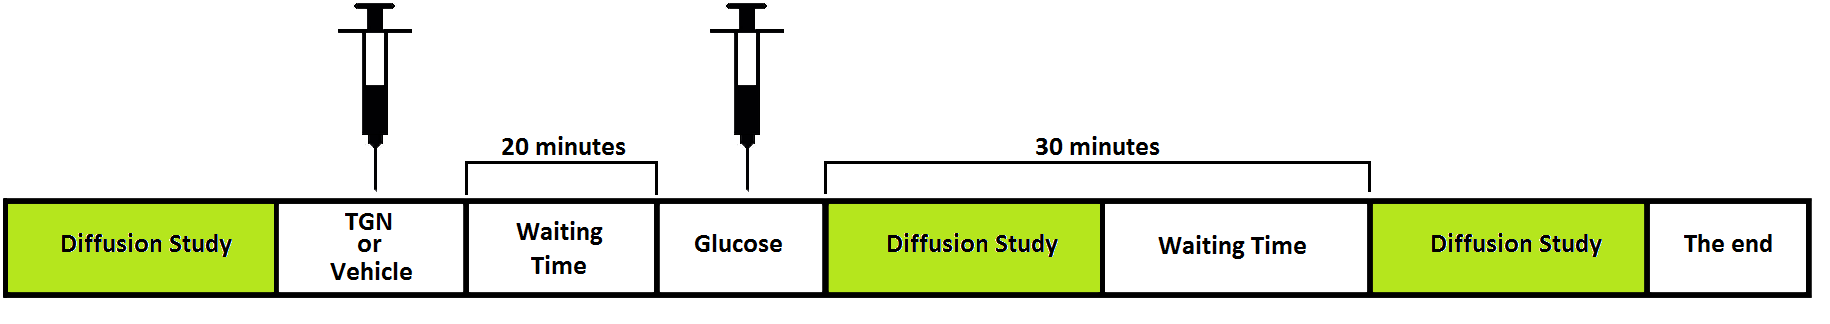
Figure 1. Protocol administration of TGN, vehicle or
glucose along Diffusion studies.
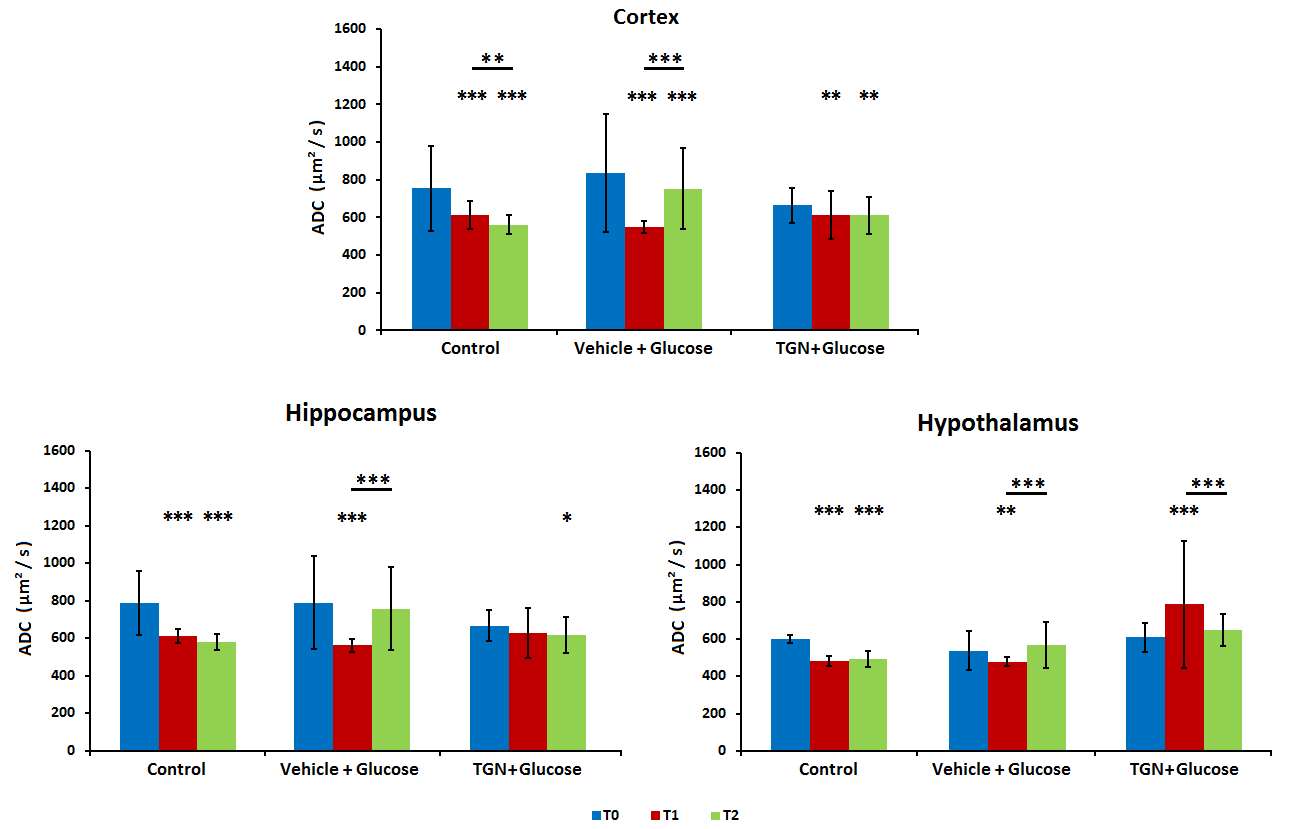
Figure 2. Diffusion studies at cortex, hippocampus and hypothalamus. ADC values for basal
(t0, blue), 20 minutes after TGN injection and immediately after glucose
injection (T1, red) and 30 minutes after glucose injection (T2, green).
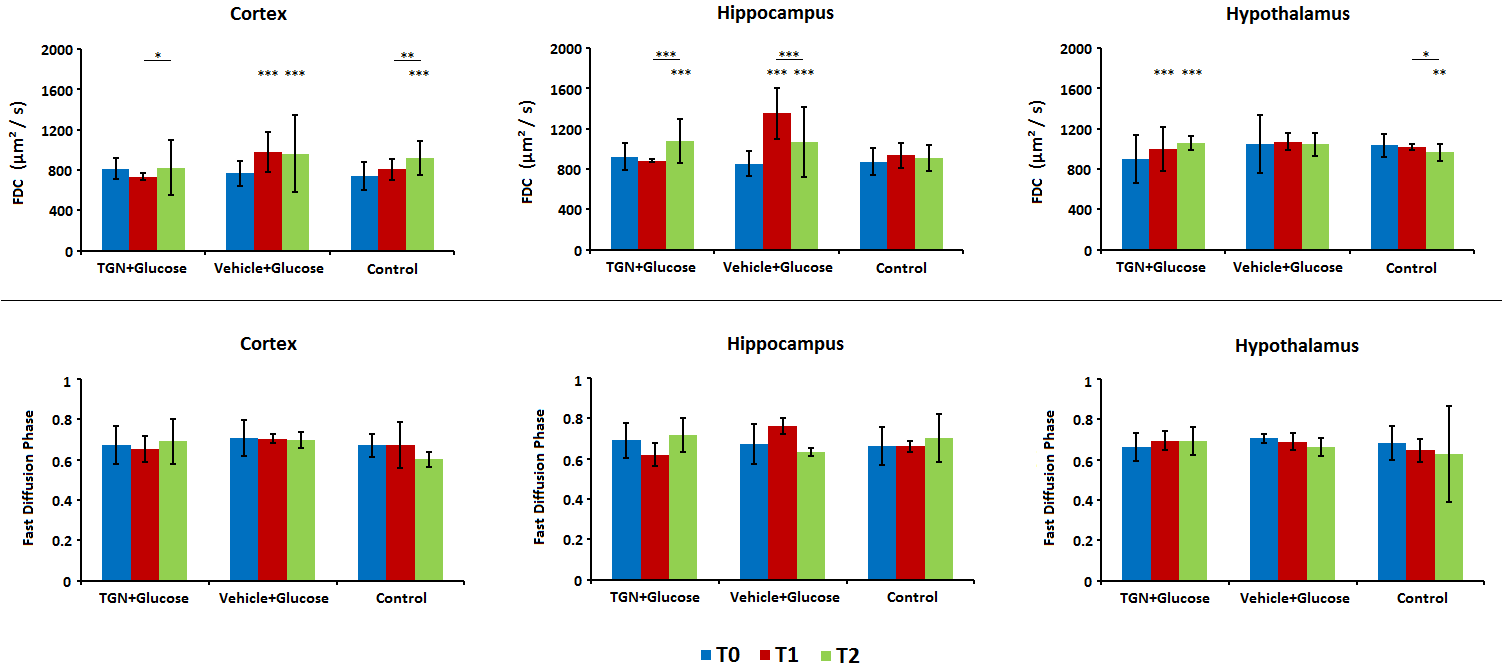
Figure 3. Fast Diffusion Coefficient and
Fast Diffusion Phase values in cortex, hippocampus and hypothalamus for basal (T0, blue), 20 minutes
after TGN injection and immediately after glucose injection (T1, red) and 30
minutes after glucose injection (T2, green).
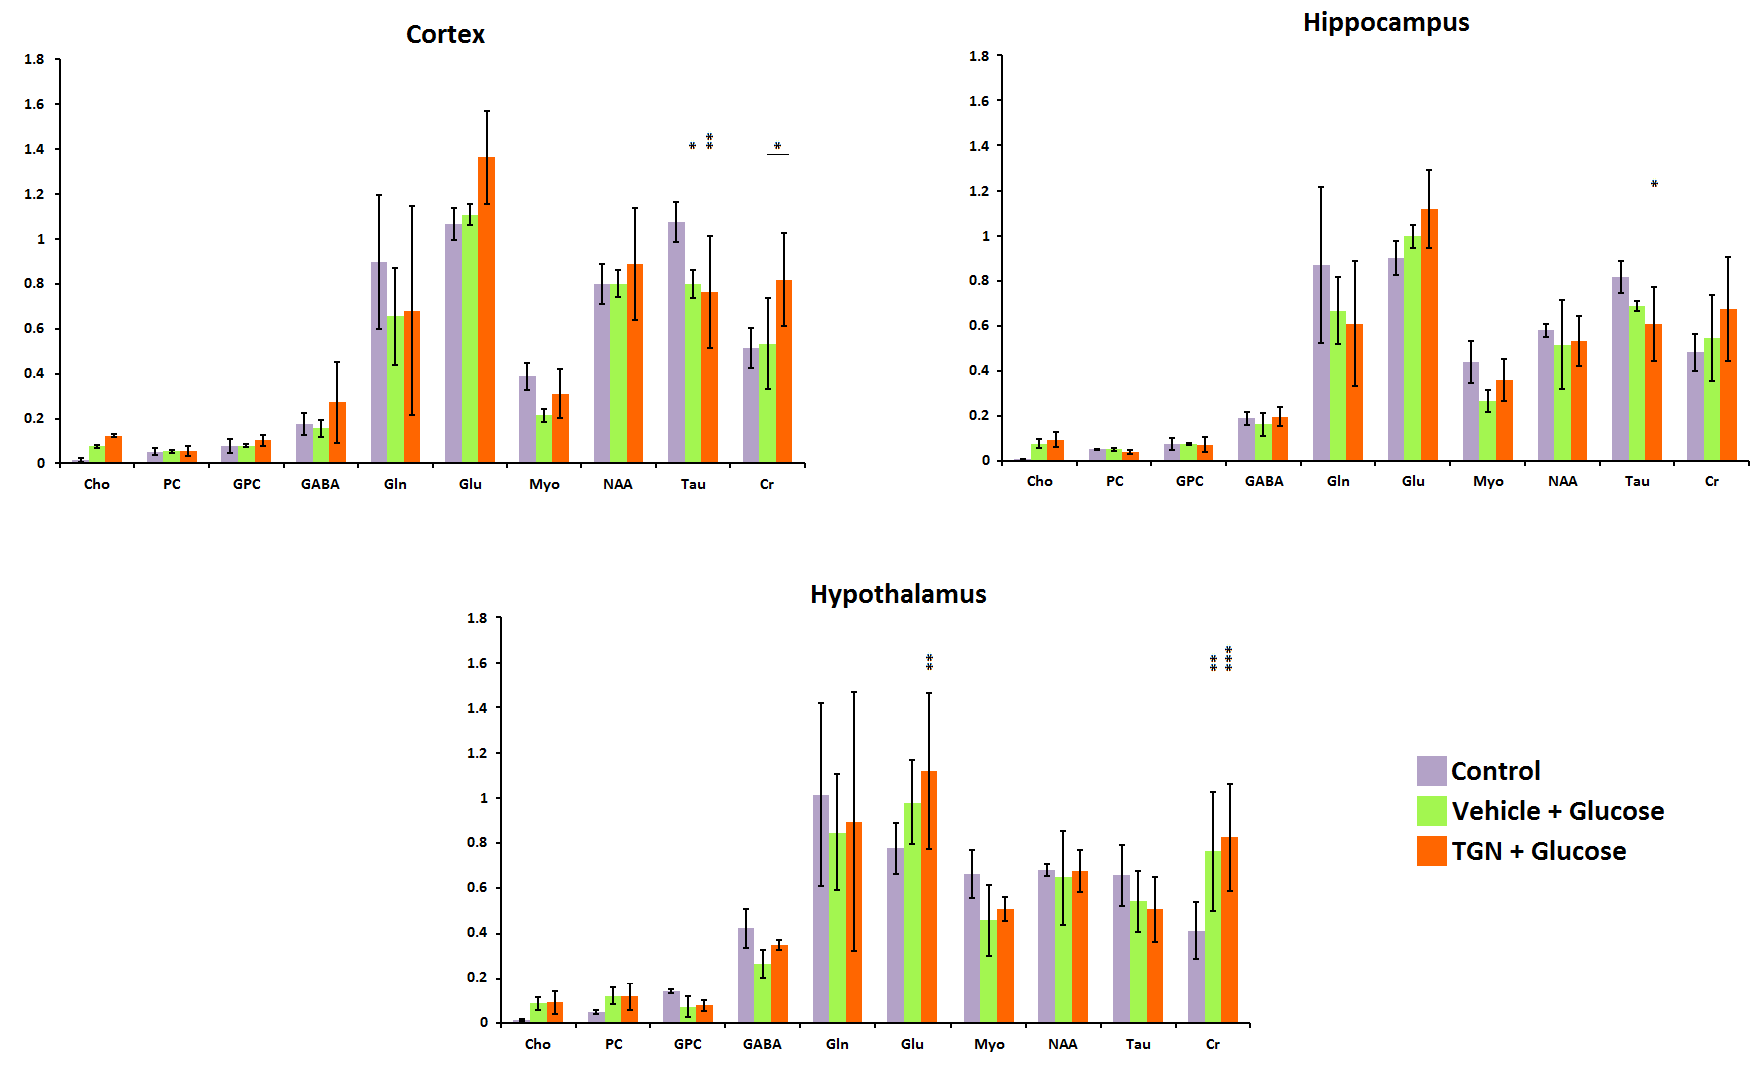
Figure 4. HR-MAS studies at TE = 36 ms.
Representation of the amount of metabolites regarding the total amount of
Creatine in brain of control
(purple), vehicle plus glucose (green) and TGN plus glucose (orange).