4544
Magnetic resonance to characterize the cerebral response to fasting status in a glioblastoma mouse modelIrene Guadilla1, María José Guillén1, Sebastián Cerdán García-Esteller1, and Pilar López-Larrubia1
1Instituto de Investigaciones Biomédicas CSIC-UAM, Madrid, Spain
Synopsis
Involuntary weight loss in patients with cancer is a common secondary effect in tumor pathologies being a cause of weakening and progression of the disease. This phenomenon causes cachexia that is estimated to be the direct cause of at least 20% of cancer deaths. In this line, untreated intracranial glioma-bearing mice develop cachexia, and the use of magnetic resonance imaging characterization of the cerebral response to different appetitive conditions can contribute to the better understanding of the cachectic status. For that, we employed functional diffusion MRI and metabolomic studies in a glioblastoma mouse model.
Introduction
Weight loss is a common effect in patients with cancer due to the changes in regulation of food intake and energy expenditure and eventually leading to cancer cachexia. [1,2,3]. In fact, cachexia is estimated to be the direct cause of at least 20% of cancer deaths, being very important to deep in the understanding of this syndrome. Glioblastoma (GBM) is a high-grade brain tumor with tendency to infiltrate in the whole brain causing death in a sort time [4]. As many cancers, it causes cachectic effects in the last stages of development, that affect several organ functions such as muscle, liver, heart, immune system and brain. Our group has previously worked with GBM murine models [5], identifying MRI parameters able to be used as biomarkers of the pathology [6]. On the other hand, we signaled the effects of appetite in human and rodent brains by functional diffusion imaging [7]. In the present work, we wanted to contribute to the better knowledge of cachectic effects by using untreated intracranial glioma-bearing mice, which developed cachexia syndrome, and diffusion MRI to evaluate this cancer mouse model.Methods
Animal model. Adult C57-BL6/J male mice were divided in two groups: with glioma cells (GL261) injected in caudate nucleus (n=17), and without (n=20). Animals were imaged in two experimental conditions: fed and fasted (16h), with water ad libitum in both of them. Studies were carried out 21-28 days after injection of cells when all tumors had a similar volume (around 42mm3, approx.8% brain volume [8]). A control of the body weight of the animals was carried out from the moment of surgery to the end of the experiments. Glucose levels were also measured in feeding conditions and after 16 hours of fasting. Diffusion MRI. Anesthetized animals (2% isoflurane/oxygen) were imaged in a 7T Magnet with a 23 mm volume resonator. Diffusion tensor imaging (DTI) was acquired by applying gradients in 6 directions with the following parameters: Δ/δ=20/4ms, TR/TE=2500/43ms, in-plane resolution 0.172mm/pixel, slice thickness 1.5mm, axial orientation, and b values of 0, 200, 1000 s/mm2. Images were computed pixel-by-pixel to a monoexponential model with homemade software to obtain mean diffusivity (MD) and fractional anisotropy (FA). Results were evaluated in thalamus and hypothalamus for healthy mice, and in tumor- and contralateral hemispheres for tumor bearing animals (Fig.1). Phenotyping studies. Motor, food/water and gases exchange parameters were recorded by placing mice in metabolic cages (50h, including fed/fasted conditions). HRMAS spectra. Mice were euthanized after fasting with a high-power focused microwave and brains were excised and regionalized in different regions: cortex, prefrontal cortex, hippocampus, thalamus and hypothalamus. 1H HRMAS spectra of samples were obtained in a 11.7T Magnet (CPMG sequence, TE=36 and 144ms) processed with LCModel and analyzed R.Results
MD values decreased in fasted conditions in the regions assessed, also in control and GBM mice. This is in concordance with previous results [7] and due to the swelling of astrocytes. This effect is lower and even not-significant, in the hypothalamus of glioma-bearing mice (Fig.2). On the other side, FA increased in fasted animals because of the movement restrictions caused by the cells swelling. This increase is again lower and less significant in mice with tumors (Fig.2). HRMAS spectra also signaled metabolomic changes in some metabolite levels of animals with GBM related with GABAergic neurotransmission and osmolite control processes (Fig.3). Phenotyping studies showed a decrease in food and water intake as well as a lower mobility and respiration exchange rate values in glioma-bearing mice (Fig.4). Finally, while healthy mice grew at a normal rate, in mice with tumor this growing is slowed down (Fig.5).Discussion / Conclusion
We showed that appetite induces changes in MRI diffusion parameters that are associated to the swelling response of astrocyte under fasting conditions. Nevertheless, these changes do not take place, or they occur in much lower extension, in tumor bearing animals indicating a defective regulation of the cerebral response to appetite. Also a decrease in important metabolites involved in the regulation of the appetite, like GABAergic neurotransmitters and osmolites, are detected in animals with cancer compared to the control group, both of them in fasted status. Results from phenotyping studies are in concordance with a higher alteration of motor and behavioral conditions in diseased mice. All these results suggest a down-regulation of the fed/fasted response in this pathology.Acknowledgements
No acknowledgement found.References
[1] M.E. Martignoni, P. Kunze, H. Fries. Cancer cachexia. Molecular Cancer. 2003. 2:36 [2] Akio Inui. Cancer Anorexia-Cachexia Syndrome: Are Neuropeptides the Key? Perspectives in Cancer Research. September 1999. 59:4493-4501. [3] P. Eubanks May, A. Barber, J.T. D’Olimpio, A. Hourihane, N.N. Abumrad. Reversal of cancer-related wasting using oral supplementation with a combination of β-hydroxy-β-methylbutyrate, arginine, and glutamine. The American Journal of Surgery. 183 (2002) 471–479. [4] N. Sanai, M.S. Berger. Glioma Extent of Resection and its Impact on Patient Outcome. Neurosurgery 2008, 62:753-66. [5] A.R. Borges, P.López-Larrubia, J.B.Marques, S.G.Cerdan. MR Imaging of High-Grade Gliomas in Murine Models: How They Compare with Human Disease, Reflects Tumor Biology, and Play a Role in Preclinical Trials. American Journal of Neuroradiology. 2012, 33(1):24-36. [6] R. Pérez-Carro, O. Cauli, P. López-Larrubia. Multiparametric Magnetic Resonance in the assessment of the gender differences in a high-grade glioma rat model. EJNMMI Research. 2014, 4(1):44 [7] B. Lizarbe, A. Benítez, M. Sánchez-Montañés, L.F. Lago-Fernández, M.L. Garcia-Martín, P. López-Larrubia, S. Cerdán. Imaging hypothalamic activity using diffusion weighted magnetic resonance imaging in the mouse and human brain. Neuroimage. 2013, 64:448-57 [8] A. Badea, A.A. Ali-Sharief, G.A. Johnson. Morphometric analysis of the C57BL/6J mouse brain. Neuroimage. 2007 September; 37(3): 683–693.Figures
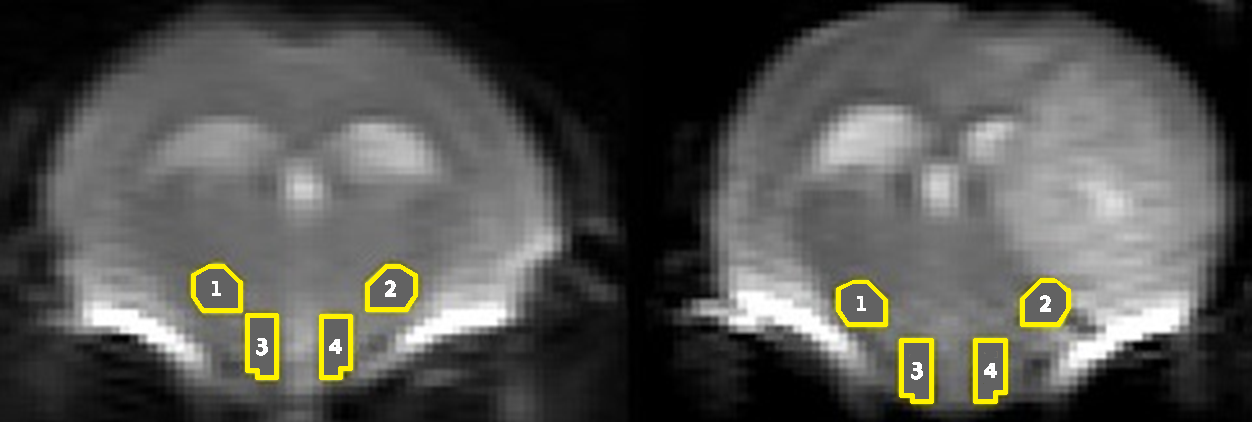
Figure
1. Diffusion
images of healthy (left) and tumor bearing (right) mice showing the regions of
interest (ROI’s) selected to be analyzed in thalamus (1,2) and hypothalamus
(3,4).
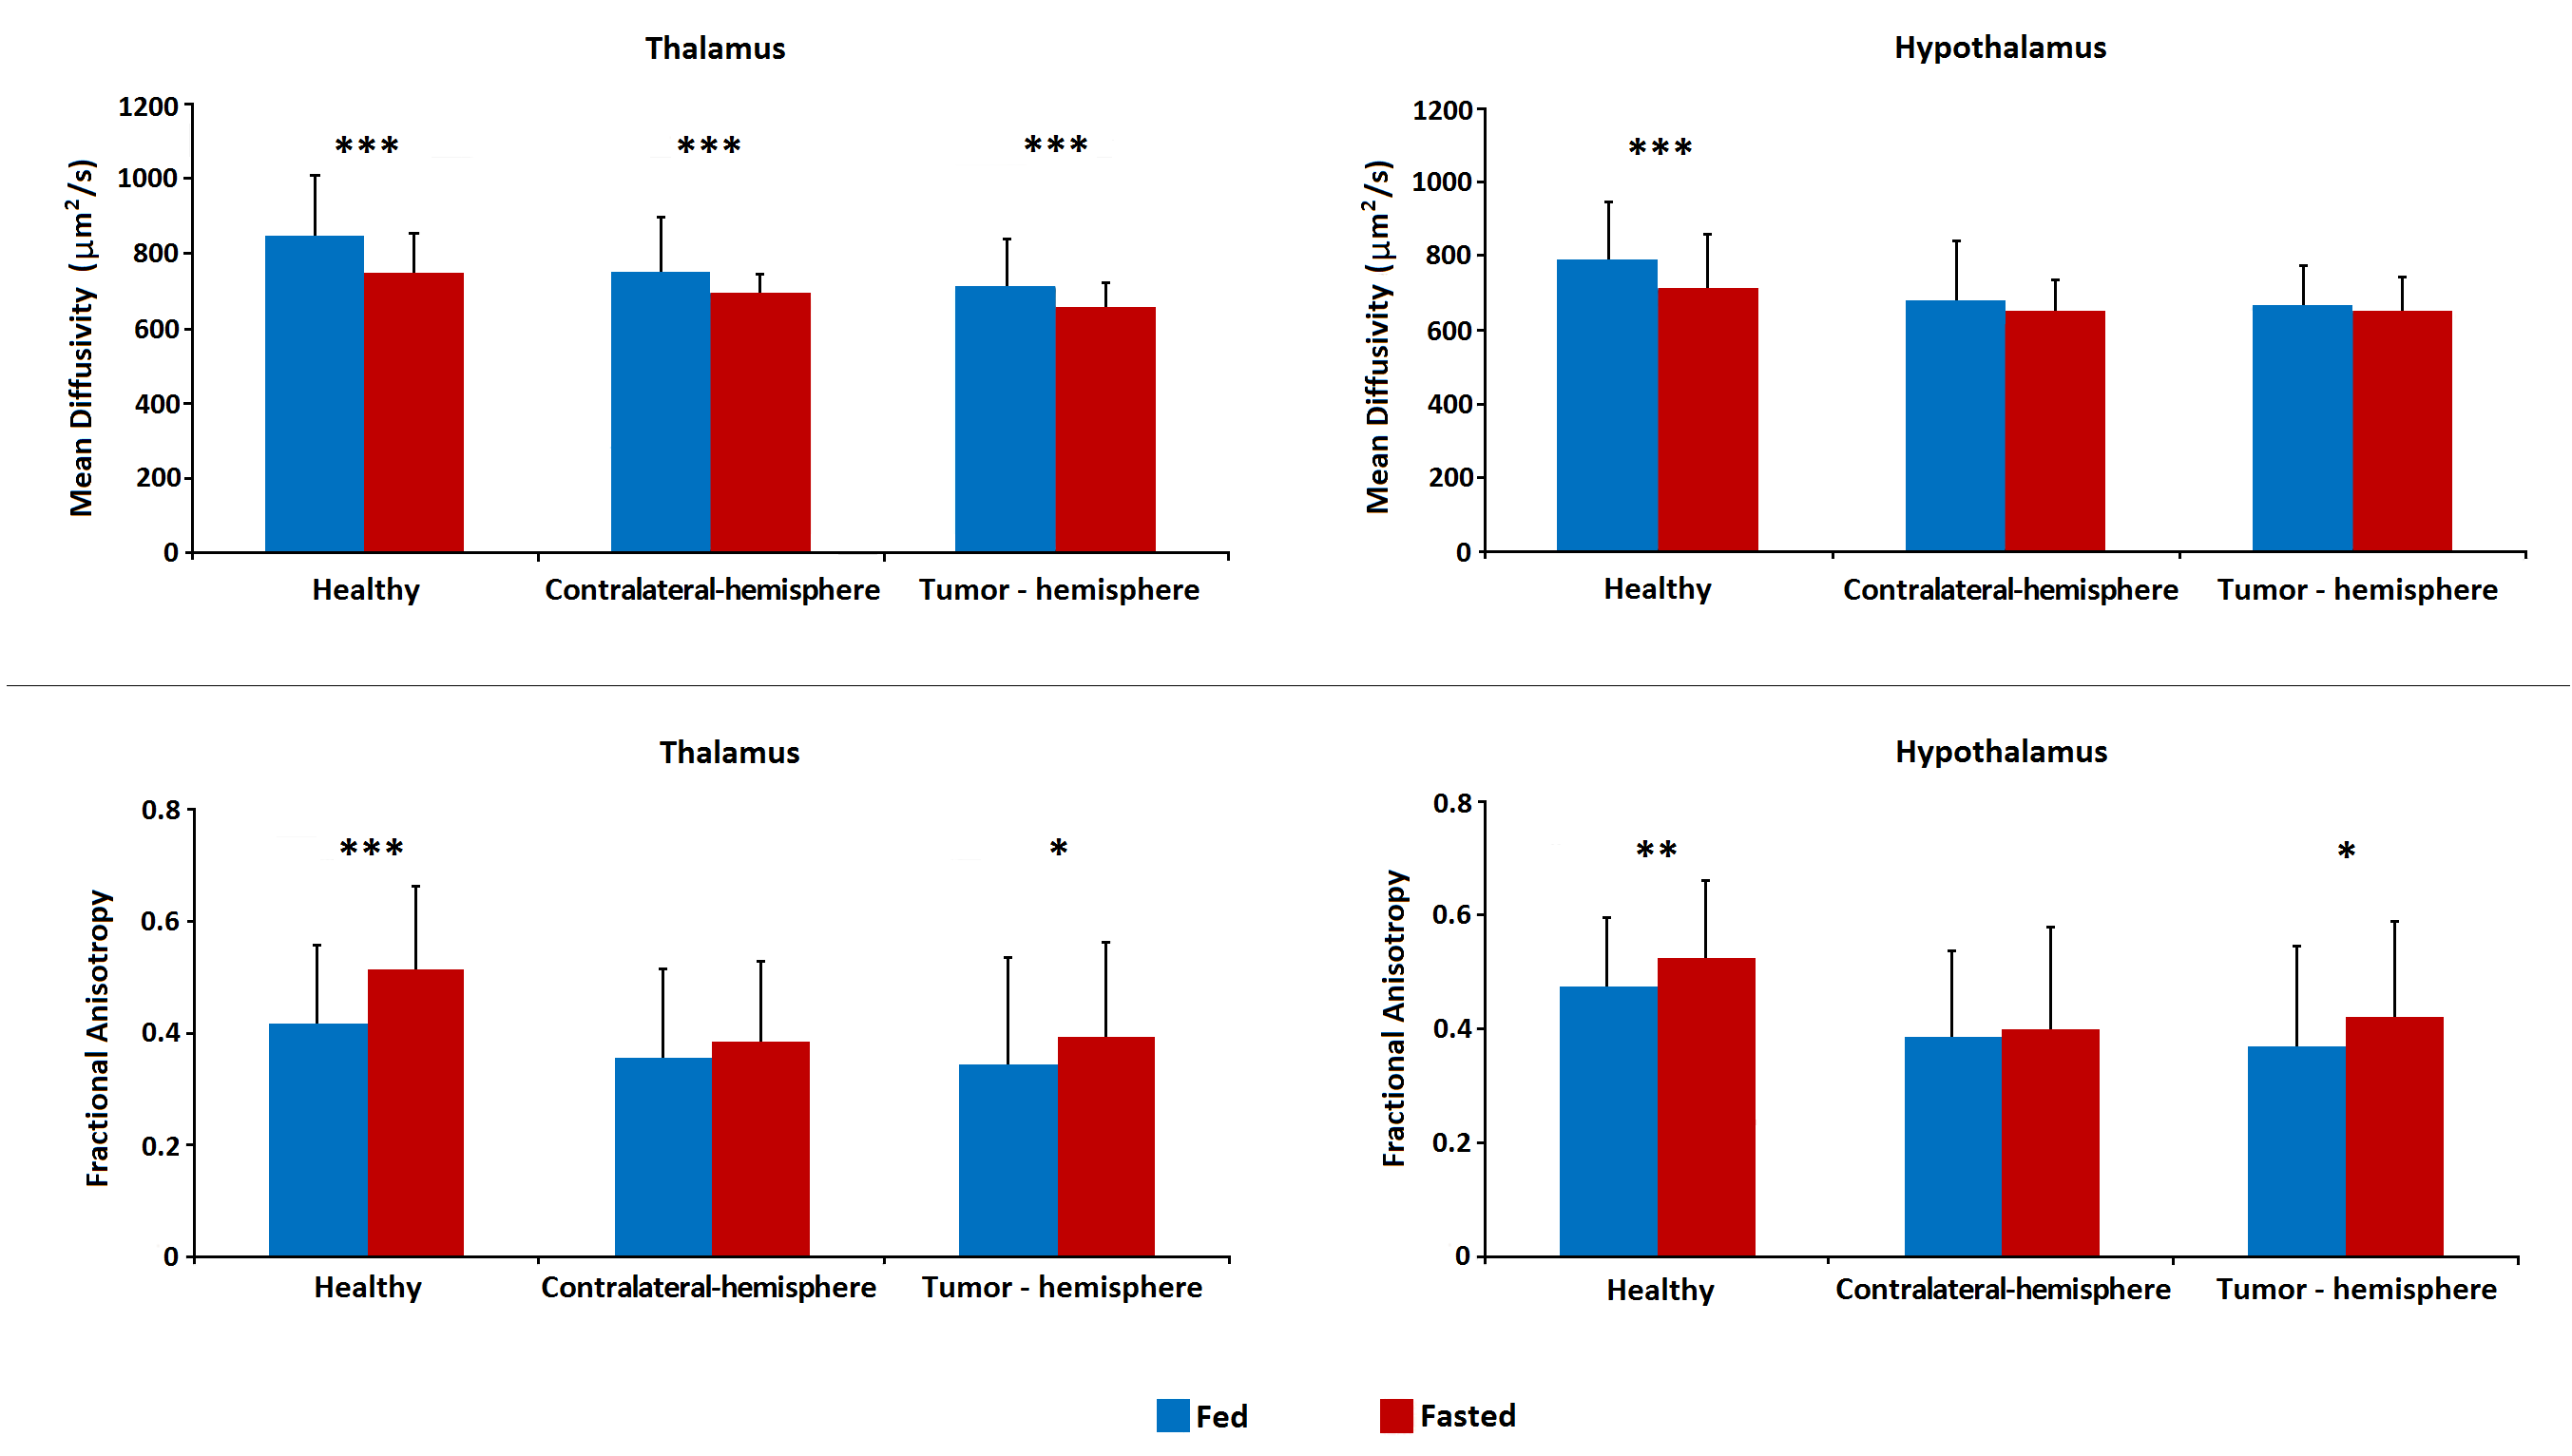
Figure 2. MD and FA values obtained from DTI studies in fed and
fasted conditions and measured in thalamus (left) and hypothalamus (right).
“Healthy” columns compare data from healthy animals used as control.
“Contralateral-hemisphere” shows the results from the brain regions placed in
the left hemisphere (where the gliomas were not injected). “Tumor-hemisphere”
show data from ROIs selected in the right hemisphere where the tumor is
growing.
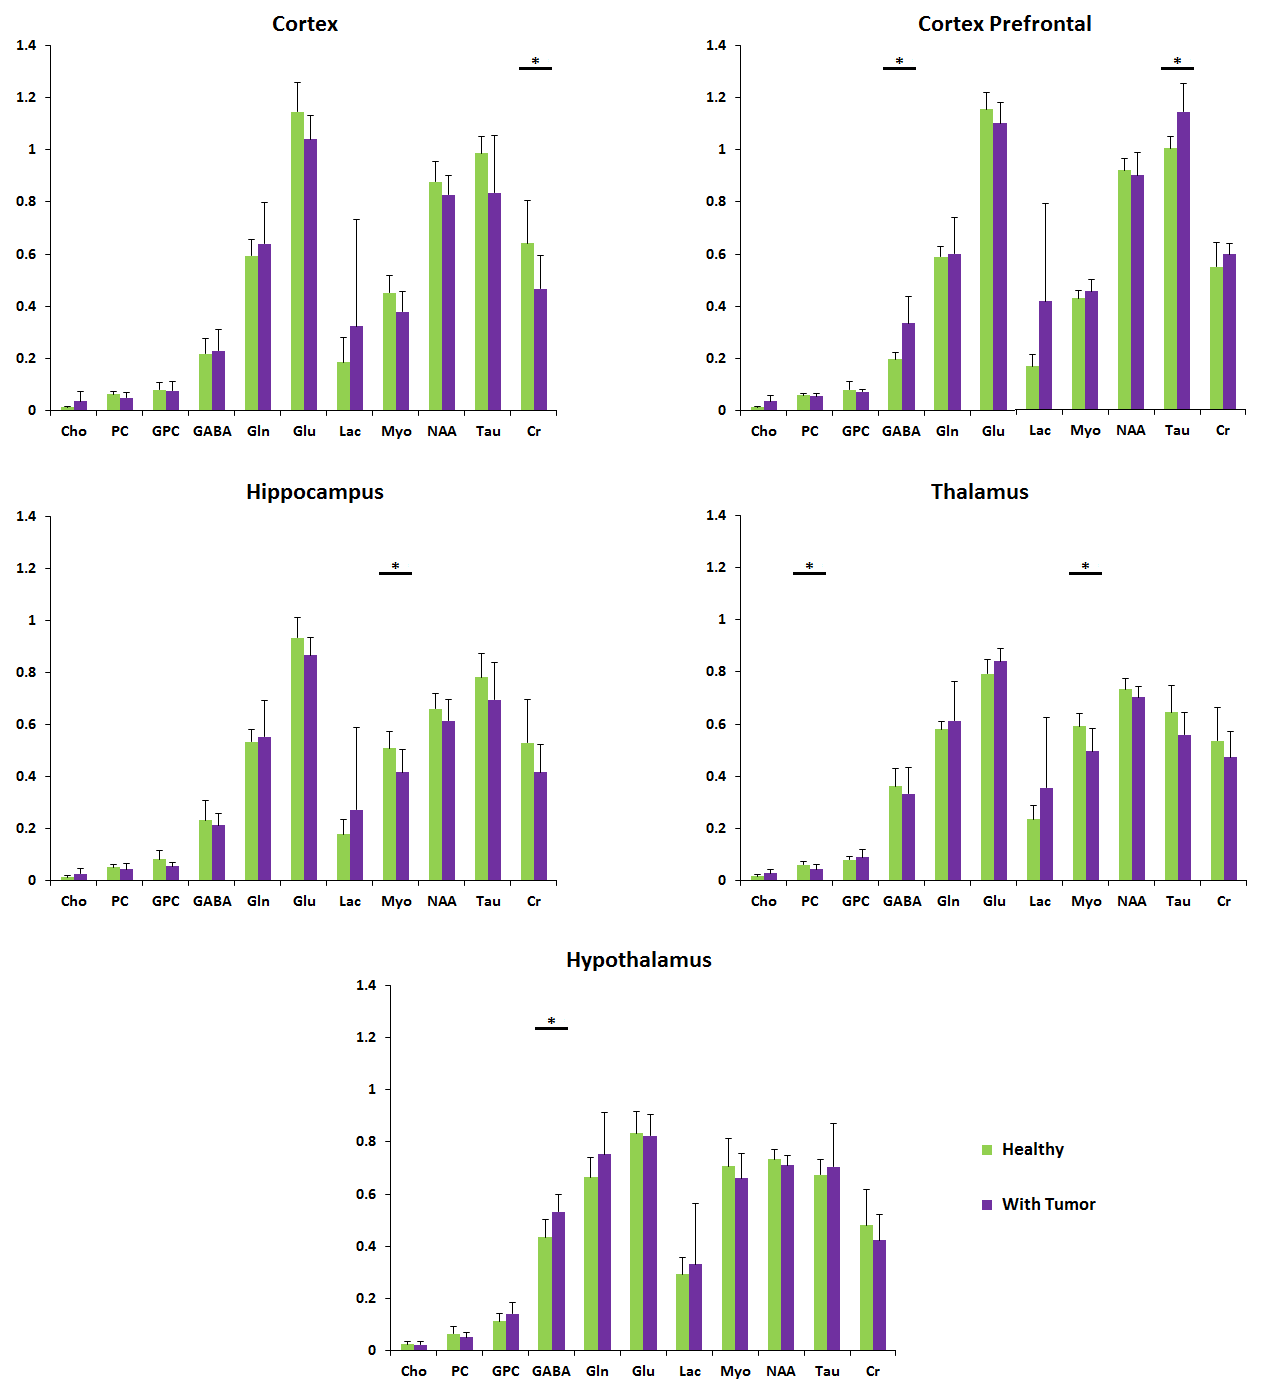
Figure 3. HR-MAS studies at TE = 36 ms. Representation of the
amount of metabolites regarding the total amount of Creatine in brain of fasted
mice in different conditions: Healthy 14 weeks old (green) and tumor bearing 14
weeks old (purple).
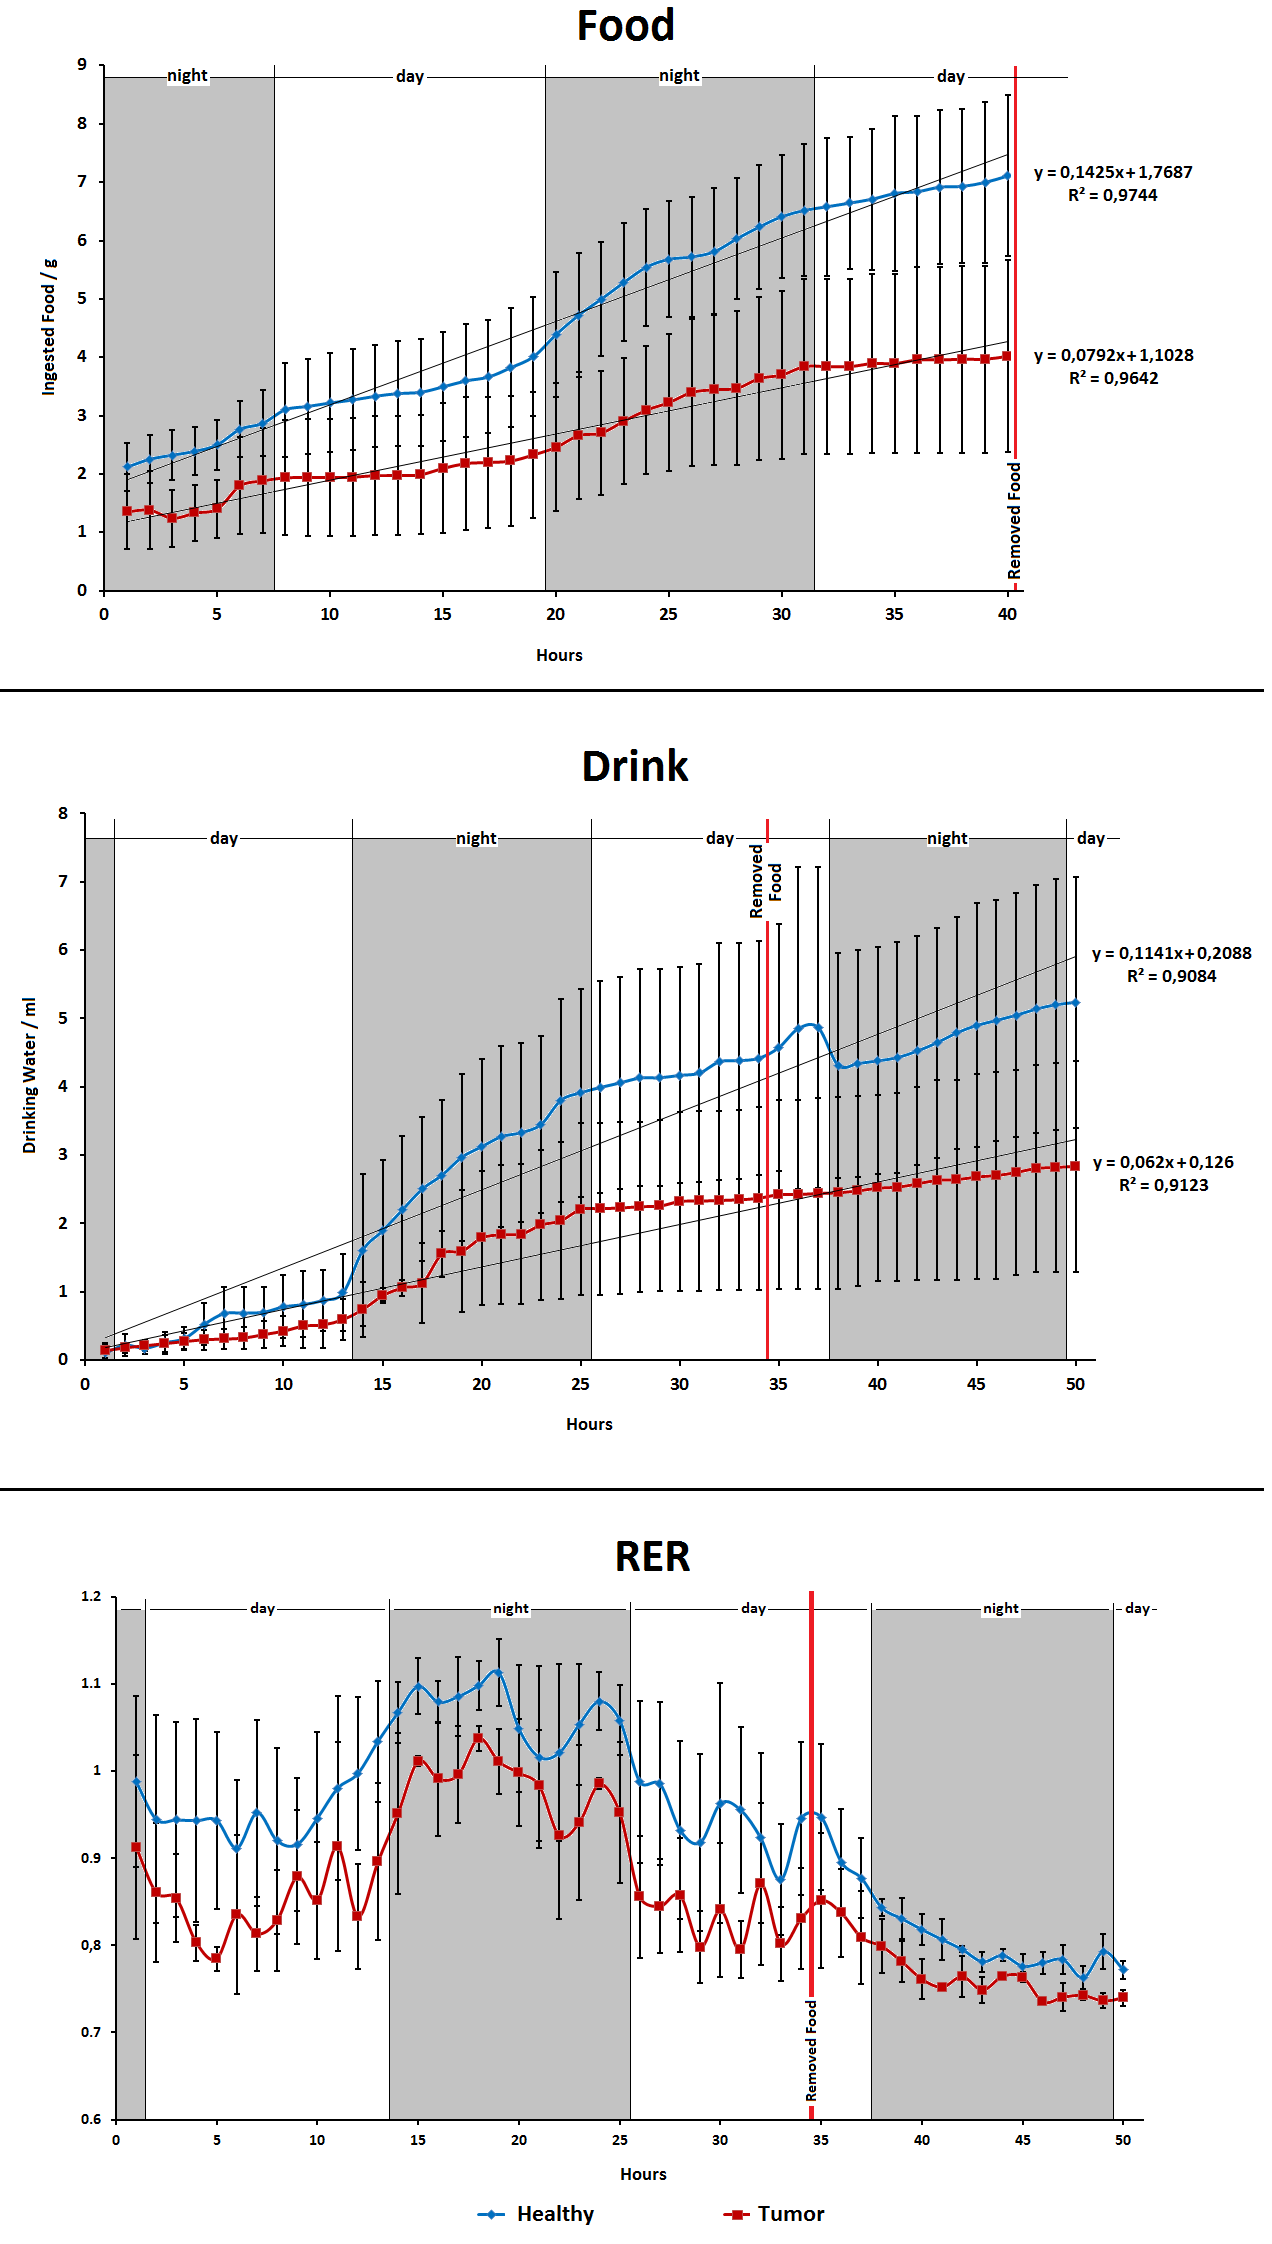
Figure 4. Phenotyping studies of
healthy (blue) and tumor bearing (red) mice. Last 50 hours of Drink and RER
recorded measurements include fed and fasted conditions. Food measurements do
not include the fasted period. Drink and Food are accumulative measures.
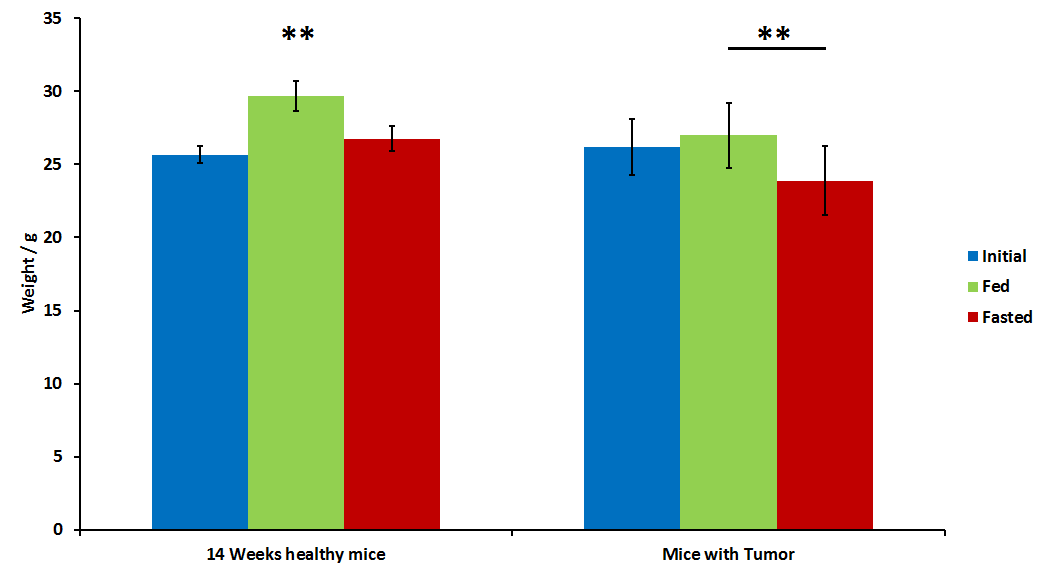
Figure 5. Weight measures of 14 weeks
old healthy mice (left) and tumor bearing mice (right). Initial weights (blue)
were recorded 4-6 weeks before fasted period. Fed weights (green) were measured
before removing food. Fasted weights (red) were measured after 16 hours in
fasted conditions.