4543
Effects of a high-fat diet in the mouse cerebral response to appetite detected by functional diffusion MRI and HRMAS studiesIrene Guadilla1, María José Guillén1, Sebastián Cerdán García-Esteller1, and Pilar López-Larrubia1
1Instituto de Investigaciones Biomédicas CSIC-UAM, Madrid, Spain
Synopsis
Obesity and overweight are common problems in developed world population, affecting to a greater number of children. In young people, it is becoming more usual to diagnose diabetes or heart problems due to fat accumulation. In this work, we wanted to assess the effects of a fat diet in the cerebral response to an appetite stimulus in mice. We evaluated changes in diffusion magnetic resonance imaging parameters and metabolomic profiles. Our results suggest that high fat diet consumption causes alterations in the brain response to appetite that can be signaled by magnetic resonance approaches.
Introduction
Obesity and overweight are an abnormal accumulation of fat in the body that affect to one-third of the world’s population. These situations may be accompanied by multiple health problems, like diabetes or heart disease, causing a large number of deaths per year. Although body weight and metabolic response should be regulated primarily by genes, the great increase of this pathology in the developed world indicates that fat food intake and lack of exercise can be the main causes of this excess of the fat accumulated[1,2]. Previously, we have shown that functional diffusion magnetic resonance imaging (fDMRI) can be used to detect hypothalamic activation due to the application of a feeding/fasting paradigm also in the mouse and human brain[3,4,5]. On these grounds, our goal in this work was to assess the cerebral response to the appetite regulation of mice submitted to a high fat consumption.Methods
Animal model. C57 BL6/J male mice were used in two groups: 14 weeks (w) old with standard diet(n=20) and 14w old after 6w with fat diet(60% fat) (n=20). Animals were studied in two experimental conditions: fed ad libitum and fasted (16h), with water ad libitum in both cases. The body weight was controlled from 8w old (three times per week) to the end of the experiments. Glucose levels were also measured in feeding conditions and after 16h of fasting. Diffusion MRI. Anesthetized mice (1-1.5% isoflurane/oxygen) were studied in a 7T system (90 mm gradient insert 360 mT/m, 23 mm volume resonator). Diffusion images were acquired in 6 directions using a diffusion tensor imaging (DTI) sequence and the following acquisition parameters: Δ /δ=20/4 ms, TR=2500 ms, TE=43 ms, in-plane resolution 0.172 mm/pixel, slice thickness 1.5 mm, axial orientation, and 2b values (200 and 1000 s/mm²). fDMRI studies were also carried out in 3 orthogonal directions with the following parameters: Δ /δ=20/4 ms, TR=2500 ms, TE=31 ms, in-plane resolution 0.172 mm/pixel, slice thickness 1.5mm, axial orientation, 6b values (0, 300, 600, 900, 1200, 1500 and 1800 s/mm2). Data analysis: DTI studies were computed with homemade software by fitting the signal, in a pixel-by-pixel base, to a monoexponential model to obtain mean diffusivity (MD) and fractional anisotropy (FA). The signal in functional DWI was fitted to a biexponential model to obtain fast and slow diffusion coefficients (FDC and SDC) and fast diffusion phase (FDP). HRMAS studies. Mice were euthanized with a high-power focused microwave and the excised brains regionalized in several regions of interest: cortex, prefrontal cortex, hippocampus, thalamus and hypothalamus. 1H HRMAS spectra were acquired in a 11.7T system using a CPMG sequence (TE=36 and 144ms). Spectra were processed with LCModel and results analyzed with R. Phenotyping studies. Mice were placed in metabolic cages during 50h, including fed/fasted conditions, where motor, food/water intakes and gases consumption parameters were recorded and analyzed.Results
MD values are lower in cortex, hippocampus and hypothalamus for fasted animals in concordance with previous studies[4], being higher this effect in the animals submitted to high fat feeding(Fig.1). FA increased in fasted conditions due to the swelling of the cells in both diets although the values are higher in high fat diet. FDC values are higher in cortex, hippocampus and hypothalamus for fed animals in both diets and SDC present the opposite behavior in the high fat diet group. FDP also tends to decrease in fasted conditions(Fig.2). Results from HRMAS spectra indicate a decrease in some neurotransmitter levels (GABA, Gln, Glu) and also in the osmolite Tau in the fat diet group(Fig.3). Phenotyping evaluation show a lower consumption of food and water in mice with fat diet and a lower RER values in this group(Fig.4). Mice feed with a higher fat content experience a higher body weight increase, and glucose levels were also significantly more elevated in the fat diet group(Fig.5).Discussion/Conclusion
Our results indicate that diffusion MRI allows to identify differences in brain response to appetite conditions depending on the fat content of the diet. The detected decrease in FDP values in fasting conditions indicate a swelling of astrocytes because of the appetite condition that is more prominent under high fat content feeding. Spectroscopic data also suggest a defective GABAergic neurotransmission and osmotic control processes in animals with the hypocaloric diet. Phenotyping results indicate a lower amount of food and water intake in the same animals and also lower RER values, close to 0.7, indicating that fat is the predominant fuel source in these mice; instead of a value of 1.00 indicative of carbohydrate being the predominant one in control mice with standard diet.Acknowledgements
No acknowledgement found.References
[1] Niloofar Hariri, Louise Thibault. High-fat diet-induced obesity in animal models. Nutrition Research Reviews (2010), 23, 270-299. [2] Obesity: preventing and managing the global epidemic. Report of a WHO consultation. World Health Organ Tech Rep Ser. 2000;894:i-xii, 1-253 [3] D. Le Bihan. Diffusion, confusion and functional MRI. Neuroimage 2012, 62(2):113-6. [4] Lizarbe et al. Hypothalamic metabolic compartmentation during appetite regulation as revealed by magnetic resonance imaging and spectroscopy methods. Front. Neuroenergetics 2013, 5:6. [5] B. Lizarbe et al. Imaging hypothalamic activity using diffusion weighted magnetic resonance imaging in the mouse and human brain. Neuroimage. 2013, 64:448-57Figures
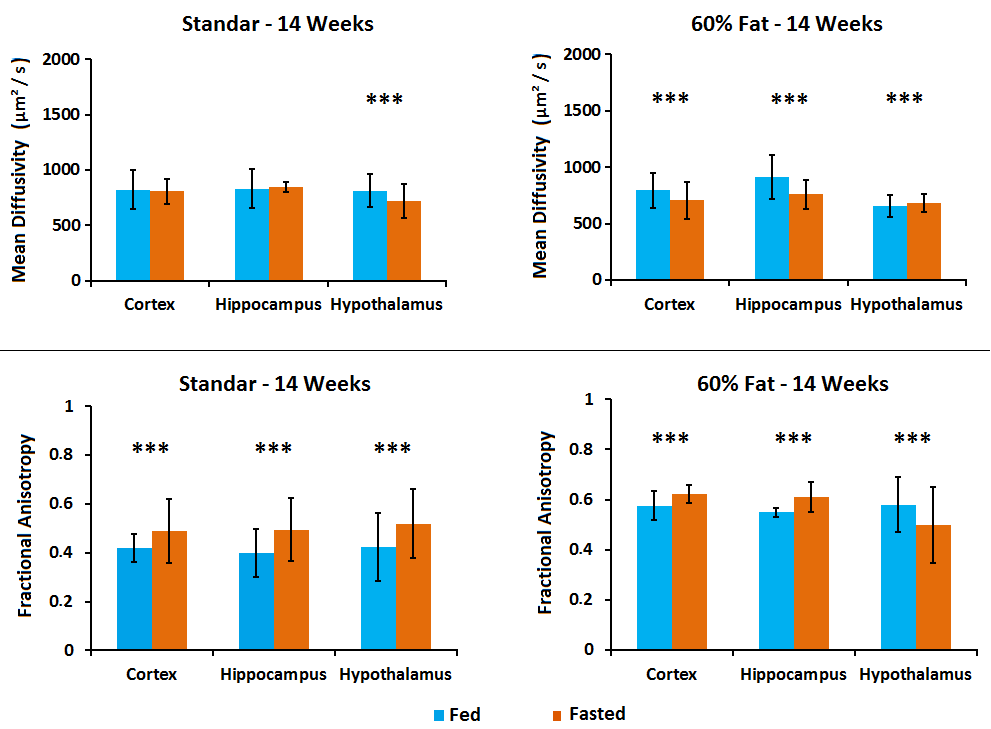
Figure 1. Mean Diffusivity and Fractional Anisotropy results in cortex,
hippocampus and hypothalamus of mice in fed (blue) and fasted (orange)
conditions. Studies were performed in mice with different diets: 14 weeks old
with 6 weeks of standard diet and 14 weeks old with 6 weeks of fat (60%) diet.
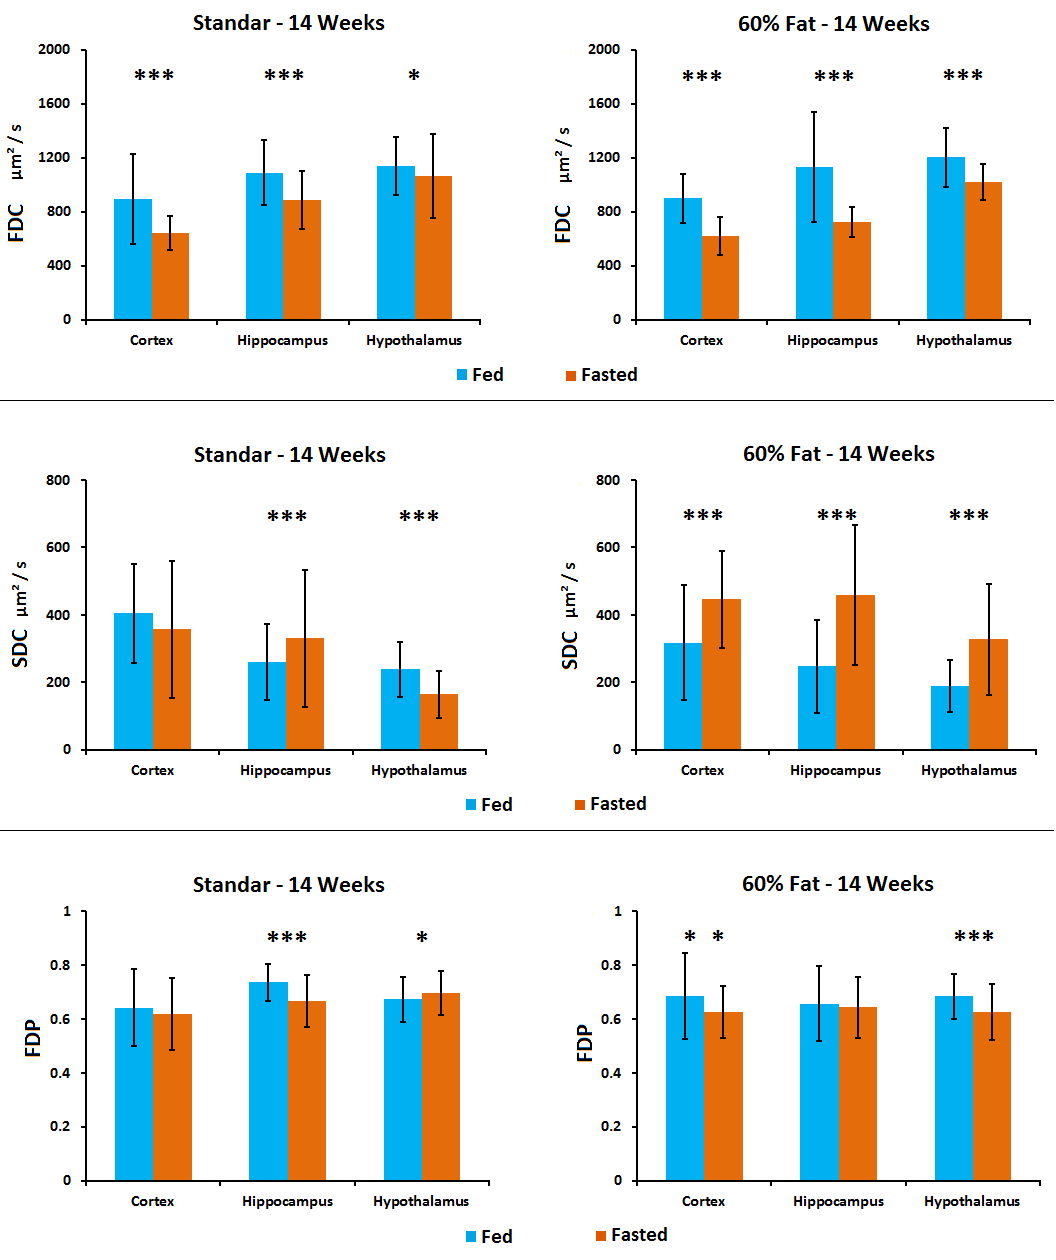
Figure 2. Fast Diffusion Coefficient, Slow Diffusion Coefficient and Fast
Diffusion Phase results in cortex, hippocampus and hypothalamus of mice in fed
(blue) and fasted (orange) conditions. Studies were performed in mice with
different diets: 14 weeks old with 6 weeks of standard diet and 14 weeks old
with 6 weeks of fat (60%) diet.
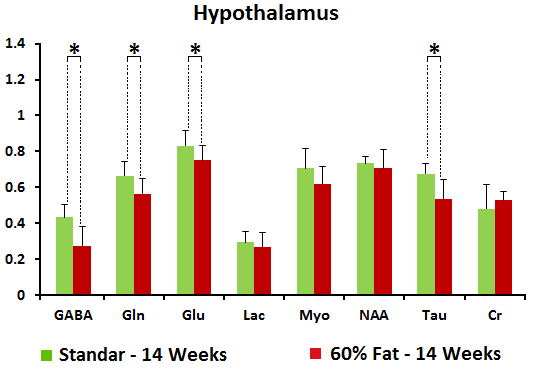
Figure 3. HR-MAS studies at TE = 36 ms. Representation of the amount of
metabolites regarding the total amount of Creatine in hypothalamus of fasted
mice in different diets: 14 weeks old with 6 weeks of standard diet (green) and
14 weeks old with 6 weeks of fat (60%) diet (red).
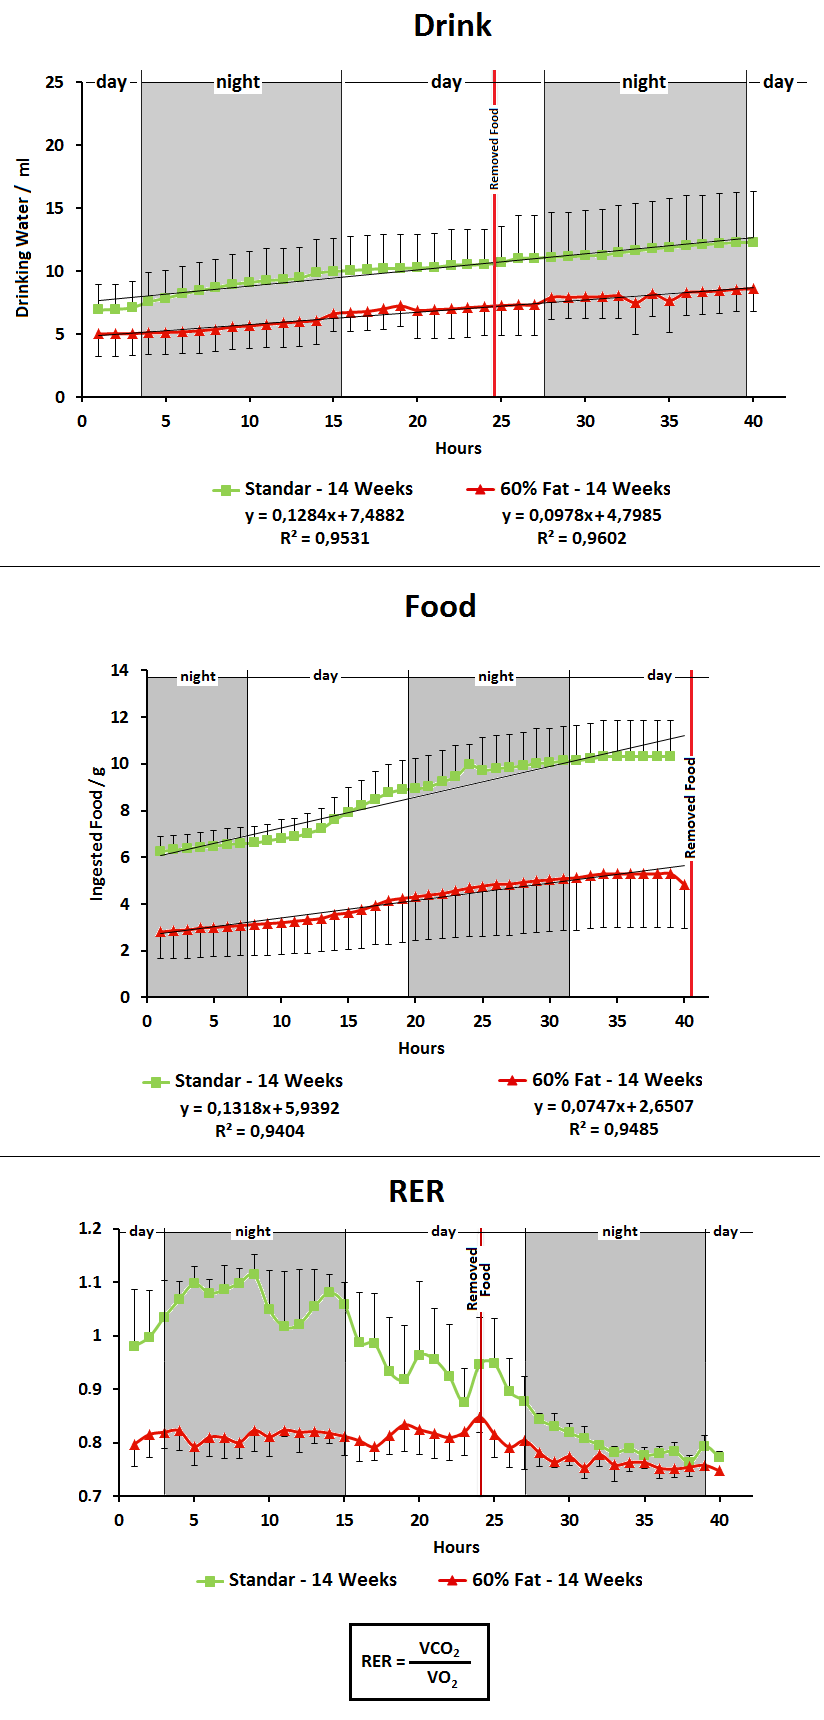
Figure 4. Phenotyping studies of 14
weeks old with 6 weeks of standard diet (green) and 14 weeks old with 6 weeks of
fat (60%) diet (red) mice. Last 50 hours of Drink and RER recorded measurements
include fed and fasted conditions. Food measurements do not include the fasted
period. Drink and Food are accumulative measures.
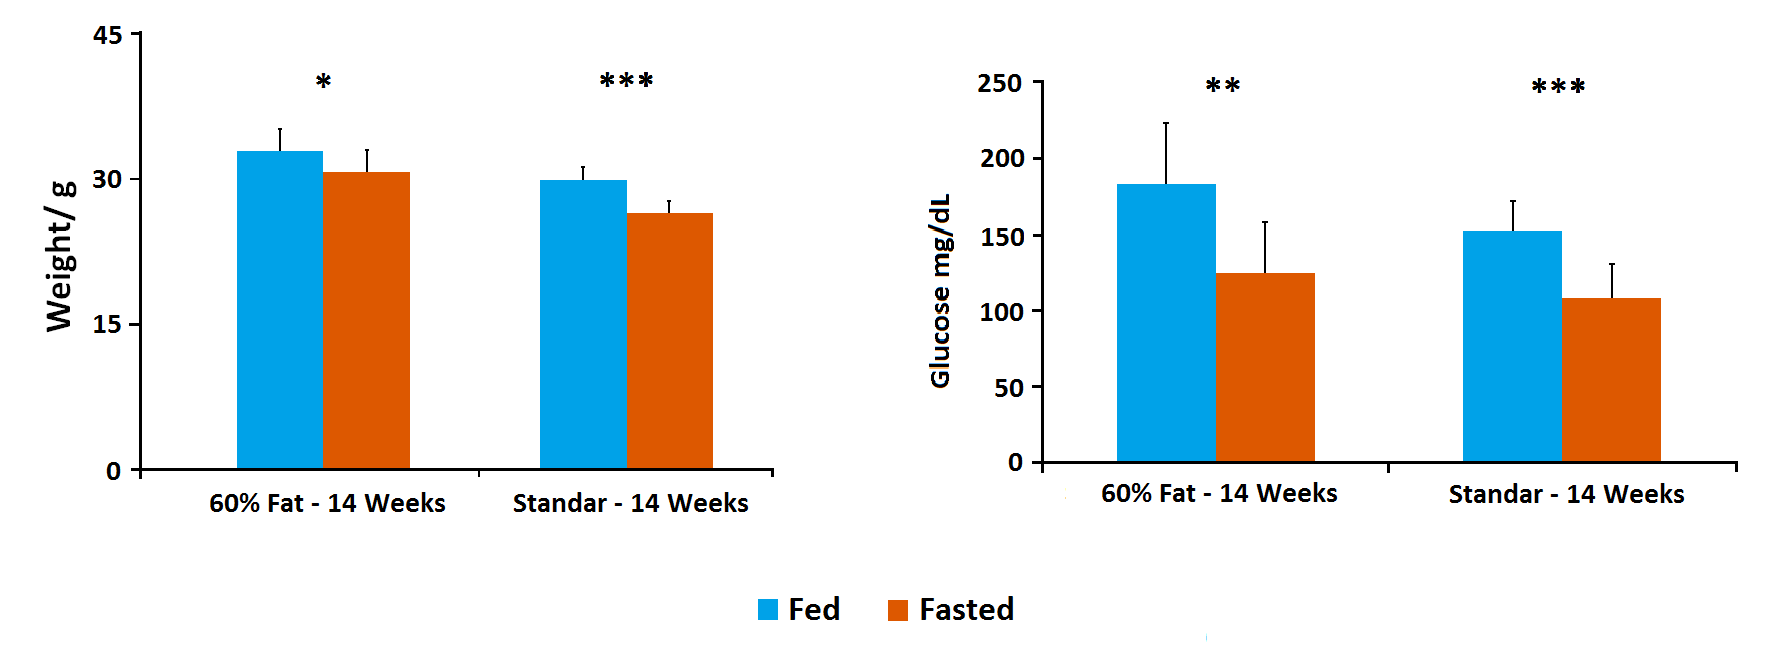
Figure 5. Weight and Glucose measures of 14 weeks old with 6
weeks of standard diet (to the right in each graph) and 14 weeks old with 6 weeks of fat (60%)
diet (to the left in each graph) mice in fed (blue) and fasted (orange)
conditions. Fed weights were measured before removing food. Fasted weights were
measured after 16 hours in fasted conditions.