4539
Probability distribution of functional areas in human brainWeiwei Men1,2, Sizhong Zhou1, Yaoyu Zhang1, Xiaolin Chen3, Tianyi Qian4, Changyu Lu5, and Jia-Hong Gao1,2,6
1Center for MRI Research, Academy for Advanced Interdisciplinary Studies, Peking University, Beijing, China, 2Beijing City Key Lab for Medical Physics and Engineering, Institute of Heavy Ion Physics, School of Physics, Peking University, Beijing, China, 3Department of neurosugery, Capital Medical University Affiliated Beijing Tiantan Hosipital, Beijing, China, 4MR Collaboration NEA, Siemens Healthcare, Beijing, China, 5Neurosurgery Department, Peking University International Hospital, Beijing, China, 6McGovern Institute for Brain Research, Peking University, Beijing, China
Synopsis
fMRI can be used to detect the functional areas of human brain in vivo, which is helpful for neurosurgeons to make accurate pre-surgical plans. Due to the individual differences of the brain, the topography of different functional areas will vary across subjects. The purpose of this study was to construct group functional probability maps of different functional areas based on a large database of normal subjects. It has the potential to help neurosurgeons to make accurate pre-surgical plans and to improve the functional outcome of patients after surgery.
Introduction
Accurate localization of functional areas in the human brain can help neurosurgeons to make accurate pre-surgical plans1, which can protect the functional areas of the brain and improve the success rate of neurosurgery. Different areas of the human brain are responsible for different function; fMRI as a non-invasive imaging technique can be used to detect functional areas of the human brain in vivo2. Due to individual differences, the activation maps of different individuals are different in degree, location, and scope of activation. The purpose of this study was to collect a large sample size of functional areas mapping, construct a group of probability distribution maps of various functions, and guide neurosurgeons to judge the range and location of patients' functional areas in clinical practice.Materials and Methods
99 healthy males, right-handed college students (mean age 23.4 ±2.1 years, age range 18-28 years) were recruited in this study, which was approved by our institutional review board. A block experiment design was employed, including 6 different tasks (auditory task, hands-fist movement, rapid blink, tongue movement, alternate movement of feet, and visual task). Participants were asked to execute each task for 24s and rest for 24s; based on the instruction presented on the fMRI stimulator, each task included two blocks. The MRI data was collected using a MAGNETOM Prisma 3T MR scanner (Siemens Healthcare, Erlangen, Germany) and a 64-channel head-neck coil. The MPRAGE sequence was employed for structure image acquisition with the following parameters: 192 sagittal slices, voxel size = 1mm × 1mm × 1mm. For BOLD images, the Simultaneous Multi-slice EPI (SMS-EPI) sequence was used with the following parameters: TR = 2000ms, TE = 30ms, FA = 90°, FOV = 224mm × 224mm, 64 slices, voxel size = 2mm × 2mm × 2mm, multiband factor = 2. A field map sequence with the same resolution to that of BOLD images was acquired as well. SPM12 was used for MRI data processing. After the first 6 volumes of each run were discarded, the functional data were corrected for slice timing, then a voxel displacement map (VDM) was generated, which was used to unwarp geometrically distorted EPI images. After this step, 4 participants were excluded for head movement greater than 1.2 degrees. The unwarped EPI images were normalized to MNI-space using a unified segmentation method3, the FWHM was [5 5 5] for smoothing of normalized EPI images. A general linear model (GLM) was applied for each voxel of the smoothed images. A one-sample t-test was employed for statistical analysis. First, the activation result (p<0.001(uncorrected),cluster size>30) of each task was saved as a mask after the first individual analysis and the result of group analysis (p<0.05(FWE),cluster size>30) of each task was saved as a global mask. Then all masks of the same task were averaged, and the special range was masked with the global mask for the same task, where the average result is used as a probability distribution map.Results
The activation of the 6 tasks and the SMA area of 95 subjects are shown in Fig. 1. Only hands, fist and tongue movements are activated for all participants. Seven different activation areas of human brain are shown in Fig.2, the blink functional areas have a slight superposition with the hand and tongue functional areas, the rest functional regions are spatially independent of each other. The probability distribution of the seven different functional areas are shown in Fig.3, the scope with a probability of 90% accounts for about 60% of the total active area, and the scope with a probability of 70% is about 80% of the total active region.Discussions
Because everyone's brain is unique, there are some differences in the spatial location of each functional area, which makes it difficult to locate the functional area accurately. fMRI can be used to detect functional regions in vivo. For the same task, the range and intensity of activation vary from person to person. All kinds of factors, such as the degree of cooperation, head movement and intensity of exercise, will affect the range and intensity of activation. The probability distribution map of the large functional datasets can help neurosurgeons to understand the distribution range of the functional area and to determine the location relationship between lesion and functional areas.Conclusions
The probability distribution map based on large functional datasets could help neurosurgeons to determine the range of functional areas, which will help make accurate pre-surgical plans and improve the functional recovery of patients after surgery.Acknowledgements
This study was supported by Beijing Municipal Science & Technoloyg Commission, No. Z161100000216152.References
1. Hou BL, et al. A brain stress test: Cerebral perfusion during memory encoding in mild cognitive impairment. Neuroimage Clin. 2016 Mar 2;11:378-87. 2. Belliveau JW, et al. Functional cerebral imaging by susceptibility-contrast NMR. Magn Res Med 1990; 14: 538-546. 3. J. Ashburner and K.J. Friston. Unified segmentation. NeuroImage, 26:839–851, 2005.Figures
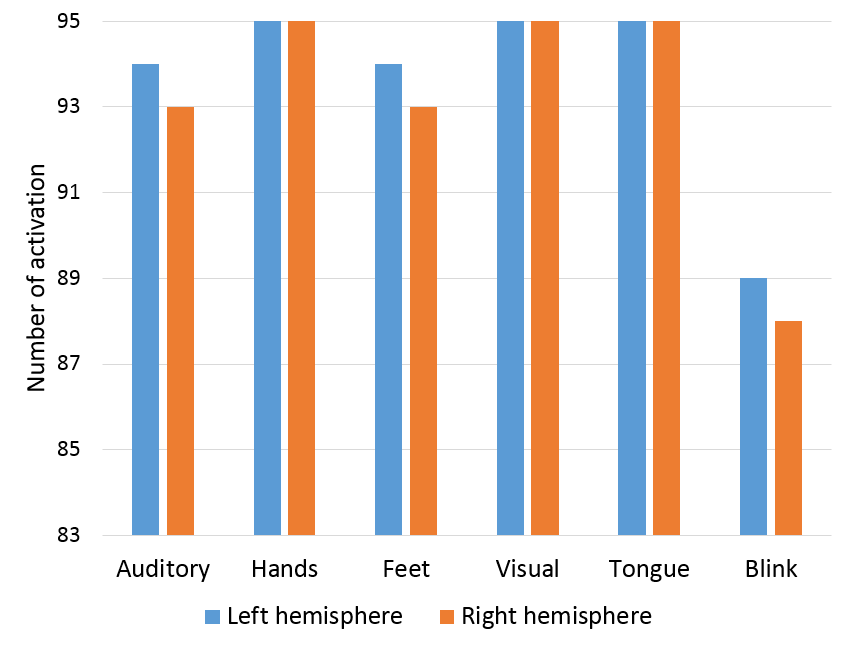
Figure 1. The activation of 6 tasks at
respective brain area and SMA area in the brain
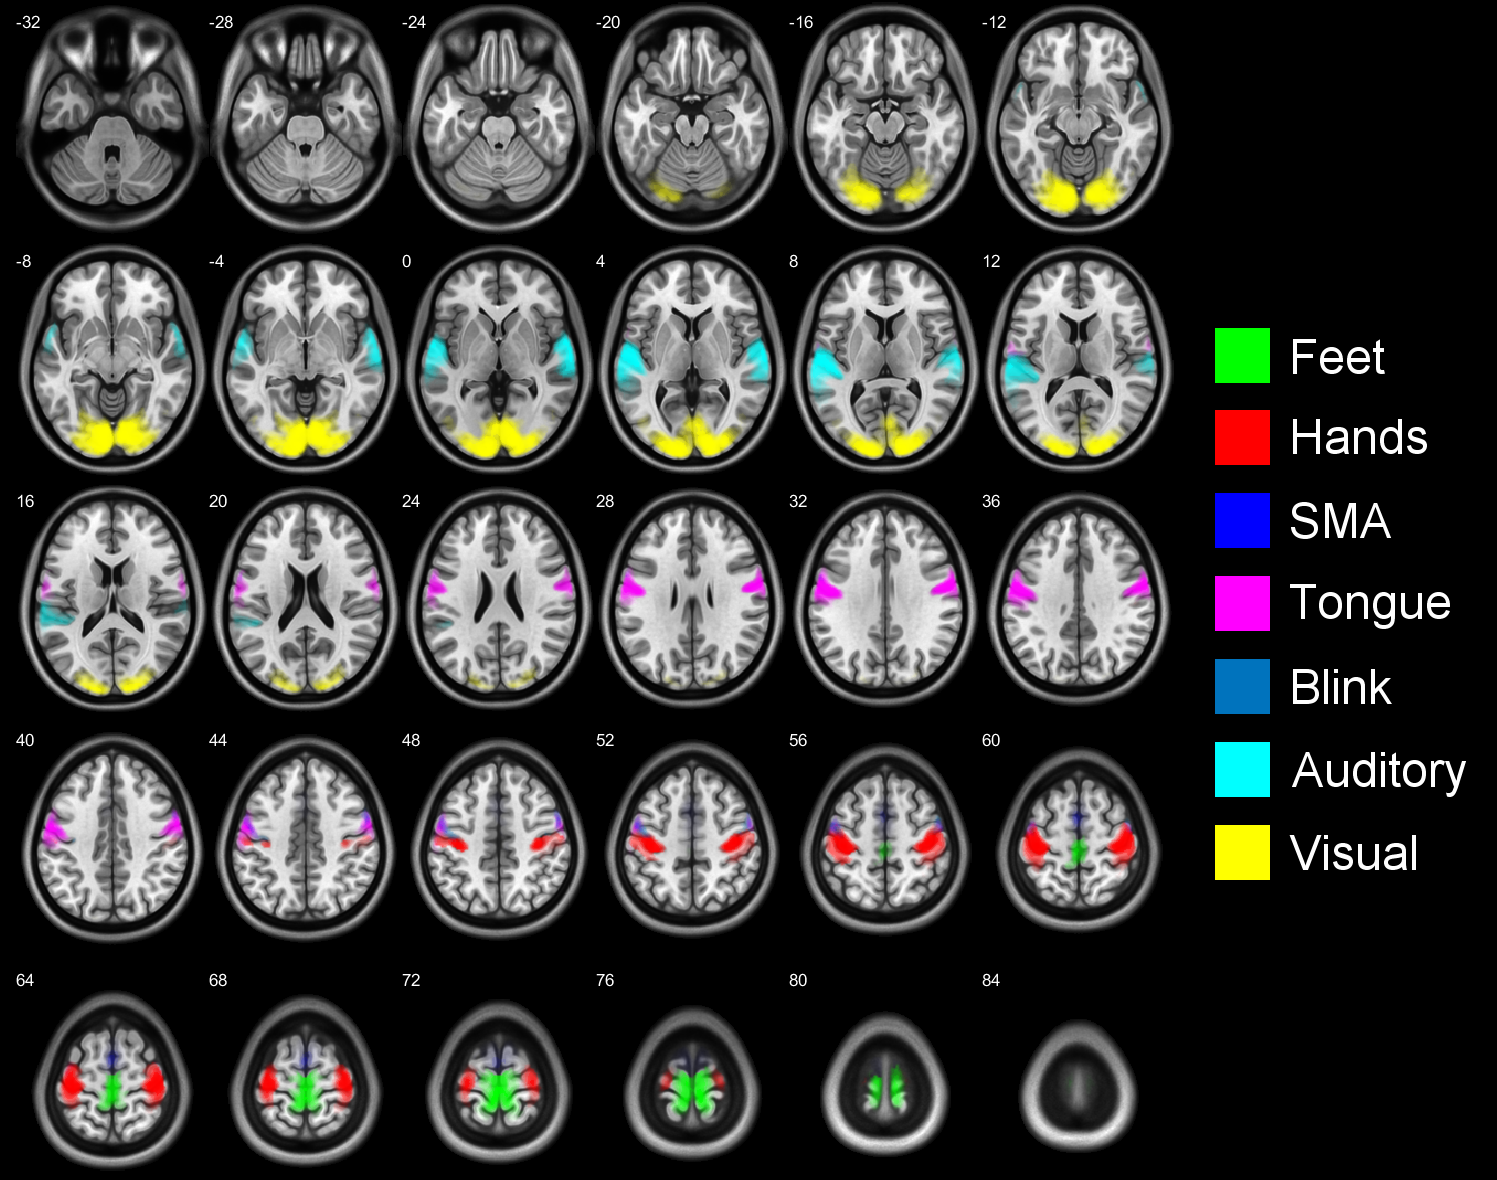
Figure 2.
The cerebral functional areas of 6 tasks and SMA area, each color respective
one functional area.
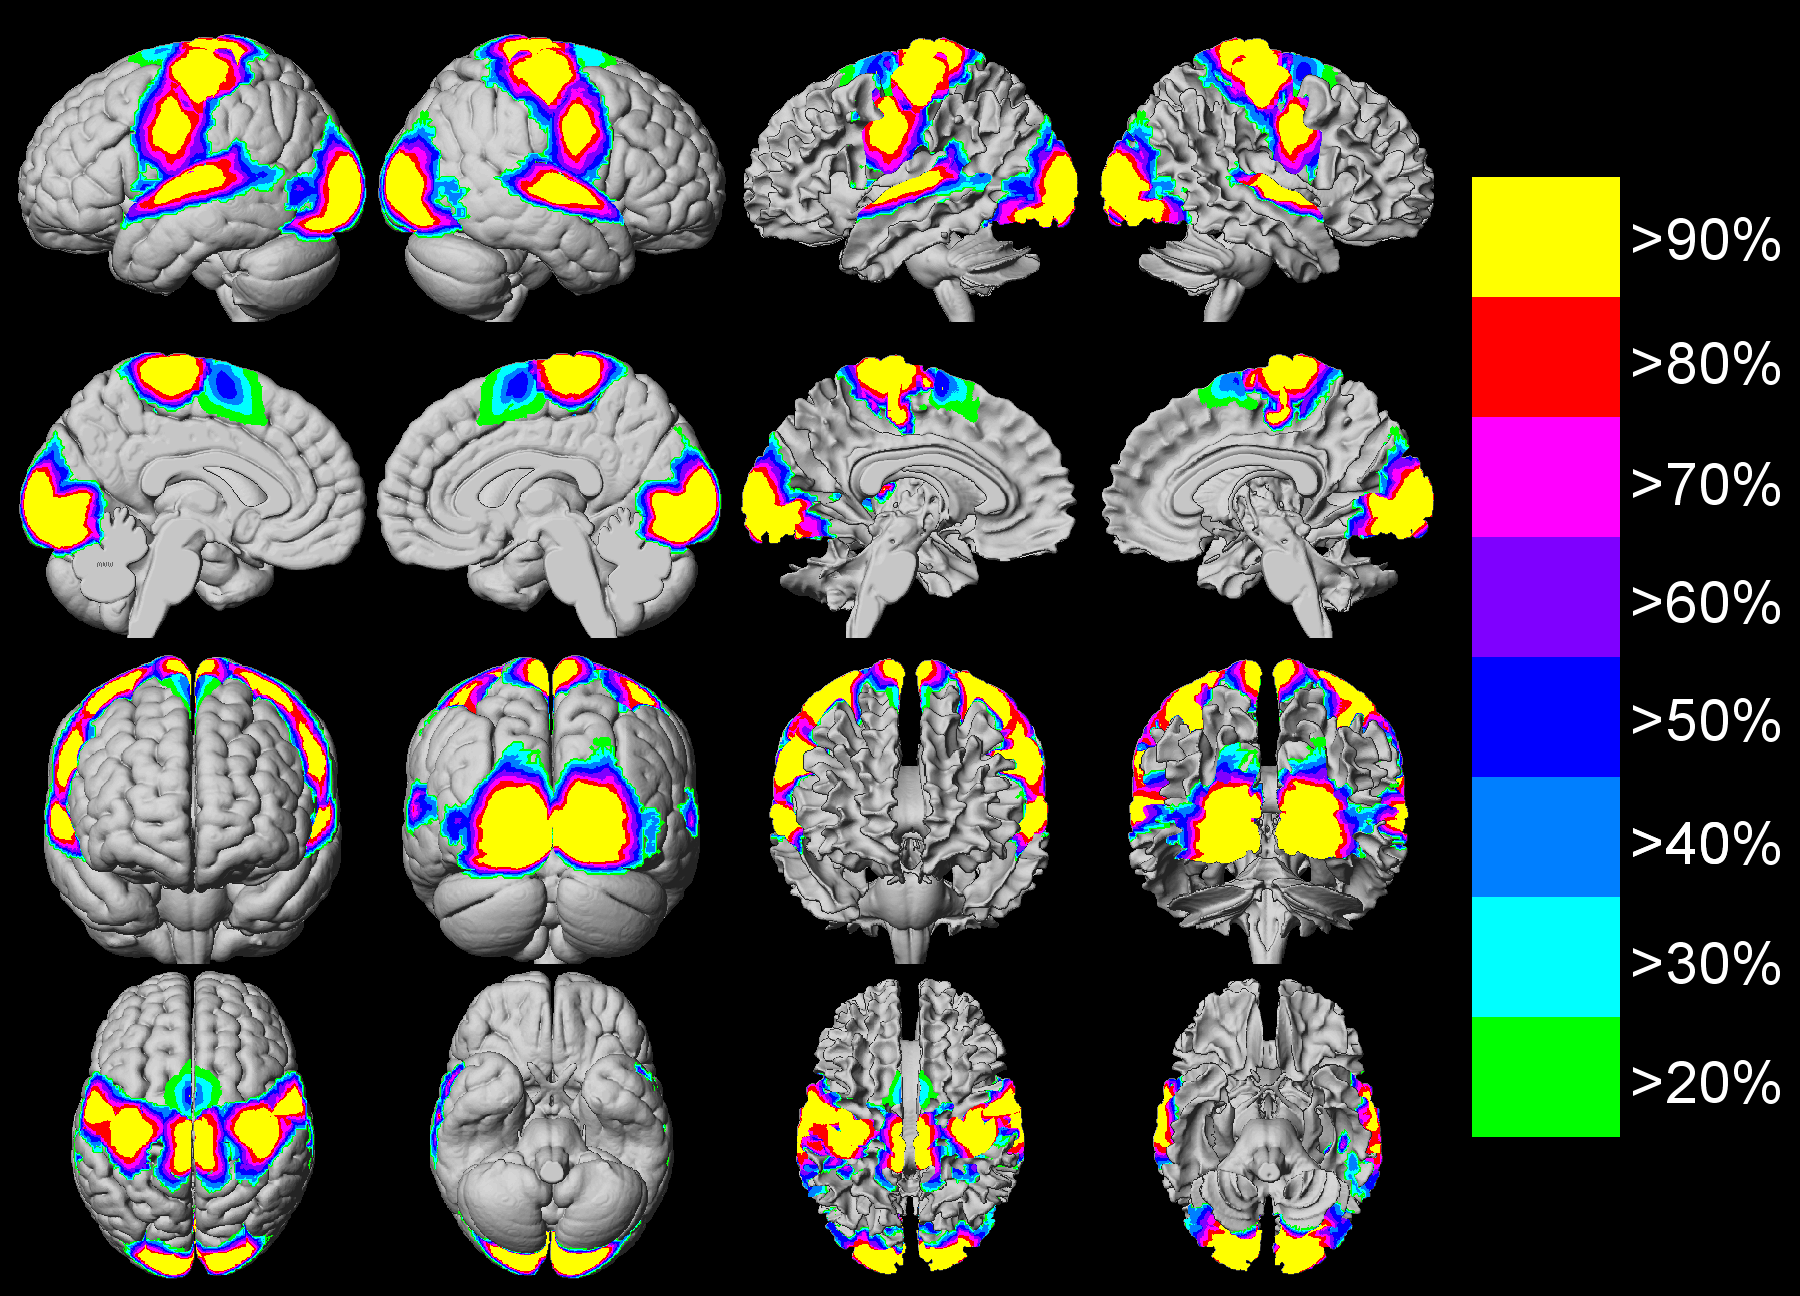
Figure 3.
Probability distribution of 7 different functional areas in human brain