4537
Detection of BOLD Response in the Limbic System to Non-invasive Stimulation of Autonomic Nervous System with SMS at 7T1Department of Medical Radiation and Nuclear Medicine, Karolinska University Hospital Huddinge, Stockholm, Sweden, 2Division of Cerebral Integration, National Institute of Physiological Sciences, Okazaki, Japan
Synopsis
Previous studies of clinical patients indicate that kinetic oscillatory stimulation (KOS) in nasal cavity has a positive impact on the functioning of autonomic nervous system (ANS). For better under standing of the mechanisms underlying this treatment efficacy, we used a 7T MRI system equipped with simultaneous multiple slice (SMS) imaging techniques to study the brain activation during a robust block design of KOS.The findings from the current study demonstrate that KOS is effective to induce regulatory response of the CNS control network.
Introduction
Brain stimulation in general and non-invasive brain stimulation in particular has become an attractive treatment for a number of disorders, such as Parkinson’s disease and epilepsy. Taking advantage of the rich innervations and inter-nerve communications in the nasal cavity, we have recently devised a non-invasive nerve stimulation method for exploring its efficacy in treating chronic inflammatory diseases (1-3). This kinetic oscillation stimulation (KOS) method provides an alternative approach to stimulate autonomic nerve system (ANS) without the need of invasive procedure to implant a pacemaker and electrode. Small-scale clinical trials (1,2) have demonstrated that KOS in nasal cavity is effective for relieving symptoms for migraine and rhinitis. For better under standing of the mechanisms underlying this treatment efficacy, we used a 7T MRI system equipped with simultaneous multiple slice (SMS) imaging techniques to study the brain activation during a robust block design of KOS.
Methods
Eight adult male volunteers (age=38±12) were recruited. The fMRI measurements were conducted using a 7T MAGNETOM Terra system (Siemens, Erlangen) equipped with a 32-channel phased-array detector for brain imaging. A single-shot 2D GRE-EPI pulse sequence was used for data acquisition with the following acquisition parameters: 85 slices of 1.6 mm thick, TR/TE=1000/22.2 ms, FOV=208 mm, matrix size=130x130, flip angle=45°, GRAPPA acceleration factor=2 and SMS acceleration factor=5. Each fMRI session lasted 26min corresponding to 1560 dynamic timeframes.
We conducted at least one session of BOLD fMRI per participant based on a block design. The stimulation paradigm consisted of 7 epochs of inactive resting periods interleaved with 6 blocks of active stimulations. The block duration was 2 minutes. The KOS device was acquired from Choodate Medical AB (https:// www.chordate.com). The original operation interface and power supplier were stripped and replace with a relay controlled by a microprocessor that was programmed to generate the block paradigm described above. A clear polyethylene plastic tube (ID=8mm) was used to extend the nasal catheter through the penetration panel. The catheter was inserted into the nasal cavity during the entire session. For active stimulation, the catheter was inflated at the pressure of 100 mbar with an oscillation frequency of 68 Hz.
The fMRI data underwent a standard preprocessing pipeline that was performed with AFNI and FSL programs in a bash wrapper (3-5). The procedure included the following main steps: Temporal de-spiking, six-parameter rigid body image registration for motion correction, spatial normalization to the standard MNI template using a 12-parameter affine transformation, re-sampled to isotropic resolution using a Gaussian kernel (FWHM=2mm), nuisance signal removal by voxel-wise regression using 16 regressors based on the motion correction parameters, average signal of the ventricles, average signal of the core white matter and the1st order derivatives of the above regressors, baseline trend removal up to the 5th order polynomial, low-pass filtering at 0.08Hz.
Individual activation map was generated by Pearson’s correlation calculation using the block activation paradigm as the reference function. The group activation results were assessed by one-sampled t-test and a threshold at t>9.87 (p<10-4, uncorrected for multiple comparisons) and a minimum cluster size> 30 interconnected voxels.
Results
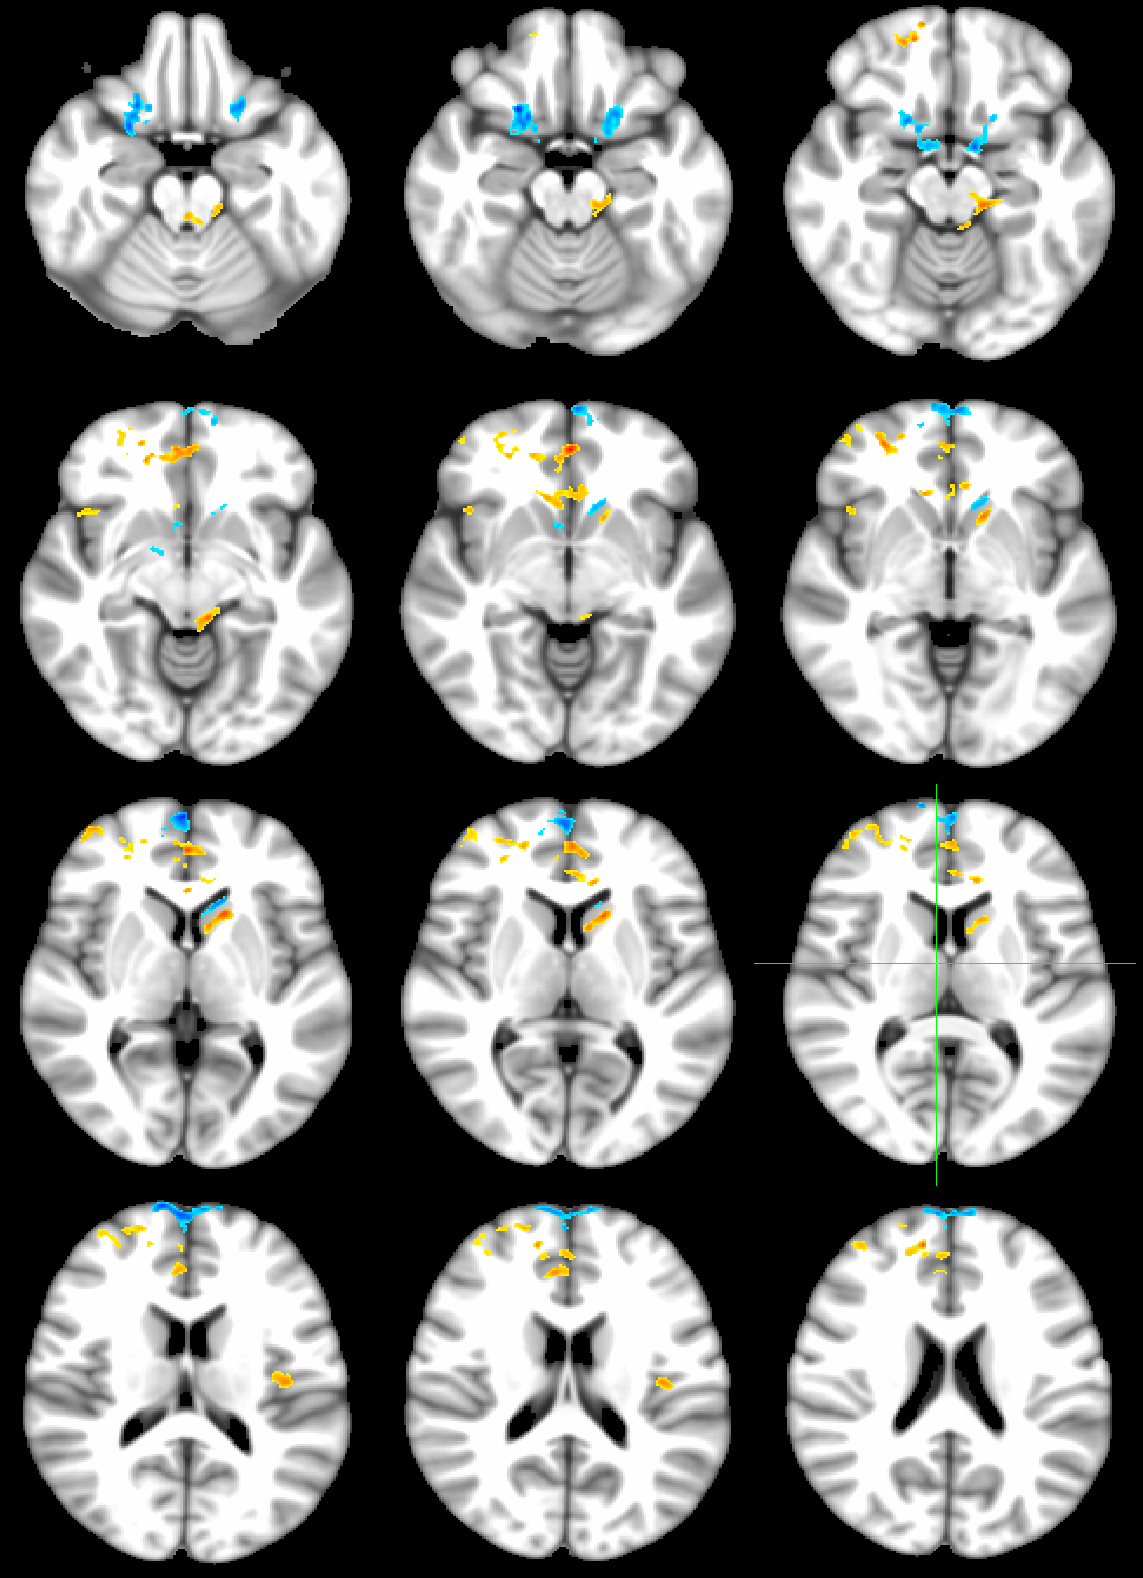
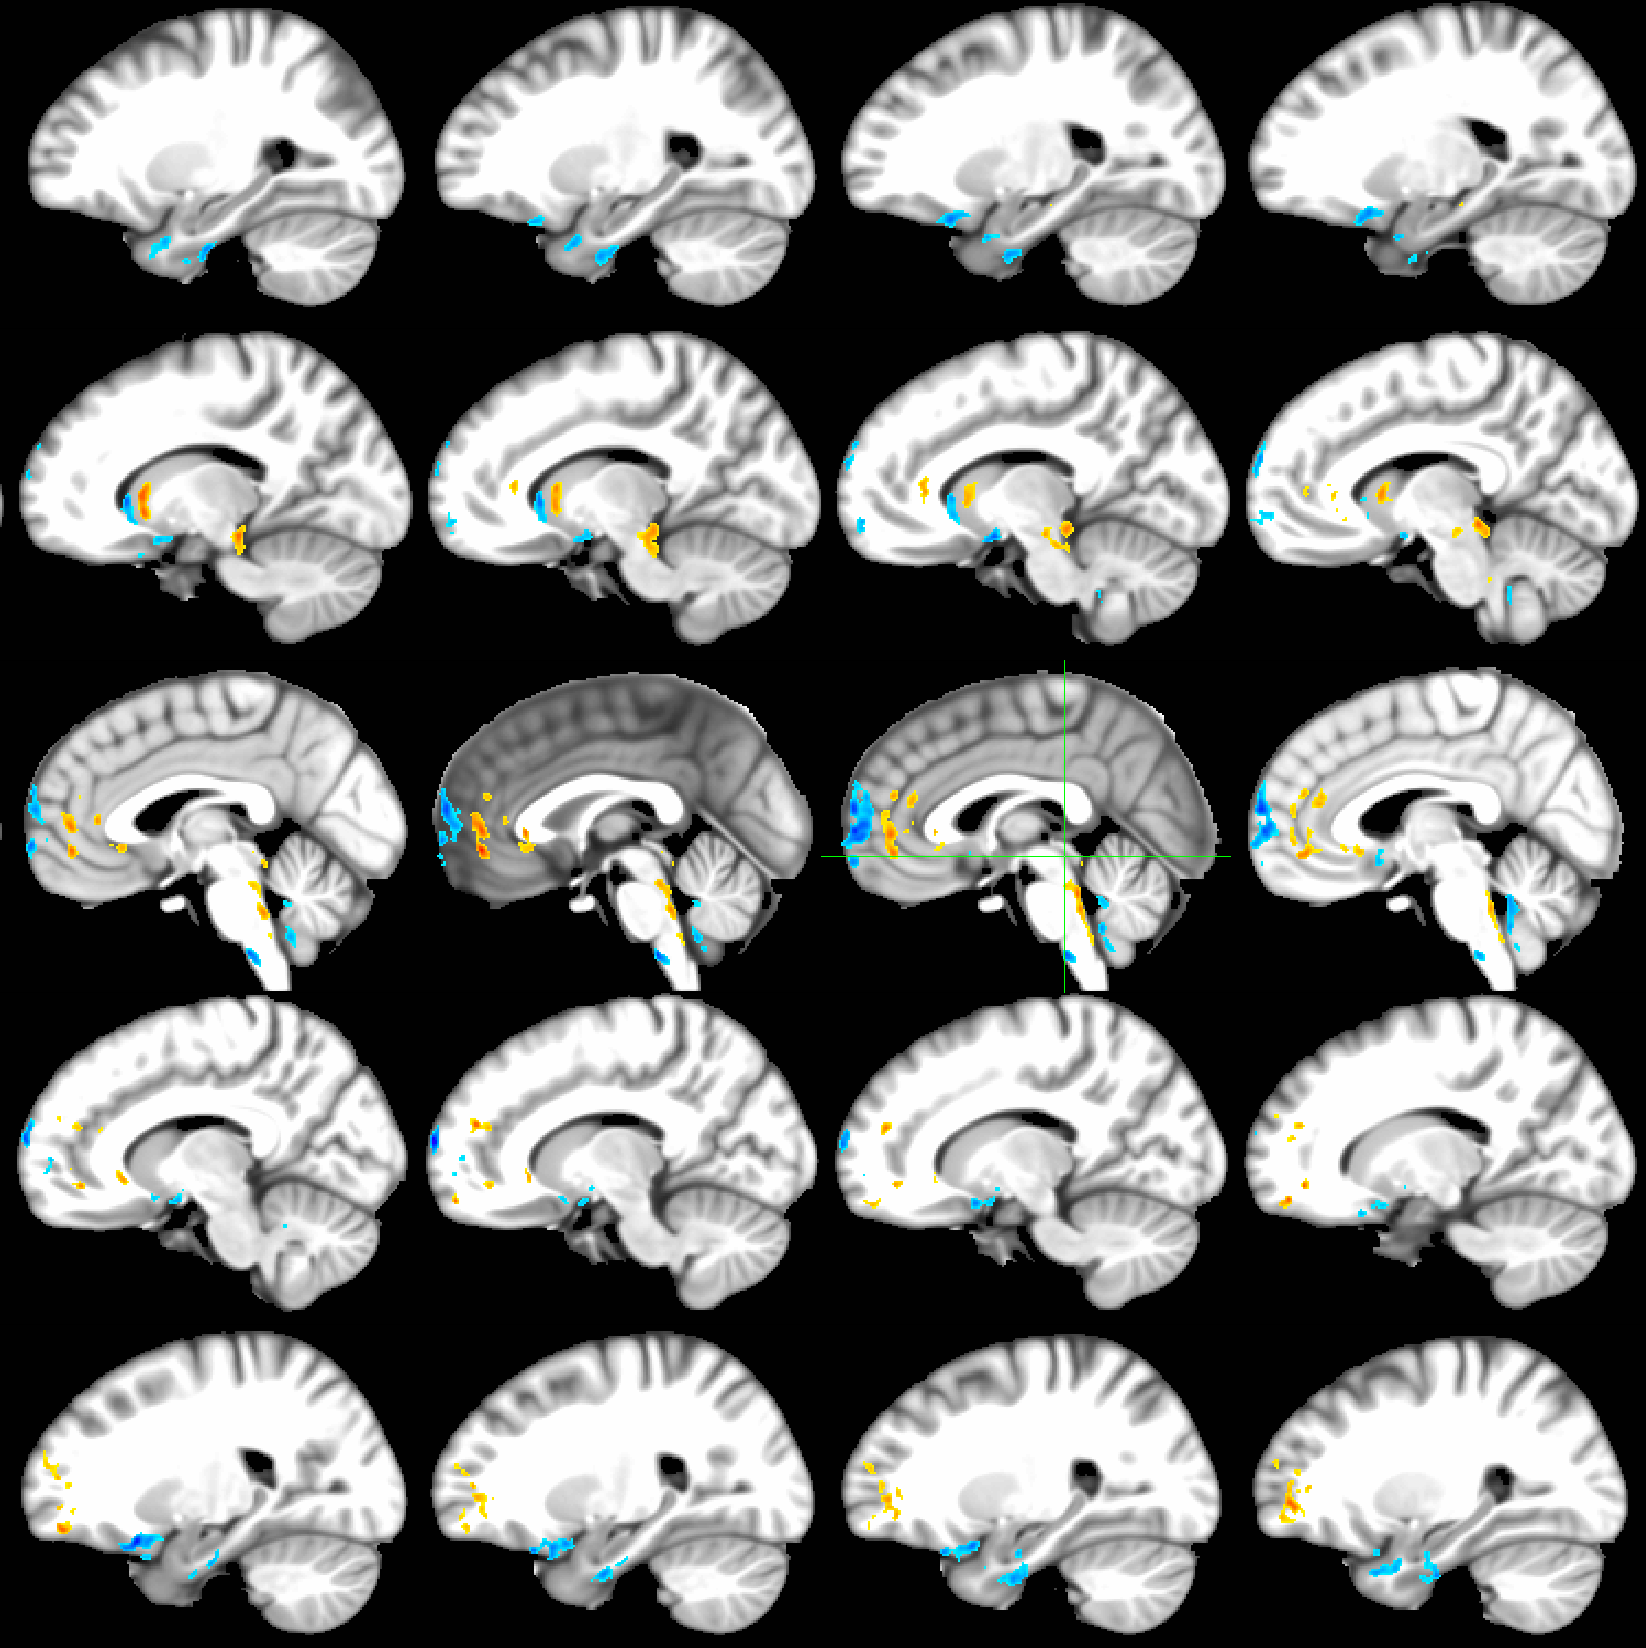
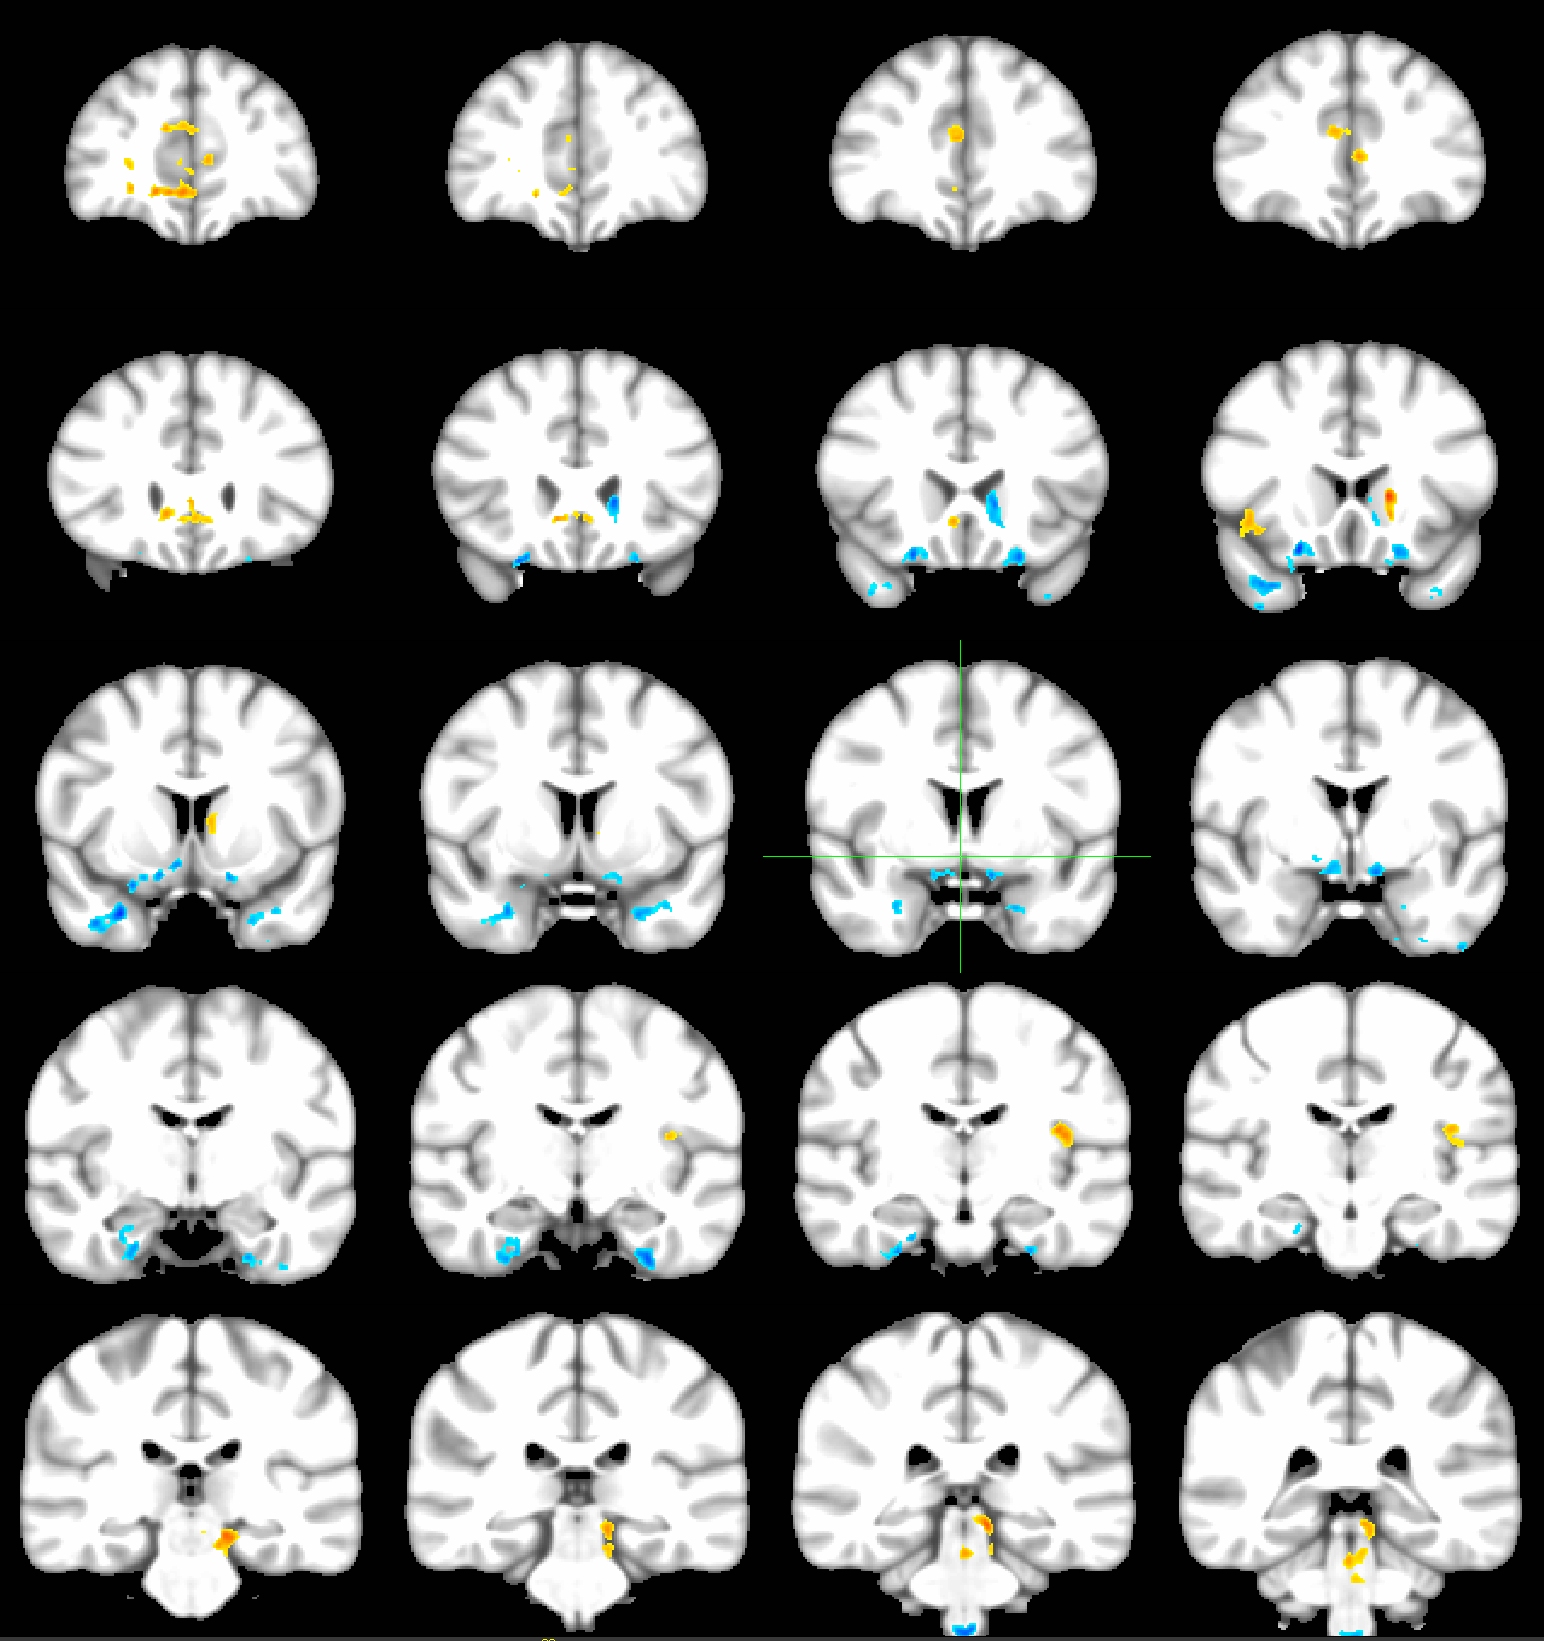
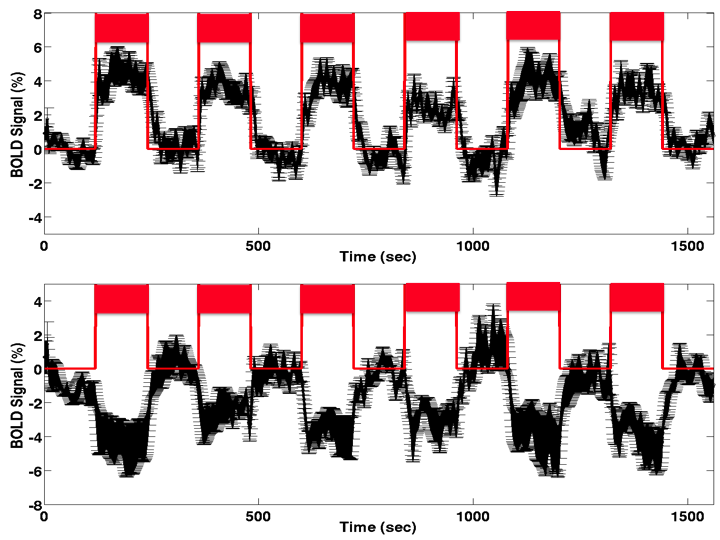
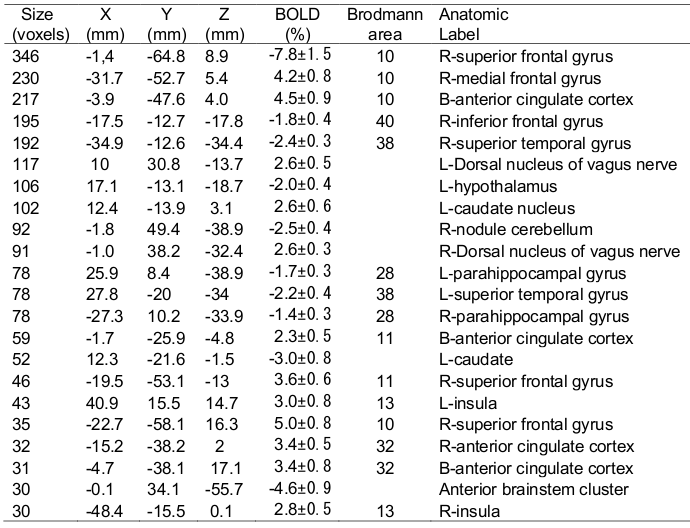
Figures 1-3 depict the group activation maps in axial, sagittal and coronal cross sections, respectively. The locations of the significant clusters and their corresponding amplitudes of the BOLD responses are detailed in Table. 1. As shown, the activated brain regions are mainly located in the limbic system including the prefrontal cortex, anterior cingulate cortex, caudate, insula, hypothalamus, and parahippocampal gyrus. As illustrated by the average time courses (see Figure 4), both positive and negative BOLD responses were observed. Most interestingly, positive response in the dorsal nucleus of vagus nerve was also detected.Discussion
Previous KOS studies of clinical patients indicate that the KOS has a positive impact on the functioning of ANS possibly by restoring its homeostasis through short-term regulation from the central nervous system (CNS) control network (3). The findings from the current study demonstrate that KOS in nasal cavity is indeed associated with robust functional responses in the limbic system and dorsal nucleus of vagus nerve. This implicates that KOS treatment may has similar impact as the electric stimulation of vagus nerve (6,7). It explains the anti-inflammatory efficacy of KOS treatment for chronic inflammatory diseases.Conclusion
Taking advantage of the high contrast-to-noise ratio for BOLD fMRI at 7T and the acquisition efficiency of SMS techniques, we were able to detect robust brain activations in response to KOS in nasal cavity. The results demonstrate that KOS is effective to induce regulatory response of the CNS control network to restore the neurophysiological homeostasis in the ANS.Acknowledgements
The authors would like to acknowledge the supports from ALF Fund of Stockholm Province, Karolinska University Hospital, and National Institute of Physiological Sciences in Japan. Stimulating discussion with Dr. J. E. Juto has been very helpful.References
1. Juto JE, Hallin R. Kinetic oscillation stimulation as treatment of acute migraine. A randomized, controlled pilot study. Headache 2015;55:11. 2. Juto JE, Axelsson M. Kinetic oscillation stimulation as treatment of non-allergic rhinitis: an RCT study. Acta oto-laryngologica 2014;134(5):506-512. 3. Li TQ, Wang Y, Hallin R, Juto JE. Resting-state fMRI study of acute migraine treatment with kinetic oscillation stimulation in nasal cavity. Neuroimage Clin 2016;12:451-459. 4. Wang Y, Li TQ. Analysis of whole-brain resting-state FMRI data using hierarchical clustering approach. PloS one 2013;8(10):e76315. 5. Wang Y, Li TQ. Dimensionality of ICA in resting-state fMRI investigated by feature optimized classification of independent components with SVM. Front Hum Neurosci 2015;9:259. 6. Tracey KJ. Reflex control of immunity. Nature reviews 2009;9(6):418-428. 7. Tracey KJ, Fong Y, Hesse DG, Manogue KR, Lee AT, Kuo GC, Lowry SF, Cerami A. Anti-cachectin/TNF monoclonal antibodies prevent septic shock during lethal bacteraemia. Nature 1987;330(6149):662-664.Figures