4533
On the (non-)equivalency of monopolar and bipolar settings for deep brain stimulation fMRI studies of Parkinson’s disease patients1GE Global Research Center, Niskayuna, NY, United States, 2GE Global Research Center, Bangalore, India, 3University Hospital Network, Toronto, ON, Canada, 4Albany Medical Center, Albany, NY, United States
Synopsis
The equivalency of brain responses in fMRI studies of Parkinson’s disease (PD) patients studied in monopolar and bipolar deep brain stimulation (DBS) configurations was assessed. Five PD patients underwent 30s/30s ON/OFF DBS fMRI scans using their clinical (monopolar) settings and an equivalent bipolar setting, in which the cathode remained unchanged, and a proximal electrode was rendered positive; the voltage was increased by 30% to compensate for the reduced efficacy of the bipolar setting. Monopolar and bipolar configurations resulted in different patterns of brain activation; blind monopolar-bipolar conversion should be avoided for purposes of understanding mechanisms of DBS action.
Introduction
Deep brain stimulation (DBS) is increasingly used for treating movement and psychiatric disorders1; despite its long history, the underlying principles and mechanisms are still not clear. The recent Medtronic label change, allowing patients with specific hardware to undergo MRI with their stimulation on2 opens the door for non-invasive functional brain imaging, which could give valuable insights into the mechanism of DBS action. Given the ~80%/20% distribution of the monopolar/bipolar DBS population, it is important to study patients in all configurations. Unfortunately, however, the monopolar configuration poses larger challenges for many studies, including fMRI; under the restricted Medtronic label, (f)MRI cannot be conducted in monopolar patients with their stimulation turned on. Alternatively, an algorithm for converting monopolar patients to a bipolar setting has been previously proposed3. This study aims to validate the equivalency of the monopolar and converted bipolar settings, by comparing brain responses, as highlighted by fMRI, in a cohort of PD DBS patients scanned in both configurations.Methods
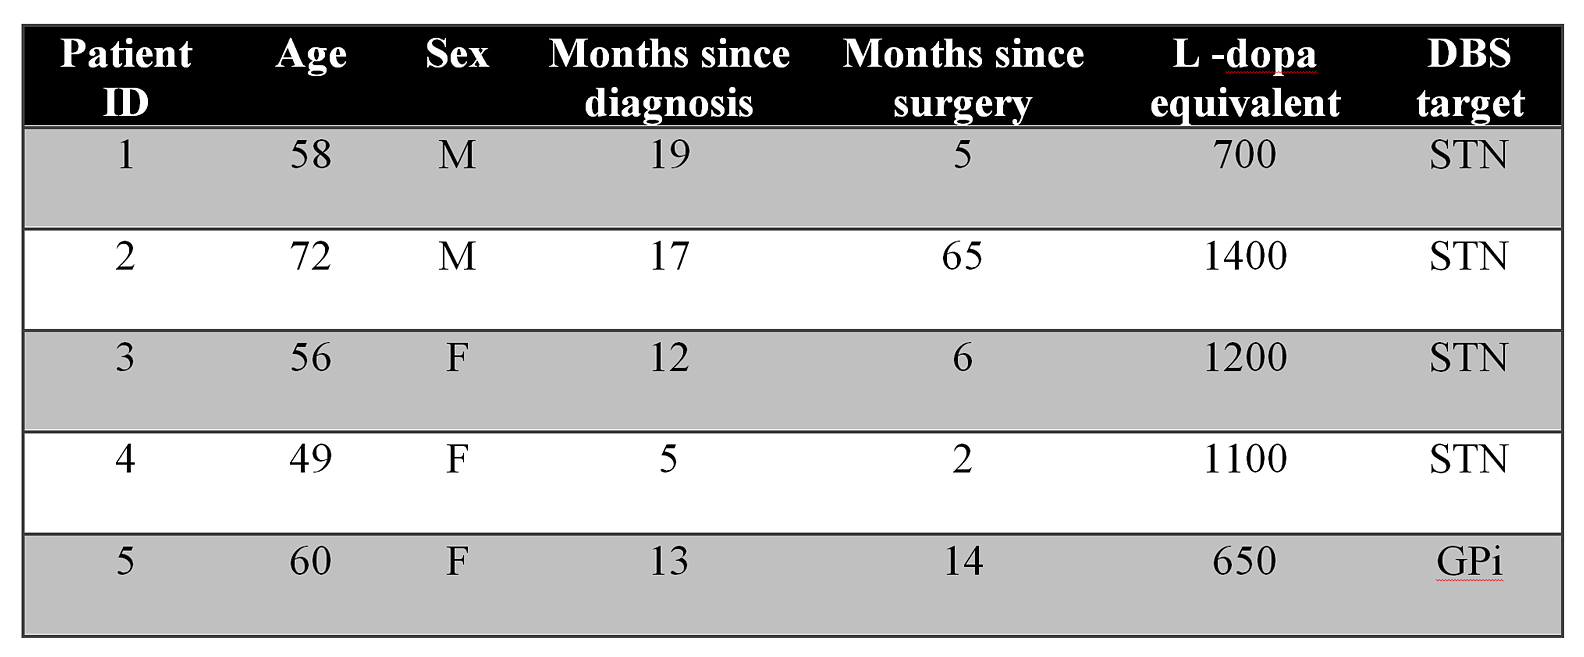
Five Parkinson’s disease (PD) patients with DBS electrodes implanted in their sub-thalamic nucleus (STN) or Globus Pallidus Internus (GPi) were recruited for this study. All patients (Figure 1) had monopolar clinical stimulation and internalized MR-conditional Medtronic hardware. Subjects were scanned on a 3T GE (Milwaukee, WI) scanner, using a transmit-receive head coil. Following the acquisition T1-weighted scan, all patients were set on a 30s ON/30s OFF DBS cycling paradigm for their two fMRI scans (3.75 x 3.75 x 3mm, TE/TR of 45/3011ms, 6min scan time). The first fMRI scan was conducted in the patients’ clinical monopolar setting; for the second one, all patients underwent a conversion to bipolar settings using the algorithm previously suggested to result in clinically equivalent results3. The active electrode remained negative; the adjacent electrode was rendered positive, and the stimulation voltage was increased by 30%. UPDRS-III scores were also acquired, to obtain a correlate for the motor improvements. fMRI analysis was performed using SPM12.Results and Discussion
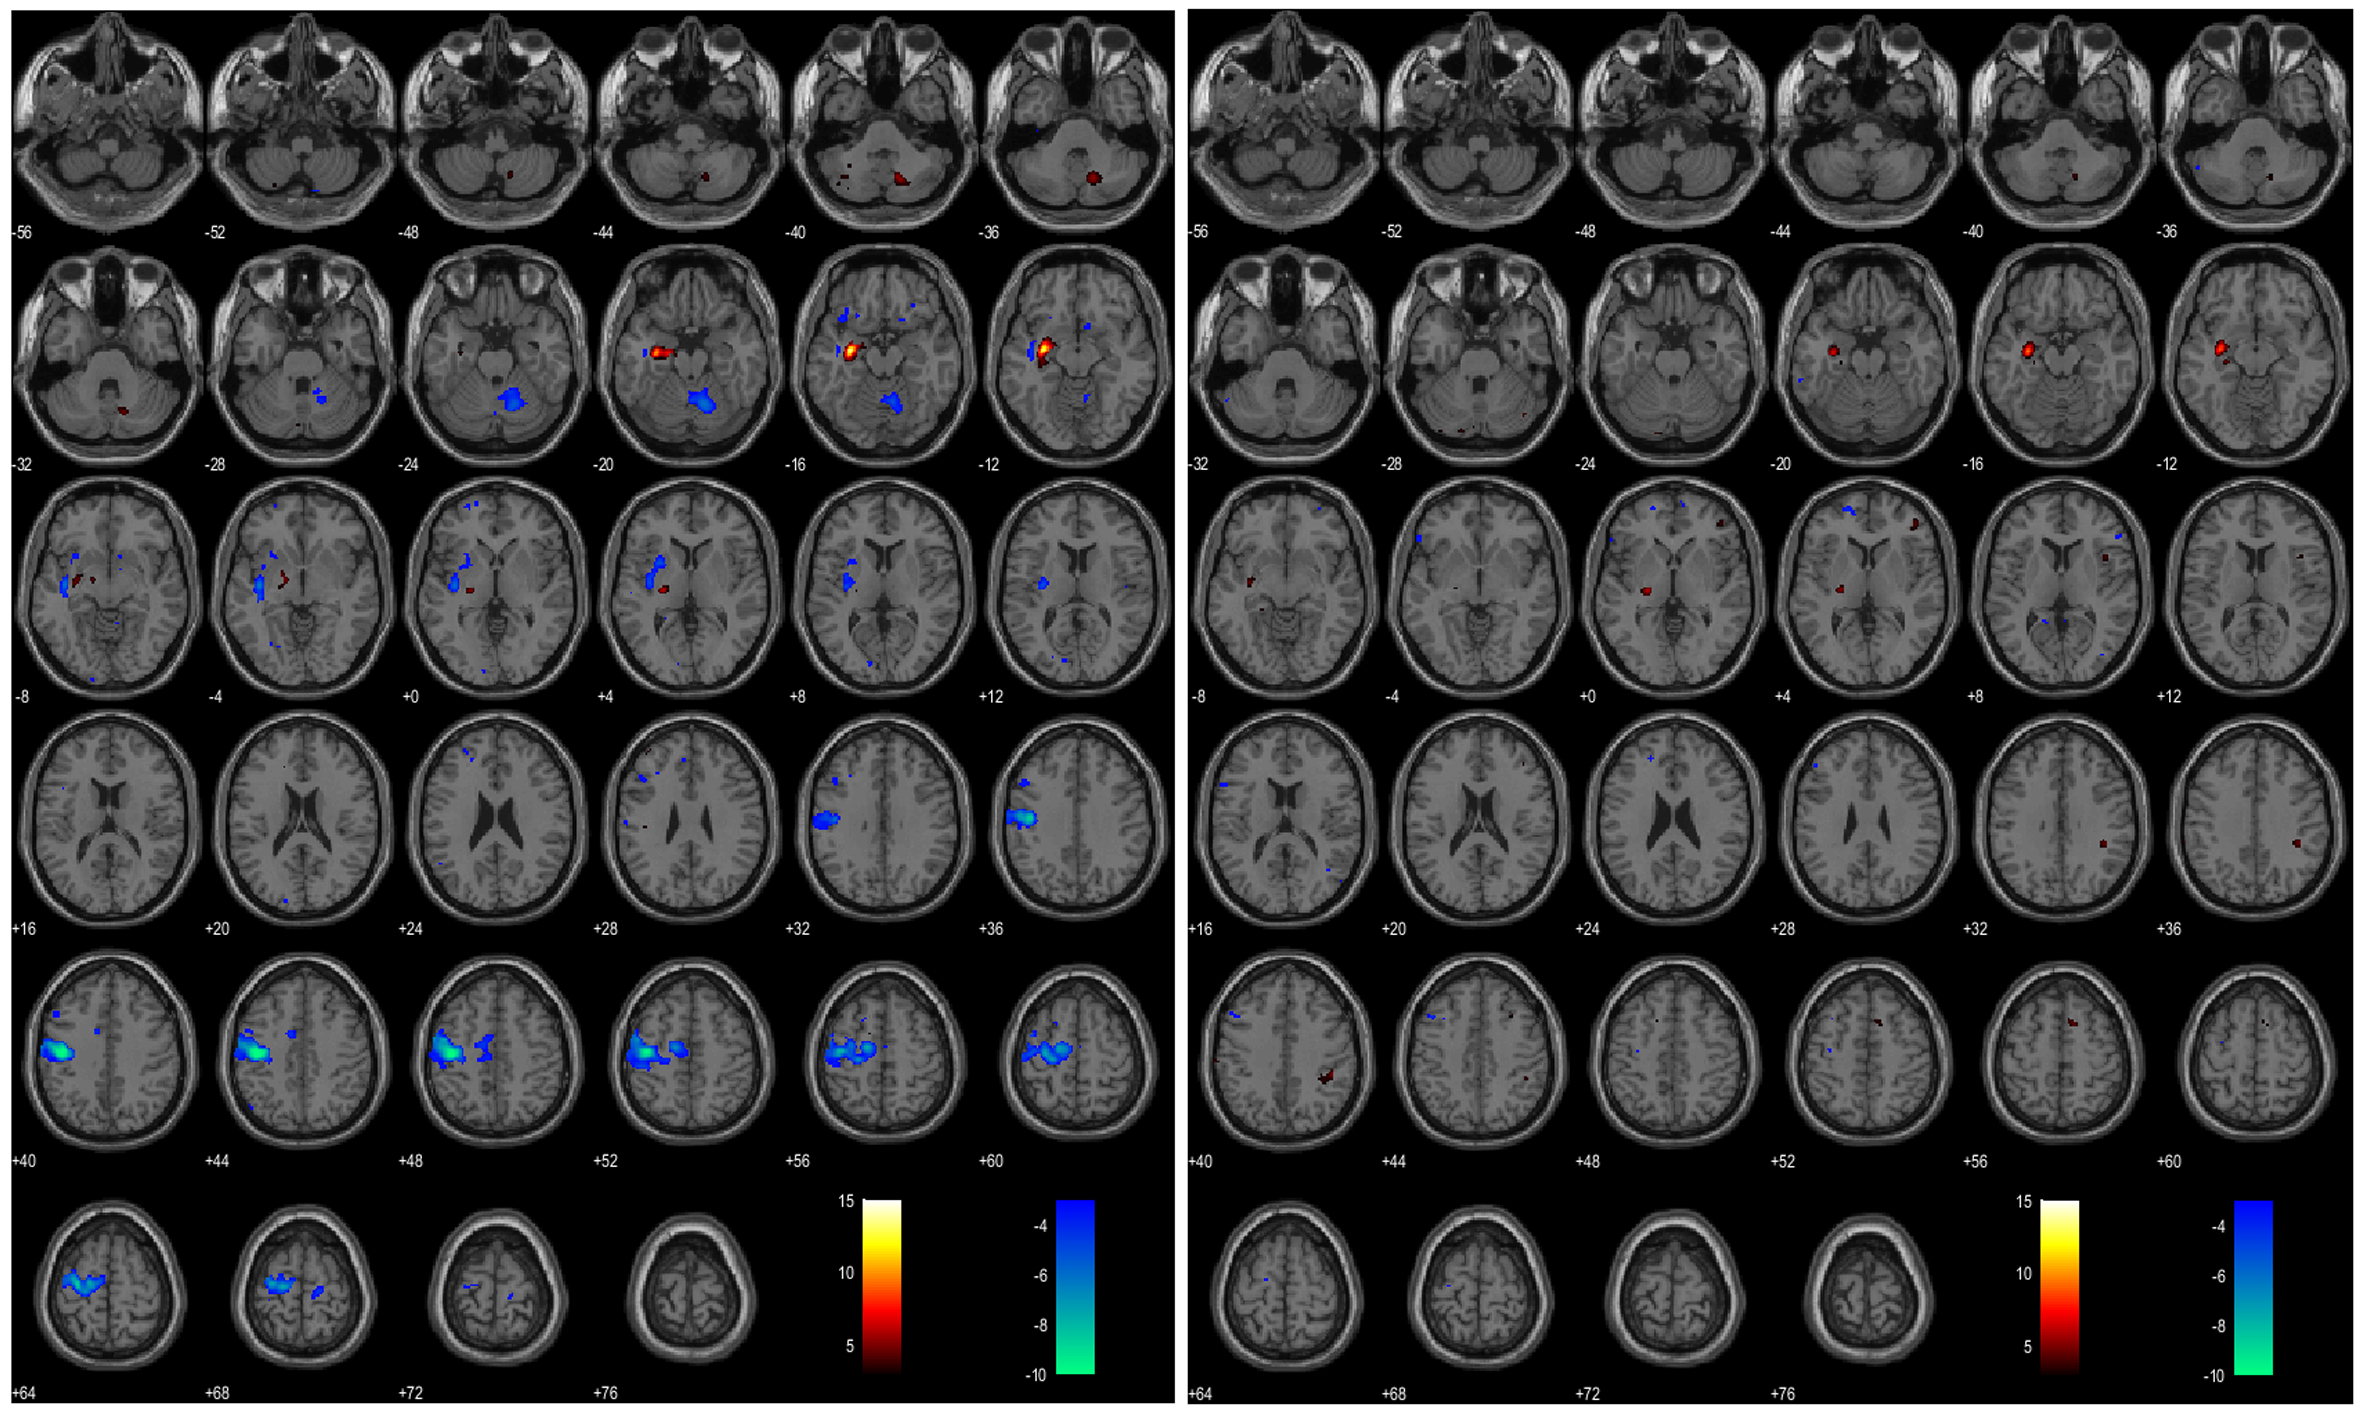
Figure 2 displays the activation and deactivation results for patient P1; this is one of the two patients in our cohort for whom there are common areas of activation for the monopolar and bipolar configurations. The left hippocampus and amygdala, as well as the left pallidum demonstrate DBS-caused activation in both configurations, although at a lower statistical significance for the bipolar case. Conversely, the significant motor deactivation of the monopolar case completely disappears in the bipolar case.
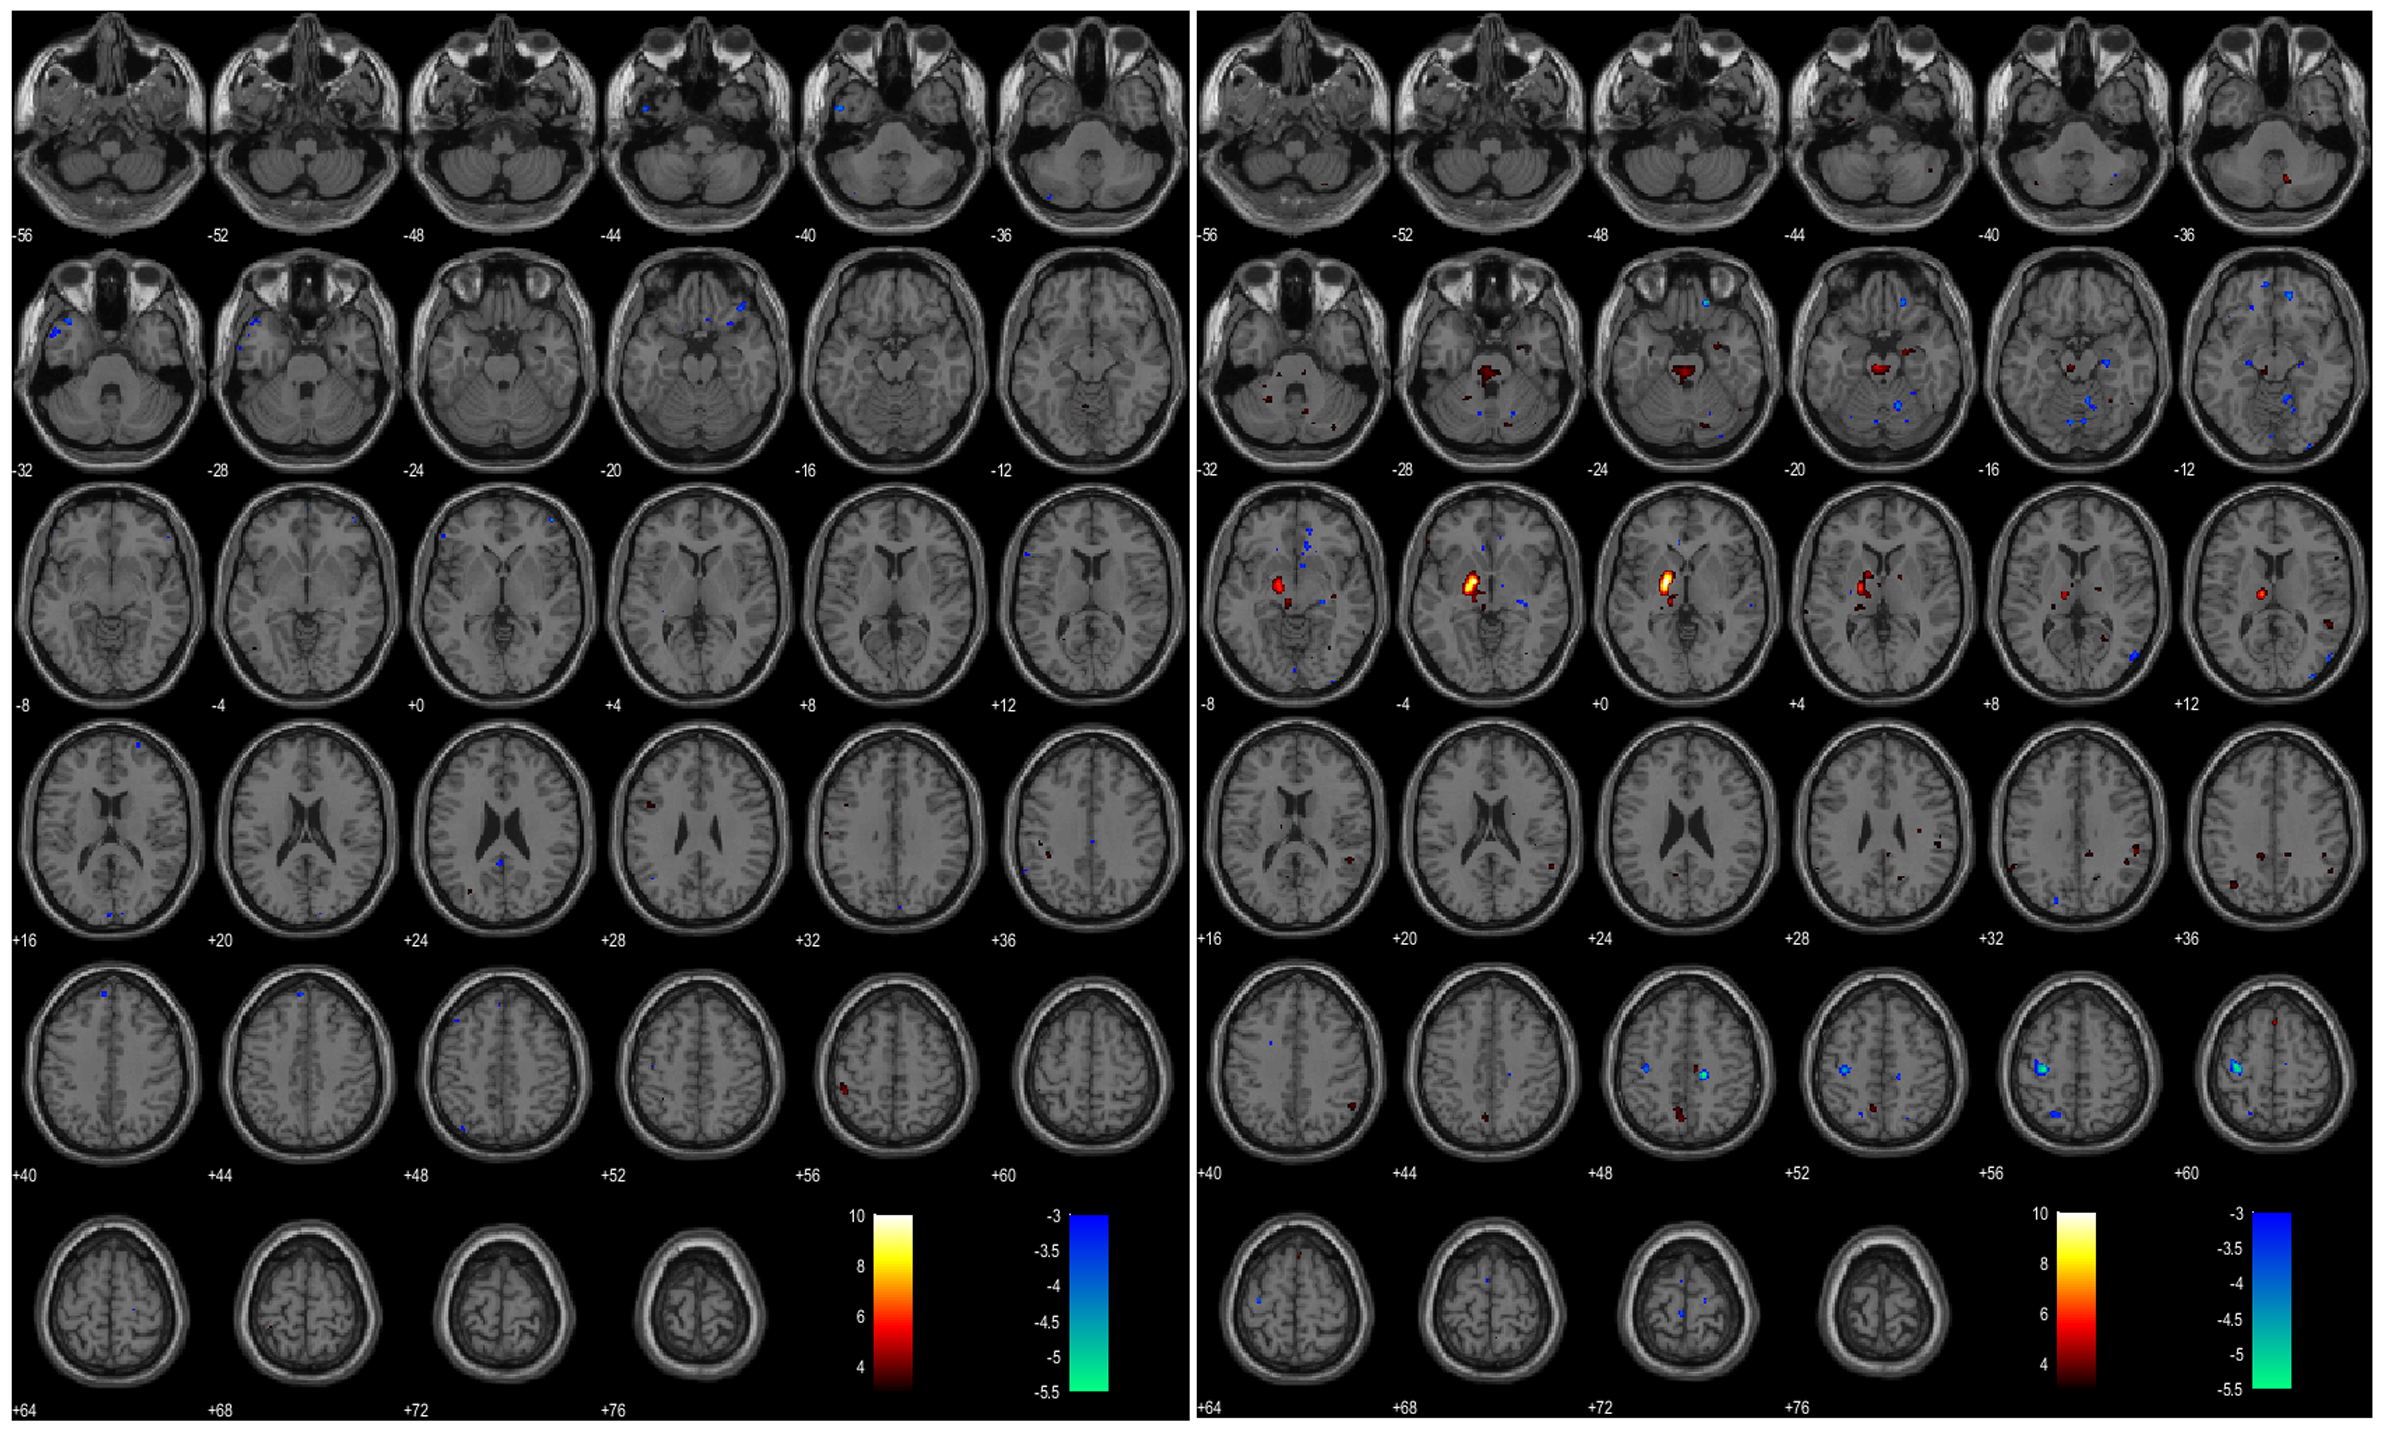
Figure 3 displays results one of the more typical patients in our cohort (P3 of Figure 1), in which there is no commonality between the areas of activation in the monopolar and bipolar configurations. The activation in the Brodmann area (BA) 5 and 7 visible in the monopolar case is replaced by pallidum activation in the bipolar case; no evidence of deactivation in the monopolar configuration is replaced by deactivation in BA 5 and the supplemental motor areas in the bipolar configuration.
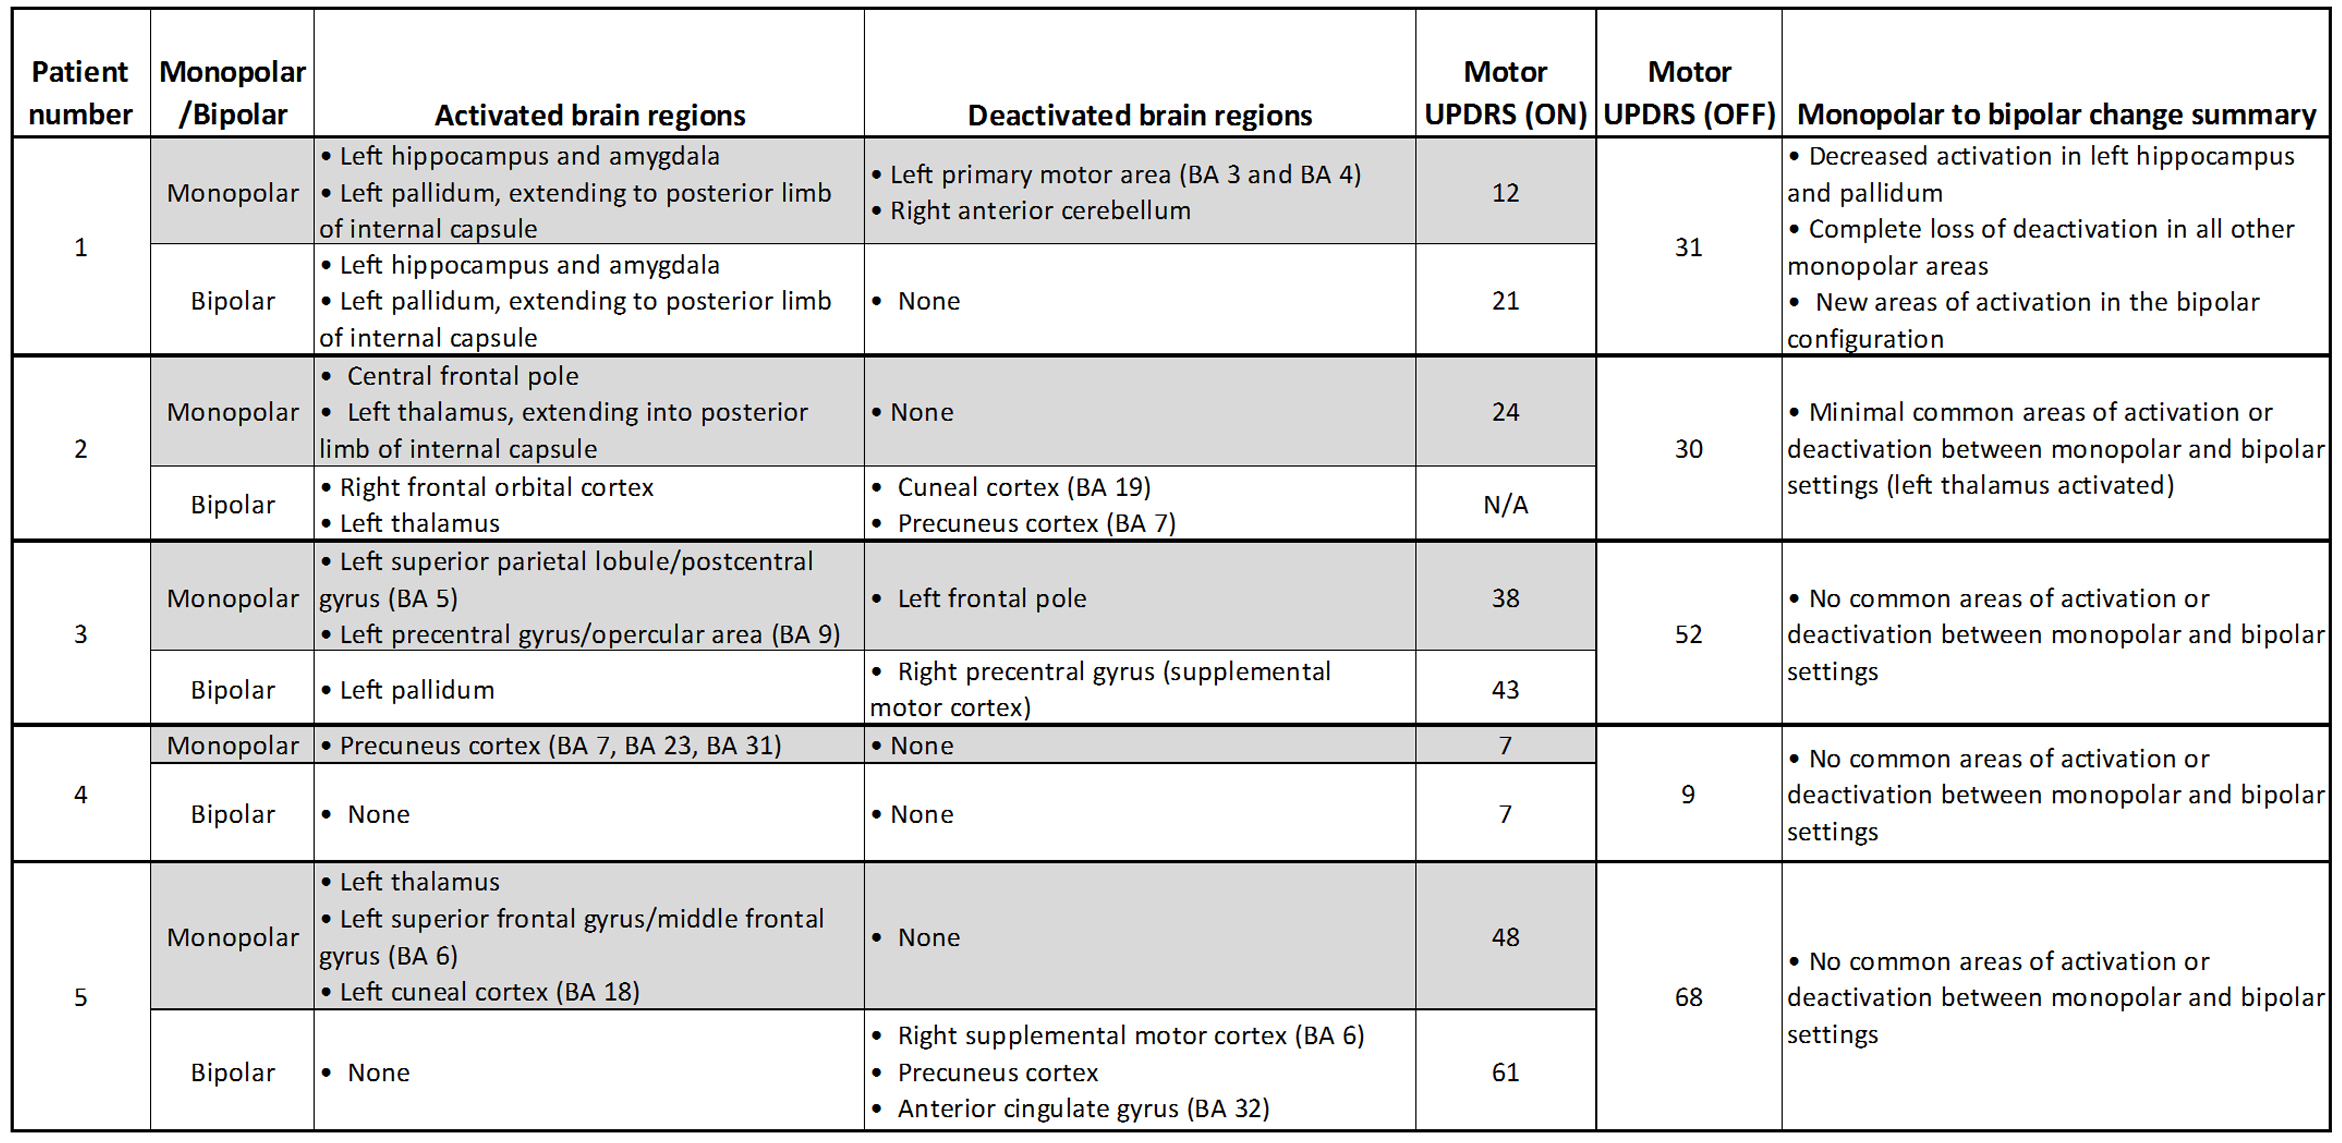
Figure 4 summarized the activation and deactivation areas in our cohort, in both monopolar and bipolar configurations. The UPDRS-III scores, acquired in the on and off states are also displayed. Generally there are higher scores (worse symptom relief) in the bipolar case than in the monopolar, clinical setting. Given our small sample size and the large data spread, the monopolar UPDRS-III scores (25.8±17.2) were not statistically different than the bipolar ones (33±23.8). Interestingly, even in cases in which there were disjoint areas of activation and deactivation between the monopolar and bipolar configurations, both configurations showed symptom relief (as highlighted by lower UPDRS scores).
Conclusions
We have conducted fMRI experiments in 5 PD patients in their clinical monopolar configuration and in a bipolar configuration previously suggested as equivalent3. Areas of activation/deactivation identified for the patients’ clinical settings, such as the thalamus, primary and premotor cortices and superior frontal gyrus are similar to those highlighted in previously published imaging reports4-5. Interestingly, the areas of activation in the monopolar and bipolar configurations were mostly disjoint. This can be explained, to some extent, by the fact that the bipolar volume of tissue activated is smaller than the unipolar one, even at the higher voltage used by us. A 30% voltage increase could have resulted in equivalent activation functions only as far as 2mm away from the stimulating electrode6. Should the axons that needed to be affected reside farther, reduced activation would be expected. Blind monopolar-bipolar conversion should be avoided for purposes of understanding mechanisms of DBS action.Acknowledgements
No acknowledgement found.References
[1] State of the Art for Deep Brain Stimulation Therapy in Movement Disorders: A Clinical and Technological Perspective., Wagle Shukla A, Okun MS., IEEE Rev Biomed Eng. 2016;9:219-33
[2] Medtronic. http://manuals.medtronic.com/wcm/groups/mdtcom_sg/@emanuals/@era/@neuro/documents/documents/contrib_228155.pdf. 2015.
[3] Potter M, Herzog J, Siebner HR, Kopper F, Steigerwald F, Deuschl G, Volkmann J. Subthalamic nucleus stimulation modulates audiospinal reactions in Parkinson disease. Neurology 2008;70(16 Pt 2):1445-1451.
[4] Albaugh DL, Shih YY. Neural circuit modulation during deep brain stimulation at the subthalamic nucleus for Parkinson's disease: what have we learned from neuroimaging studies? Brain Connect 2014;4(1):1-14.
[5] Kahan J, Mancini L, Urner M, Friston K, Hariz M, Holl E, White M, Ruge D, Jahanshahi M, Boertien T, Yousry T, Thornton JS, Limousin P, Zrinzo L, Foltynie T. Therapeutic subthalamic nucleus deep brain stimulation reverses cortico-thalamic coupling during voluntary movements in Parkinson's disease. PLoS One 2012;7(12):e50270.
[6] Rattay F. Analysis of models for extracellular fiber stimulation. IEEE Trans Biomed Eng 1989;36(7):676-682.
Figures