4530
Alterations of functional connectivity in the rat brain induced by NMDA receptor antagonists Traxoprodil and Lanicemine1RG Translational Imaging, Department Neuroimaging, Central Institute of Mental Health, Medical Faculty Mannheim, Heidelberg University, Mannheim, Germany, 2Boehringer Ingelheim Pharma GmbH & Co. KG, Ingelheim, Germany, 3Department of Psychiatry and Psychotherapy, Central Institute of Mental Health, Medical Faculty Mannheim, Heidelberg University, Mannheim, Germany
Synopsis
Since ketamine has been found to act antidepressant, NMDA receptor antagonists are investigated regarding their potential use in therapy of depression. In this study we investigated the effects of traxoprodil and lanicemine on resting state functional connectivity in the rat brain. Both drugs significantly altered hippocampal-prefrontal (Hc-PFC) connectivity with more pronounced effect of traxoprodil. Interestingly the pronounced effects on intra PFC connectivity found in a previous ketamine study could not be observed. Traxoprodil also reduced whole brain network segregation. HC-PFC connectivity appears to be a promising target for further investigation of NMDA receptor antagonists and their antidepressant effects.
Introduction
It is known that non-selective non-competitive NMDA receptor antagonist ketamine has a rapid antidepressant effect if applied at low doses1, 2. But this effect comes at the price of dissociative side effects which prevent a broader clinical use of ketamine. Therefore, alternative antidepressant drugs with fewer side effects could possibly be found among NMDA receptor antagonists working by differential mechanisms. Two candidate drugs are examined in this study regarding their effects on brain connectivity. Traxoprodil (CP 101,606) is a non-competitive NMDA antagonist targeting the NR2B subunit of the receptor. Lanicemine (AZD6765) is a low trapping non-competitive channel blocker. The effects of these drugs on functional brain networks are examined by rs-fMRI and compared to results from previous studies on ketamine3-5.Methods
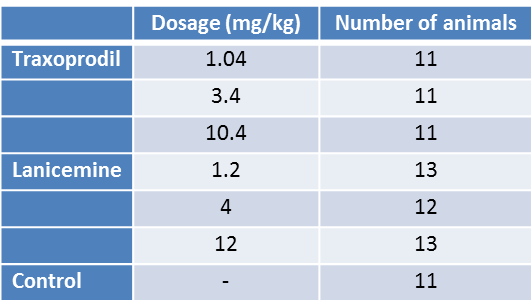
For each drug three groups treated with subcutaneous injections of different doses (see Table 1) were investigated. The control group received saline injections. MRI measurements were performed on a 9.4 T small animal scanner (Bruker Biospin). For each animal a 50 min (2000 TR) fMRI sequence was recorded. Drugs were injected after 10 min of fMRI measurement. Image preprocessing included realignment, unwarping, slice time correction (SPM), filtering of respiratory and cardiac signals (Aztec, retroicor), ICA denoising (similar to ICA AROMA 6) and bandpass filtering (0.01 – 0.1 Hz, AFNI). Average regional time-courses were extracted for 46 anatomically defined regions 7. From the total length of 2000 TR (3000 sec), three slices of 400 TR (600 sec) were extracted: before drug injection, 15 min and 30 min post-injection. ROI-ROI connectivity matrices were calculated using pairwise Pearson’s correlations. In order to examine drug-induced changes, we calculated differences between post-injection and baseline (pre-injection) matrices. Based on previous studies on ketamine 4, 5, we focused on a subnetwork consisting of prefrontal and hippocampal regions. We used a two-way ANOVA with drug dosage and post-injection delay as factors for each drug separately. Results are shown in Fig 1 and 2.
Before calculating network properties, we thresholded the connectivity matrices by preserving the strongest edges (10th to 55th percentile). For each subject and each density threshold we calculated several properties of the network graphs using the Brain Connectivity Toolbox 8, 9. Since the choice of a single density is arbitrary, we calculated areas under the curve (AUC), i.e. averages over the range of thresholds. Focusing on drug-induced changes, we subtracted the AUC values of post-injection datasets from those of the baseline data. Effects were examined by two-sample permutation tests between each of the dosage groups and the control group. For comparison, we applied the same analysis to the whole brain networks from our previous ketamine study 4. Results are shown in Fig 3.
Results
For both drugs we found significant effects on hippocampal-prefrontal (HC-PFC) coupling. Traxoprodil had more pronounced effects than lanicemine. Compared to ketamine effects 4, alterations in intra-PFC connectivity induced by traxoprodil were less pronounced, whereas they were more prominent in HC-PFC coupling. Regarding the direction of the dose effects, we found a dose-dependent increase in HC-PFC coupling, which was also found in response to ketamine. In contrast, connections within the PFC were strengthened by ketamine, but weakened by traxoprodil.
The only significant differences in network properties were decreases of clustering coefficient and small-world index after injection of 3.4 mg/kg traxoprodil at 30 min post-injection. These effects suggest a loss of network segregation, i.e. ability for localized processing, induced by traxoprodil. Despite the lack of significance, the differences in network structure after 15 min were qualitatively similar to those after 30 min for both substances, while they were clearly different between substances. In comparison the changes induced by ketamine were similarly strong as for traxoprodil (without reaching a significance level of p<0.05) and much more consistent across doses.
Discussion
Our analyses of functional connectivity (FC) changes induced by traxoprodil and lanicemine revealed effects on the FC structure, as well as network topology. In general, traxoprodil induced greater differences than lanicemine and the differences 30 min after injection were stronger than after 15 min. In line with ketamine studies 3-5, we found increased HC-PFC connectivity, as well as reduced network segregation. However, we also found a decrease of connectivity within the PFC, contradicting those studies.Conclusion
HC-PFC coupling and intra-PFC connectivity are possible targets for further investigation. Especially, the relationship of HC-PFC connectivity and antidepressant effects could yield further insight to the action of NMDA receptor antagonists and their possible application in therapy of depression.Acknowledgements
We thank Felix Hörner and Claudia Falfan-Melgoza for excellent technical assistance.
The study was funded by Boehringer Ingelheim Pharma GmbH & Co. KG, Ingelheim, Germany.
References
1. Berman RM, Cappiello A, et al. Antidepressant effects of ketamine in depressed patients. Biological Psychiatry. 2000;47(4):351-4.
2. Zarate CA, Jr, et al. A randomized trial of an n-methyl-d-aspartate antagonist in treatment-resistant major depression. Archives of General Psychiatry. 2006;63(8):856-64.
3. Becker R, Braun U, et al. Species-conserved reconfigurations of brain network topology induced by ketamine. Transl Psychiatry. 2016;6:e786.
4. Gass N, Schwarz AJ, et al. Sub-anesthetic ketamine modulates intrinsic BOLD connectivity within the hippocampal-prefrontal circuit in the rat. Neuropsychopharmacology. 2014;39(4):895-906.
5. Grimm O, Gass N, et al. Acute ketamine challenge increases resting state prefrontal-hippocampal connectivity in both humans and rats. Psychopharmacology (Berl). 2015.
6. Pruim RH, Mennes M, et al. ICA-AROMA: A robust ICA-based strategy for removing motion artifacts from fMRI data. Neuroimage. 2015;112:267-77.
7. Schwarz AJ, Danckaert A, et al. A stereotaxic MRI template set for the rat brain with tissue class distribution maps and co-registered anatomical atlas: Application to pharmacological MRI. NeuroImage. 2006;32(2):538-50.
8. Rubinov M, Sporns O. Complex network measures of brain connectivity: uses and interpretations. Neuroimage. 2010;52(3):1059-69.
9. Rubinov M, Sporns O. Weight-conserving characterization of complex functional brain networks. Neuroimage. 2011;56(4):2068-79.
Figures
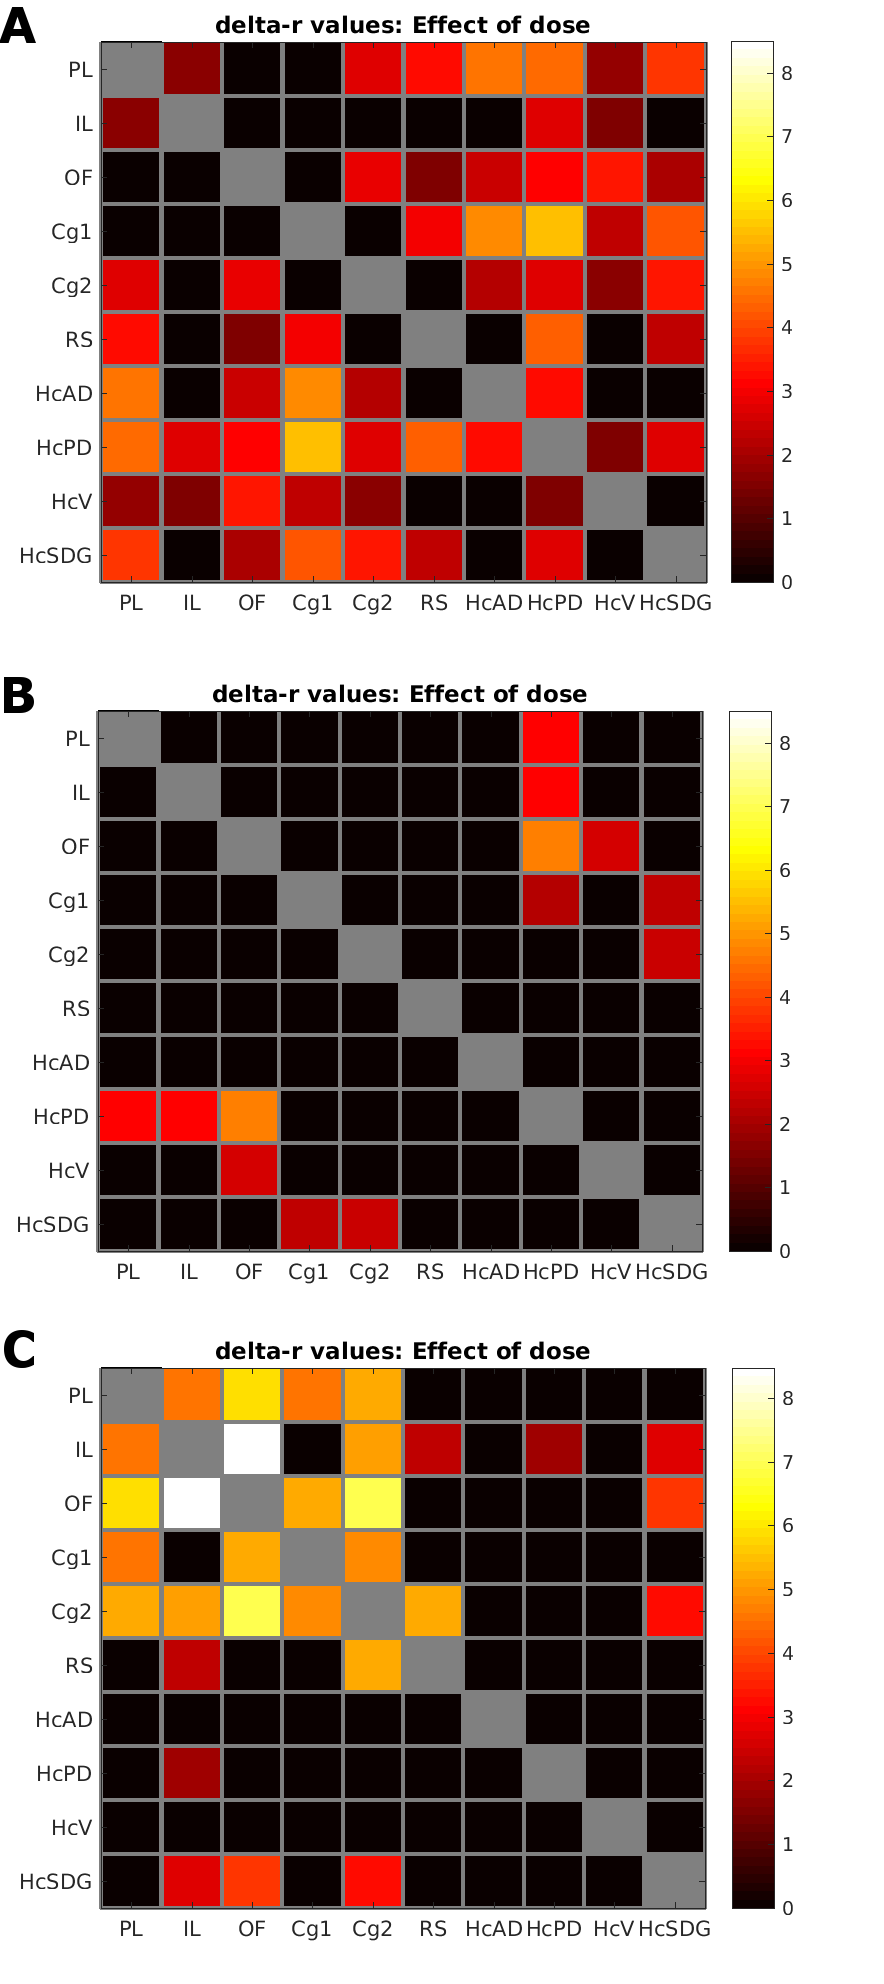
Figure 1: Dose effects of Traxoprodil (A) and Lanicemine (B) on Δz values in the HC-PFC subnetwork. –log(p) is shown only for significant results (p<0.05, FDR corrected). (C) shows significant effect of Ketamine accordingly (from Gass et.al. 4) Color coded values (-log(p) ) reflect significance regardless of the direction of the effect. For directed results refer to Figure 2.
Abreviations: PL: prelimbic cortex, IL: infralimbic cortex, OF: orbitofrontal cortex, Cg1/2: primary/secondary cingulate cortex, RS: retrosplenial cortex, HcAD: anterior dorsal hippocampus, HcPD: posterior dorsal hippocampus, HcV: ventral hippocampus, HcSDG: subiculum/dentate gyrus
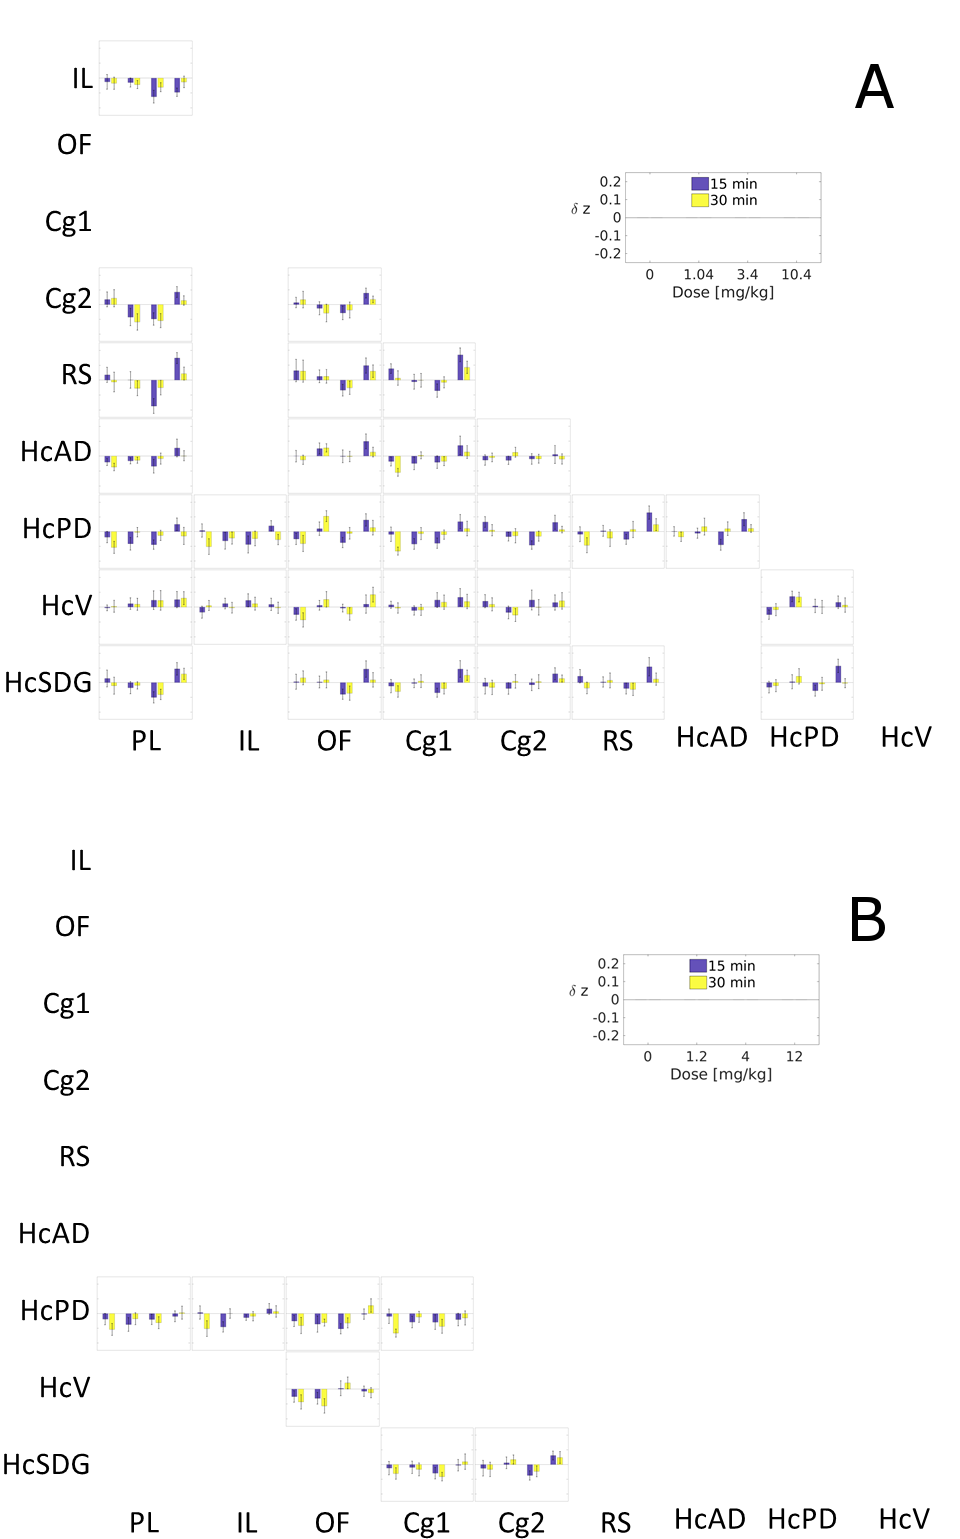
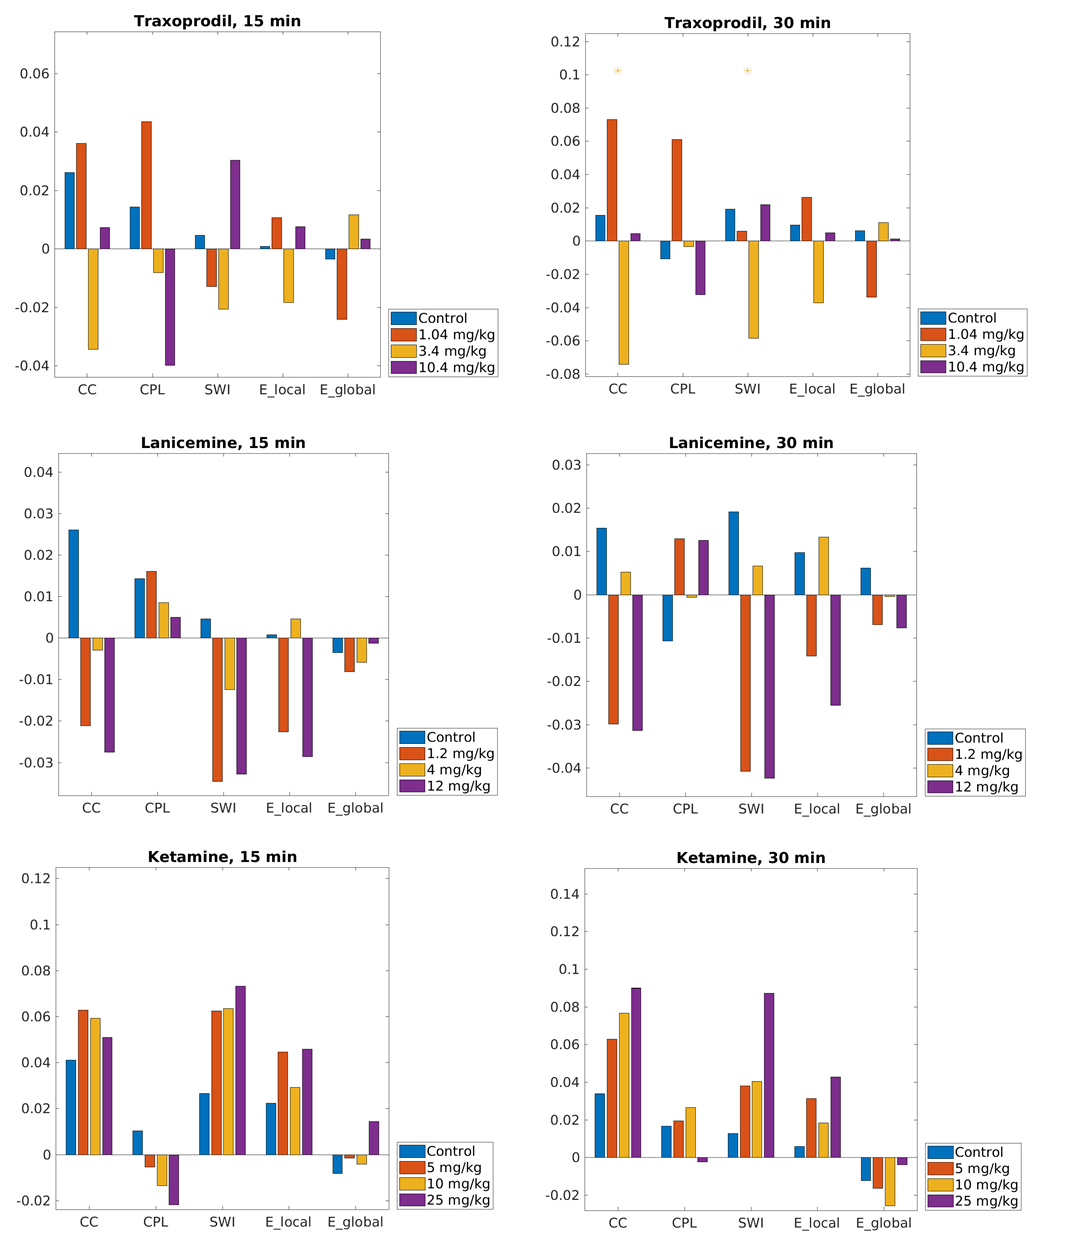
Figure 3: Differences in areas under the curve between pre and post injection periods. Asteriks denote significanct difference in injection effect between dose group (same color) and controls. Traxoprodi at 3.4 mg/kg was significantly decreasing functional segregation of brain networks after 30 min.
Abreviations: CC: clustering coefficient, CPL: characteristc pathlength, SWI: small-world index, E_local: local efficiency, E_global: global efficiency