4525
Spatiotemporal coupling between dopamine neurotransmitter release and BOLD signaling in the ventral striatum1Biological Engineering, MIT, Cambridge, MA, United States, 2Brain and Cognitive Sciences, MIT, Cambridge, MA, United States
Synopsis
As the most commonly used fMRI technique for human brain study, BOLD functional MRI is not detecting neuronal activity directly and the mechanism is not clear. Here we demonstrate, for the first time, to directly explore the relationship between the regional DA neurotransmitter release and the co-localized BOLD signaling in vivo by combing molecular – level dopamine-sensitive MRI technique and BOLD fMRI. Our result demonstrated nonlinear and spatially‐heterogeneity relationships between neurotransmitter activity and the hemodynamic responses in the same region. We expect the result will facilitate a better understanding and explanation of human fMRI results.
Introduction
BOLD functional MRI is the most commonly used fMRI technique in human brain study. However, it is known that BOLD signal is an indirect measurement and the underlying neurovascular coupling mechanism is not clear. Furthermore, for different neurotransmitter systems, the coupling mechanisms are different1-3. The goal of this study is to investigate the relationship between BOLD and neuronal responses by dopamine-sensitive molecular fMRI method. Here we demonstrate, for the first time, to directly explore the relationship between the regional DA neurotransmitter release and the co-localized BOLD. By comparing the DA release with the BOLD signaling in the ventral striatum, we observed nonlinear and spatially‐varying relationships between neurotransmitter activity and the hemodynamic responses. The results are expected to facilitate a better understanding of the mechanisms behind hemodynamic based fMRI.Methods
The BM3h-9D7 probe used here is a protein-based MRI contrast agent and is sensitive to DA concentration changes4,5, The protein was delivered to the brain by intracranial injection. DA-fMRI with MFB stimulation began following 50 minutes of infusion. Imaging was performed on 9.4 T Bruker scanner. Images were acquired with a multi-gradient echo sequence (TR = 251.9 ms, FA = 30, resolution 400 x 400 μm, TEs = 4 ms, 12 ms and 20 ms, scan time 8 s). A block of 0.15 mA 1ms electrical current pulses with 16 s duration was delivered to MFB every 5 minutes. Behavior tests confirmed self-stimulation reward response was evoked using the designed stimulation paradigm. DA release and BOLD signals were distinguished from one another based respectively on their echo time dependence6Results
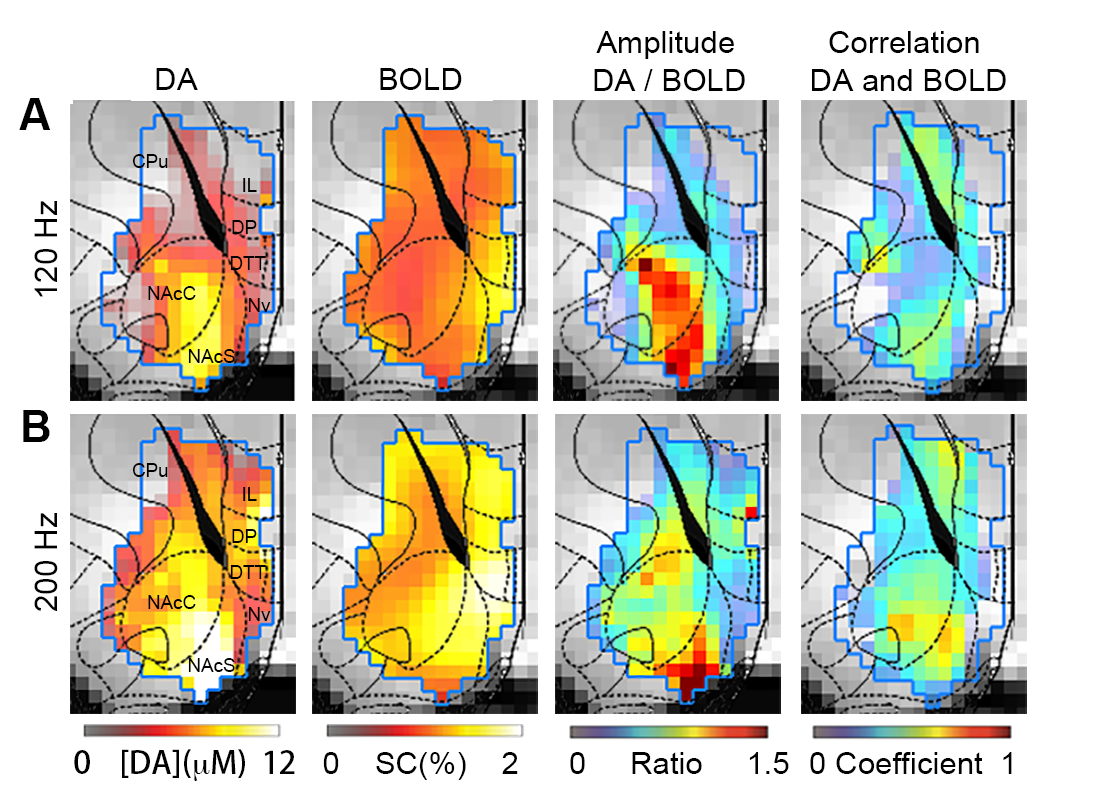
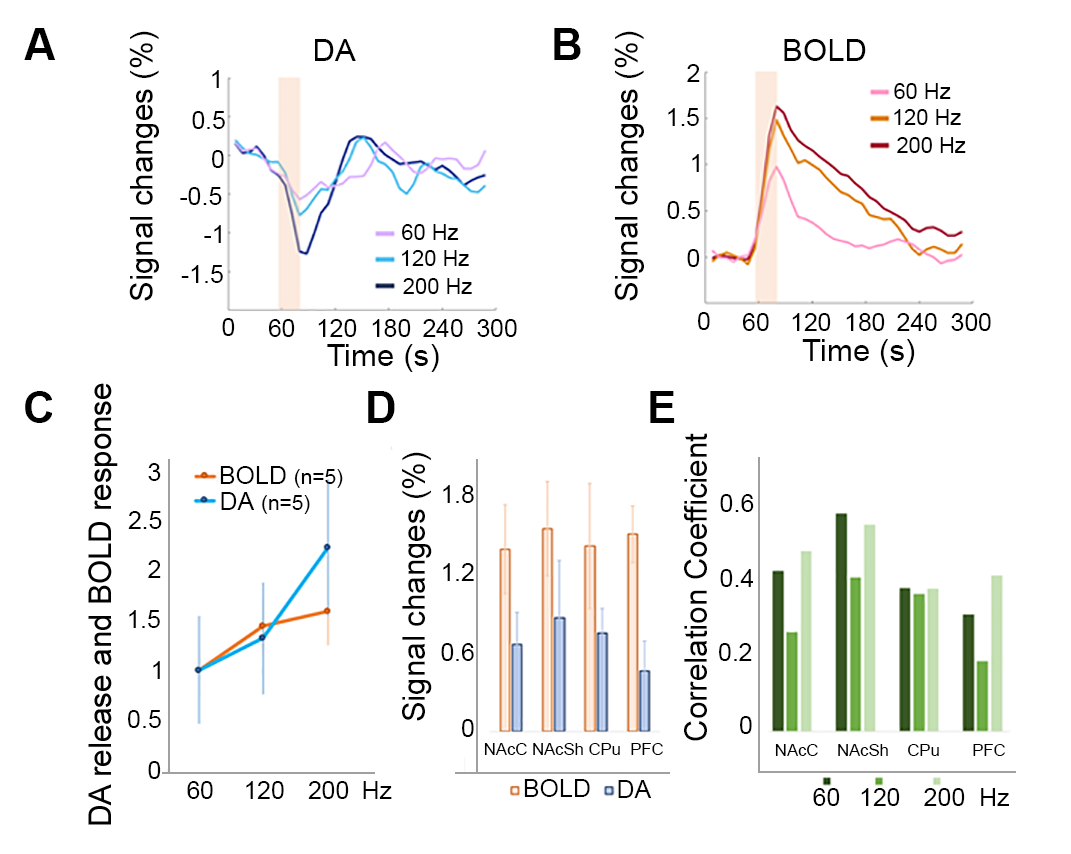
Heterogeneous spatial characteristics: Via voxel-based analysis, we quantitatively mapped the peak amplitude of DA release and the amplitude map of BOLD signals at the same region in the ventral striatum in response to MFB stimulation (Fig. 1). Within NAc, spatially – varying relationships between DA and BOLD signals were revealed. The most pronounced focus of DA release is found in the medial ventral region of NAc core, and the center dorsal region of NAc shell, while the strongest BOLD responses to the same stimulation were found at the edge of NAc shell and in the prefrontal cortex. From the ratio map between the peak amplitude of DA and BOLD in response to 120 Hz stimulation, regions with higher ratio were found in most of NAc core and part of NAc shell. From ROI – based analysis (Fig. 2), both NAc shell and core showed consistent high level of DA release and BOLD signals. On the other hand, in the prefrontal cortex (PFC) little DA release was detected, but the BOLD response in PFC was above the average level in the ventral striatum. Temporal dynamics: Pixel to pixel map of temporal correlation between BOLD and DA release dynamics reveals how closely hemodynamic signals correlated with presynaptic neuronal activity – DA neurotransmitter release. The NAc core, especial when the MFB was stimulated at a higher frequency, showed a high level of correlation. Non-linearity with increased stimulation and pre-synaptic activity: We have conducted three different MFB stimulation frequencies. The DA release at NAc showed robust linearity response to the increased stimulation. However, the BOLD responses reach a plateau with higher DA release (Fig. 2). Both correlation maps and amplitude ratio maps were found different as compared to responses to 120 Hz and 200 Hz stimulation.Discussions:
For the first time, we show our capability to observe DA release and the co-localized BOLD fMRI signaling. As for NAc DA neurons, the uptake of DA neurotransmitters occurs pre-synaptically and is not calcium-dependent, although the release of DA is. Therefore, the detected DA release at NAc will have contributions from both pre- and post-synaptic mechanisms.Figure Captions
Figure 1. A. Spatial-temporal characteristics of DA release and BOLD responses to 120 Hz MFB stimulation. From left to right: Amplitude map of DA release (n=5); Amplitude map of BOLD (n=5); Ratio map between the amplitude of DA and BOLD; Map of temporal correlation coefficients between the DA and BOLD. High level of correlation is revealed in the ventral medial NAc core and dorsal medial NAc shell. (B). Same measurements were conducted to characterize responses to 200 Hz stimulation.
Figure 2. (A) Temporal profile of DA sensor signal changes (SC) across NAc. The signal from BM3-9D7 decreases in the presence of dopamine. As the stimulation frequency increased, DA release kept increasing linearly. (B) Temporal profiles of BOLD response. (C) The slope of BOLD signal vs. stimulation is significantly different from the DA release as a function of stimulus intensity. (D) The amplitude of both DA and BOLD responses in different ROIs. (E) Different correlation between DA and BOLD was observed in different ROIs.
Acknowledgements
This project was supported by NIH Grant R01DA038642, and Parkinson’s Diseases Foundation – the Stanely Fahn Research FellowshipReferences
[1] Enager P, et al. (2009) Pathway-specific variations in neurovascular and neurometabolic coupling in rat primary somatosensory cortex. J Cereb Blood Flow Metab 29(5):976-986 [2] Chen YI, et al. (2010) Pharmacologic neuroimaging of the ontogeny of dopamine receptor function. Developmental neuroscience 32(2):125-138 [3] Knutson B & Gibbs SE (2007) Linking nucleus accumbens dopamine and blood oxygenation. Psychopharmacology 191(3):813-822. [4] Brustad EM, et al. (2012) Structure-guided directed evolution of highly selective p450-based magnetic resonance imaging sensors for dopamine and serotonin. Journal of molecular biology 422(2):245-262. [5] Lee, T., Cai, L.X., Lelyveld, V.S., Hai, A., Jasanoff, A., Molecular-level functional magnetic resonance imaging of dopaminergic signaling. Science, 2014. 344(6183): p. 533-5. [6] Kundu, P., Brenowitz, N.D., Voon, V., Worbe, Y., Vértes, P.E., Inati, S.J., Saad, Z.S., Bandettini, P.A., Integrated strategy for improving functional connectivity mapping using multiecho fMRI. Proc Natl Acad Sci U S A, 2013. 110(40): p. 16187-ˇ92. [7] Cox, R., AFNI software. Online. http://afni.nimh.nih.gov.Figures