4524
EEG/MEG Source Imaging using fMRI Informed Time-variant Constraints1Center for MRI Research, Academy for Advanced Interdisciplinary Studies, Peking University, Beijing, China, 2Siemens Healthcare, MR Collaborations NE Asia, Beijing, China, 3Department of Anatomy and Cell Biology, McGill University, Montreal, QC, Canada
Synopsis
The accuracy of fMRI-constrained EEG/MEG source imaging may be degraded by potential spatial mismatches between the locations of fMRI activation and electrical source activities. To address this problem, we propose a novel fMRI informed time-variant constraint (FITC) method. Simulations were performed to compare the source estimates produced by L2-minimum norm estimation (MNE), fMRI-weighted minimum norm estimation (fMNE), FITC and depth-weighted FITC (wFITC) algorithms with various spatial mismatch conditions. In conclusion, the proposed FITC method is able to better resolve the spatial mismatch problems encountered in fMRI-constrained EEG/MEG source imaging.
Purpose
To develop a more reliable functional neuroimaging technique to achieve high-resolution spatiotemporal mapping of brain activities.Method
The forward solution of EEG/MEG can be expressed in a simple vector notation:
$$x(t)=Ls(t)+n(t)$$
where x(t) is the EEG or MEG recordings, s(t) is the unknown source strengths, L is an Nx-by-Ns gain matrix and n(t) is the noise vector.
The linear inverse operator (G) can be expressed as follows1:
$$G= RL^T (LRL^T+C)^{-1}$$
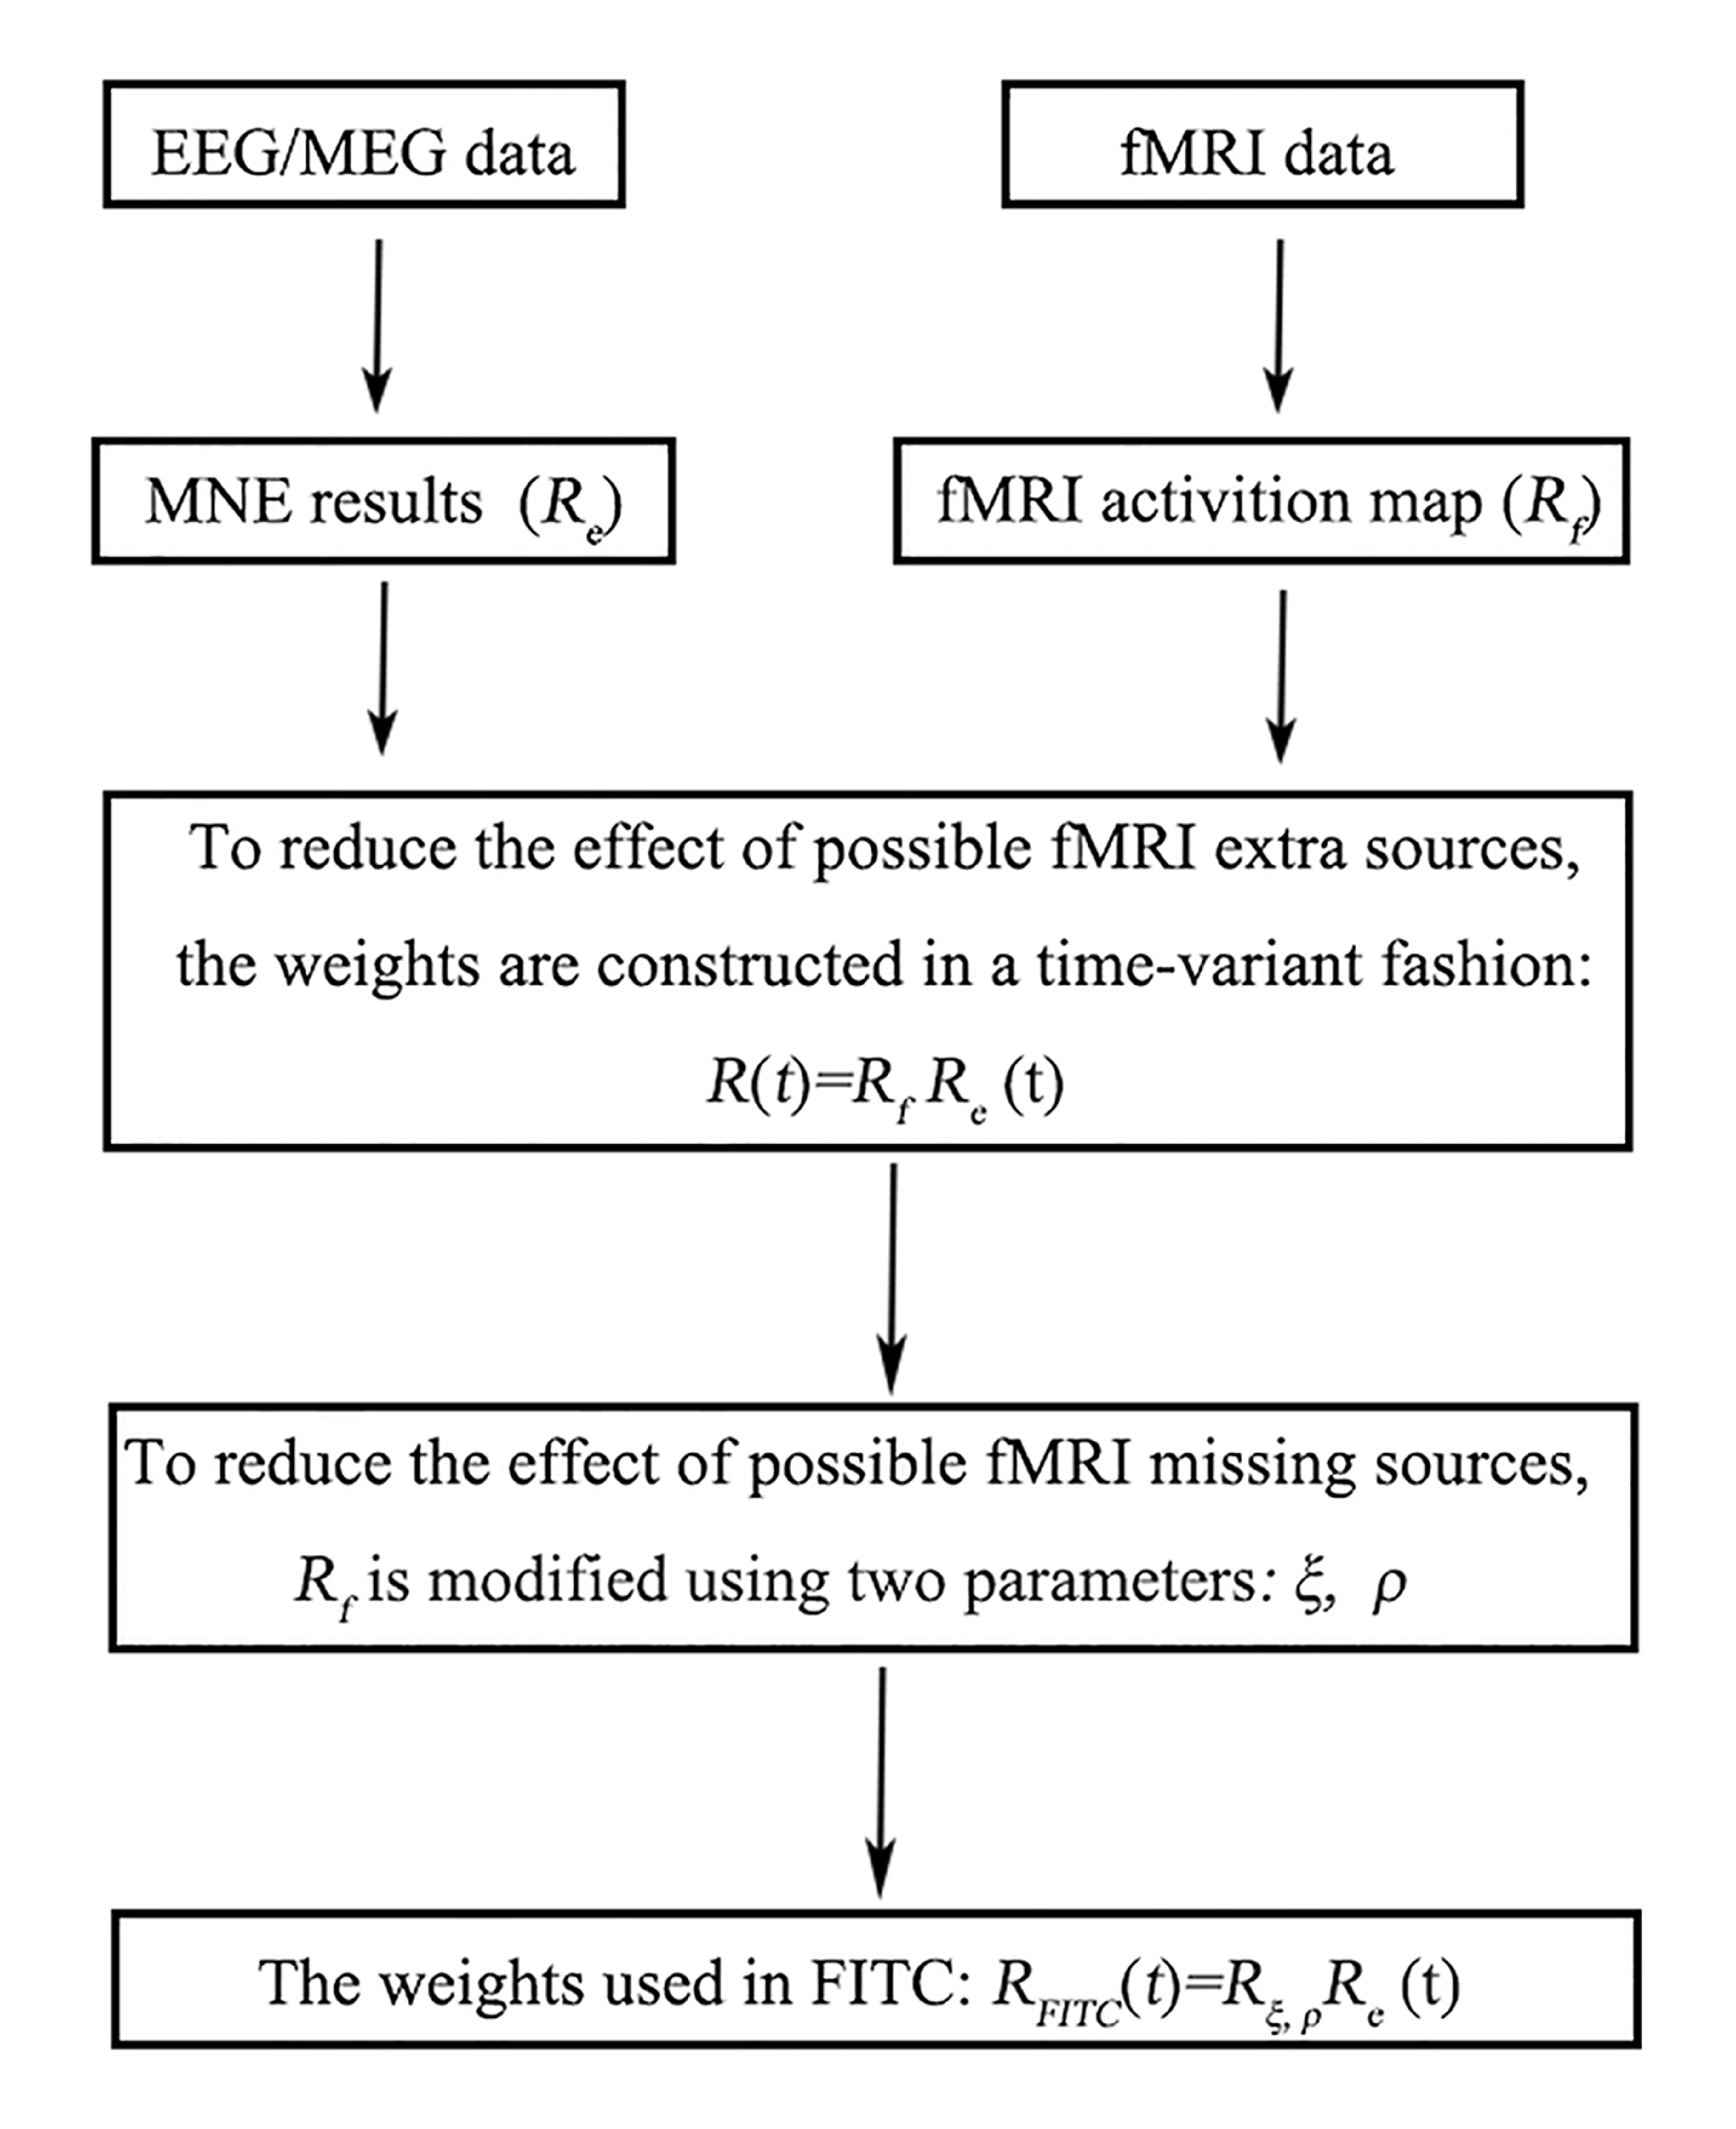
The weights in our proposed FITC method are constructed in a time-variant manner by multiplying the neural electric weights (i.e., $$$R_e$$$) and fMRI weights (i.e., $$$R_f$$$):
$$R(t)=R_f R_e (t)$$
Re can be constructed by taking its diagonal elements to be the MNE results, as follows:
$$R_e (t)=\begin{bmatrix} \hat{s}^{2}_{1}(t) & \cdots & 0\\ \vdots & \hat{s}^{2}_{i}(t) & \vdots\\ 0 & \cdots & \hat{s}^{2}_{N_{s}}(t) \end{bmatrix}$$
where $$$ŝ_i^2$$$represents the estimate source power at location i.
The fMRI weights$$$ R_f $$$will be modified in the case of fMRI missing sources:
$$R(t)=R_{ξ,ρ} R_e (t)$$
$$$R_{ξ,ρ}$$$ is constructed based on two parameters: the normalized partial area under the curve matrix (i.e.,$$$ρ_i$$$) and the crosstalk matrix (i.e.,$$$ξ_i$$$) of MNE results2.
We defined a normalized partial area under the curve matrix $$$ρ_i$$$, as follows:
$$ρ_i=\frac{∫_0^Tq_i (t)*ŝ_i^2 (t)dt}{∫_0^Tŝ_i^2 (t)dt}$$
where T is the entire time of interest, and $$$q_i (t)$$$ is an source spatial distribution mask vector at time point t and location i with suprathreshold elements set to 1 and under-threshold elements set to 0. The threshold of $$$q_i (t)$$$ is determined by a t-test between the baseline and task conditions at p < 0.05 with Bonferroni correction.
The crosstalk matrix $$$ξ_i$$$ is defined as follows:
$$ξ_i=\frac{∑_{j≠i}|(G_i L_j )|^2}{|(G_i L_i )|^2}$$
where $$$G_i$$$ is the ith row of G, and $$$L_i$$$ is the ith column of L.
$$$ρ_{ave }$$$ and $$$ξ_{ave }$$$ are the averages of $$$ρ_i$$$ and $$$ξ_i$$$ over the intersection areas of the real fMRI activation regions and significant EEG/MEG response regions, respectively. Locations that are in significant EEG/MEG response regions but not in real fMRI activation regions and meet the conditions that $$$ρ_i$$$ is exceeding $$$ρ_{ave }$$$ and $$$ξ_i$$$ is less than $$$ξ_{ave }$$$ will be defined as the extended activation regions. We set the diagonal elements of $$$R_{ξ,ρ}$$$ corresponding to real fMRI activation regions and the extended activation regions to 1; any other locations we$$$R_{ξ,ρ}$$$ set to 0.1. The off-diagonal elements of $$$R_{ξ,ρ}$$$ were set to 0. The calculating process of FITC is outlined in Fig. 1
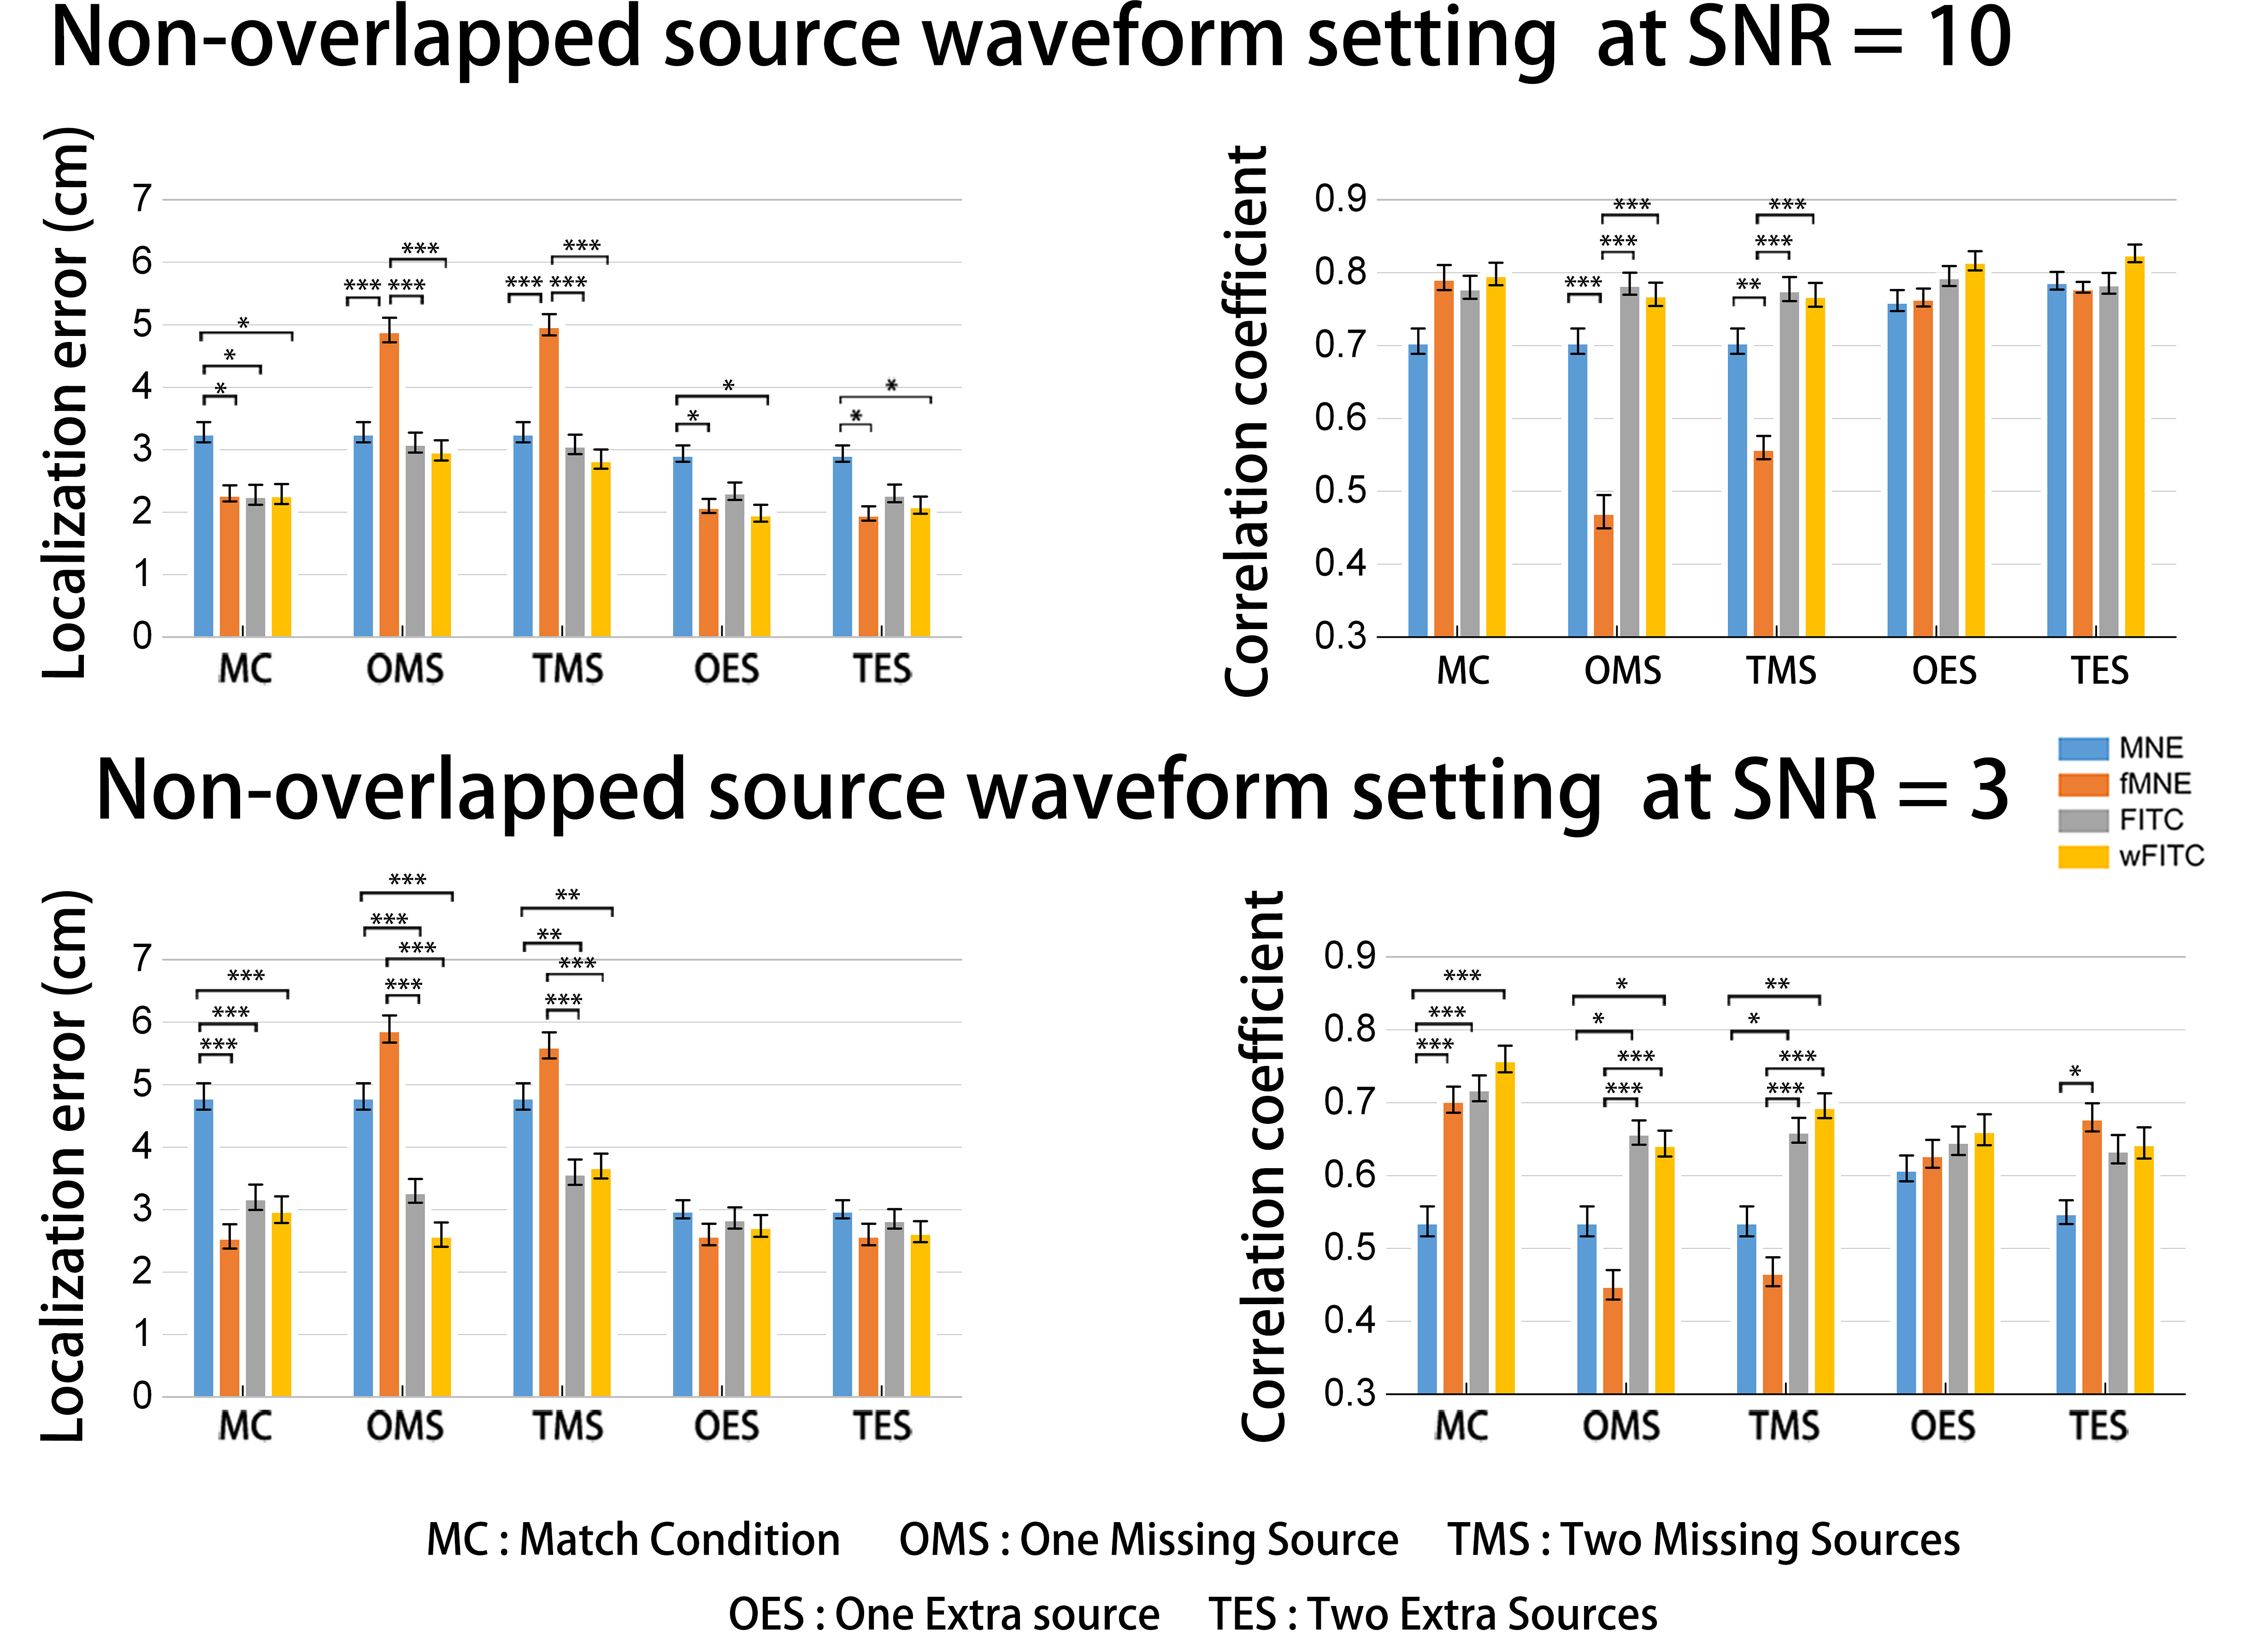
Simulations were applied to assess the performance of MNE, fMNE, FITC and depth-weighted FITC (wFITC). We simulated five conditions that are typically encountered in human experiments: match, fMRI missing sources and fMRI extra sources conditions. The EEG data sets were simulated with two different SNRs (3 and 10), and the simulations were repeated 100 times for each condition. When comparing different algorithms, both temporal and spatial accuracies were evaluated. Temporal accuracy is defined as the correlation coefficient between the estimated source waveforms and preset source waveforms . The localized error was defined as the distance between the real dipole location and the most active estimated source location at the time of peak latency. One-way Analysis of Variation (ANOVA) with Tukey’s post-hoc comparisons was applied to test the performance of these four methods.
Results
When the SNR of the simulated EEG signals is 10, as shown in the 1st row of Fig. 2, fMNE, FITC and wFITC displayed an increase in temporal correlation relative to the EEG-alone MNE solution. When there were fMRI missing sources, fMNE suffered the lowest temporal correlation and spatial accuracy among these four algorithms. MNE, FITC and wFITC displayed a significant increase in temporal correlation and spatial accuracy compared with fMNE. When there are one or two fMRI extra source, FITC and wFITC achieved higher temporal correlation than MNE and fMNE. fMNE and wFITC displayed a significant increase in spatial accuracy relative to MNE. The temporal and spatial accuracies of lower SNR was displayed in the 2nd row of Fig. 2. All four method displayed lower temporal and spatial accuracies than under higher SNR.Discussion
In this study, we proposed FITC algorithm to solve the mismatch problem between the locations of neural activities and fMRI activation regions. To highlight the fMRI activation regions with neural activities, the weights were constructed by multiplying the estimated source power and the fMRI weights. To weaken the impact of the fMRI missing sources, the fMRI weights were modified by the following two parameters: the crosstalk effect and the normalized partial area under curve. Locations with lower crosstalk values and larger ρ values might represent the fMRI missing sources.Acknowledgements
We thank the National Center for Protein Sciences at Peking University in Beijing, China for their assistance with MRI data acquisition and data analyses.References
1. Liu AK, Belliveau JW, Dale AM. Spatiotemporal imaging of human brain activity using functional MRI constrained magnetoencephalography data: Monte Carlo simulations. Proceedings of the National Academy of Sciences, 1998, 95: 8945-8950.
2. Liu AK, Dale AM, Belliveau JW. Monte Carlo simulation studies of EEG and MEG localization accuracy. Human Brain Mapping, 2002, 16:47-62.
Figures