4522
Correlation between the Scaling Exponent of the Power Spectral Density Function of Local Field Potentials and the BOLD signal1Department of Biomedical Engineering, Emory University/Georgia Institute of Technology, Atlanta, GA, United States
Synopsis
In this abstract we proposed a new method to assess whether changes in the power spectral density (PSD) function of local field potential (LFP) are correlated with the BOLD signal using a single parameter that describes the relative distribution of activity across frequencies (the power scale exponent). The correlation maps obtained using the scaling exponent exhibit strong, localized correlations at the locations near the electrodes in some scans, similar to those obtained from the LFP power time course method.
Purpose
Recent studies have examined the relationship between the blood-oxygenation-level dependent (BOLD) signal in resting-state fMRI and power modulations of the local field potential (LFP)1. The LFP power time courses in several frequency bands have been shown to correlate with the BOLD signal under various conditions2,3. Here we introduce a new method to assess changes in the power spectral density (PSD) function, which uses a power law model to fit the PSD function on a sliding window basis and provides a single parameter to characterize the frequency distribution of the LFPs at a given time. We hypothesized that, assuming the PSD function follows the power law distribution P ~ 1/fβ, the scaling exponent β can reflect the changes of spectral distribution as a function of time. Thus, whether the scaling exponent is well correlated with BOLD signal is worth investigating.Method
Experiments: Resting state-fMRI scans and LFP recordings were acquired simultaneously on 7 Sprague-Dawley rats, with 12 scans at Isoflurane levels ranging from 1.2% to 1.8%. Single slice gradient echo EPI scans were performed on a 9.4T small animal MRI system (Bruker) with scan parameters: TR/TE = 500/15ms, voxel size = 0.3*0.3*2mm, matrix size=64*64. The glass recording electrodes were placed on the bilateral primary somatosensory areas and the LFPs were recorded (12KHz). BOLD signal: Motion-correction, spatial smoothing, bandpass filtering to 0.01~0.1Hz, global signal and linear trend regression were performed. LFP preprocessing: Each TR segment containing gradient artifact was clustered using K-means clustering. Within each cluster, the averaged artifact template is subtracted, yielding a denoised time course with residual artifacts present in a relatively short window (20ms). Those points were discarded and extrapolated from the neighboring 0.2s data points at each end. The LFP time courses were low pass filtered to 200Hz before further analysis. Scaling exponent: The PSD function was estimated using Welch’s method (4 segments, 50% overlap) within a 3.33 second sliding window, and then transformed into log-log axes, where the PSD function is linearly proportional to frequency and the scaling exponent equals to the slope. The scaling exponent time course was obtained by moving the window 0.5 second every time and then bandpass filtered to 0.01~0.1Hz. The broadband power time (0~100Hz) courses were calculated using the method described in (Pan et al. 2013)1. Then the correlations with BOLD signal for both methods were calculated and compared.Results
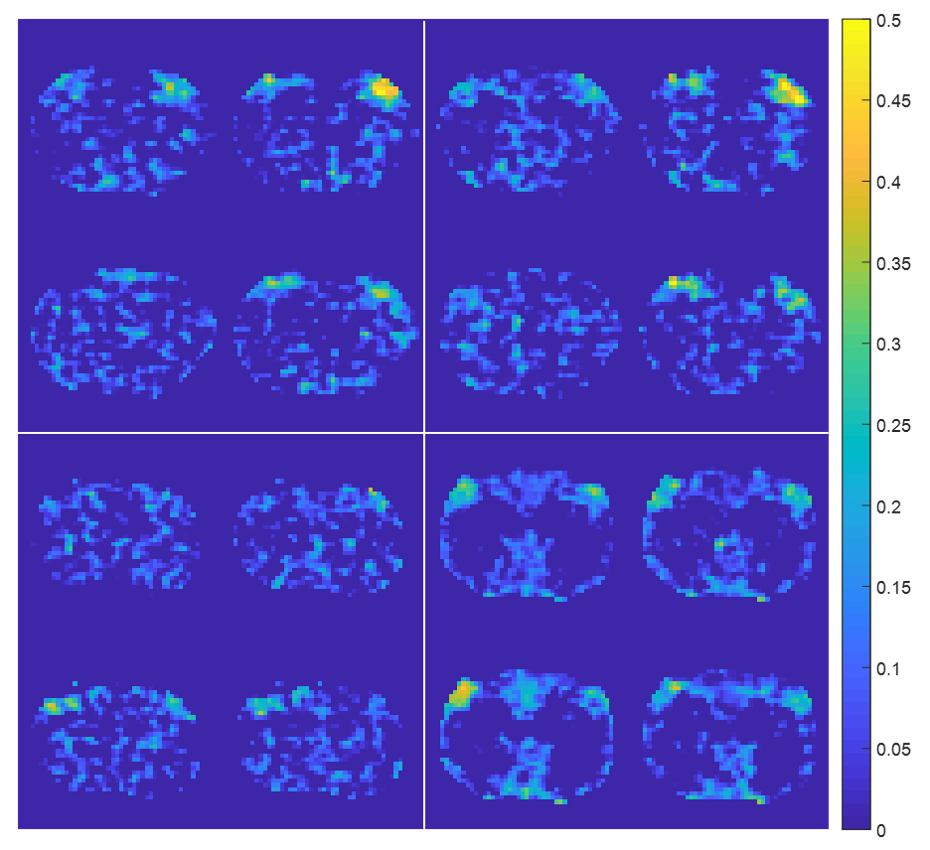
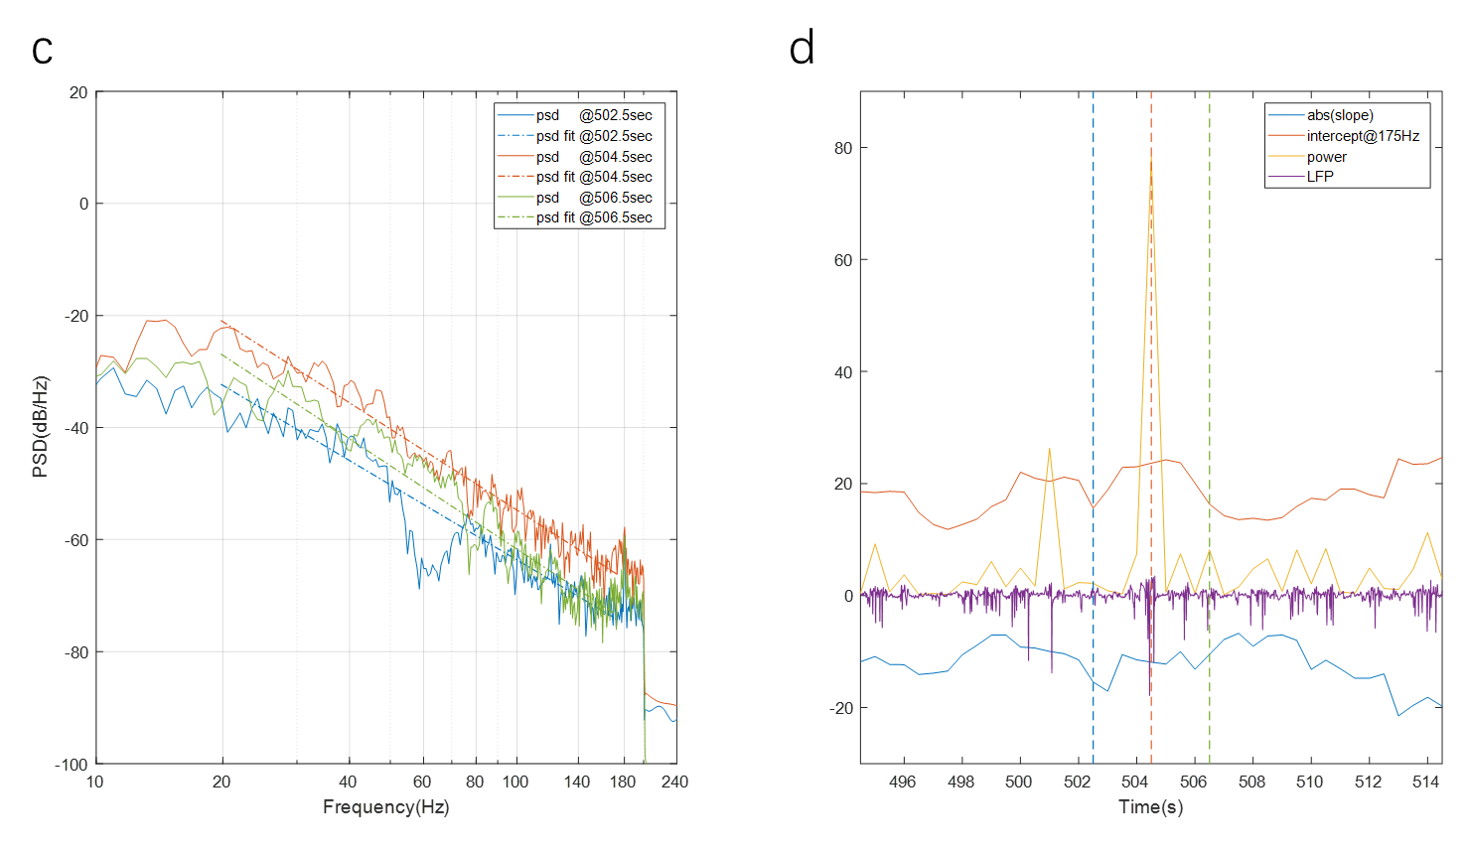
Figure 1 shows that the PSD function appears linear in a log-log graph at a wide range of frequencies from 20Hz to 175 Hz, and the absolute value of slope tends to increase when the burst firing occurs, as expected. Shown in Figure 2, in some scans localized correlation hot spots were present at the locations near the electrodes, similar to those obtained with LFP power correlation.Discussion
Despite the slope more or less reflecting the changes of power spectra, especially in the stereotypical cases where the slope increases if burst firing occurs in the window and vice versa, the correlation with BOLD time courses is generally not as strong as for LFP power. We found that in the case where the power time course has a large peak, the scaling exponent usually does not rise as much (Figure 3). In these cases, the increase of broadband power is due to the increase of intercept instead of slope in the PSD function. Although this prevents the slope time course from having strong correlation with BOLD signal, it also implies that there could be more than one mode of burst firing: some mainly change the slope while others mainly change the intercept. We plan to investigate the relationship between the slope and the BOLD fluctuations further under conditions that do not exhibit burst-suppression activity patterns, such as low isoflurane doses or awake rats. We also plan to further refine the analysis method and examine its dependence upon parameters such as window length, which determines the frequency range that can be examined.Conclusion
We proposed a new method to assess the changes of the LFP power spectra distribution using a single parameter, and correlated its time course with BOLD signal. In some scans, localized correlation between the scaling exponent and the BOLD signal was observed, similar in size and location to LFP power correlation but typically weaker. Further investigation is required to understand the relationship between the LFP PSD function and BOLD signal.Acknowledgements
Funding sources: NIH 1 R01NS078095-01, BRAIN initiative and NSF INSPIRE. The authors would like to thank Chinese Scholarship Council (CSC) for financial support.References
1. Pan WJ, Thompson G, Magnuson M, Majeed W, Jaeger D, Keilholz S. Broadband local field potentials correlate with spontaneous fluctuations in functional magnetic resonance imaging signals in the rat somatosensory cortex under isoflurane anesthesia. Brain connectivity. 2011;1(2):119-31.
2. Shmuel A, Leopold DA. Neuronal correlates of spontaneous fluctuations in fMRI signals in monkey visual cortex: implications for functional connectivity at rest. Human brain mapping. 2008;29(7):751-761.
3.Lu H, Zuo Y, Gu H, et al. Synchronized delta oscillations correlate with the resting-state functional MRI signal. Proceedings of the National Academy of Sciences. 2007;104(46): 18265-18269.
Figures