4521
Improved cardioballistic artifact waveform for artifact correction with direct cardiac cycle detection from EEG-fMRI data1Laureate Institute for Brain Research, Tulsa, OK, United States, 2University of Oklahoma-Tulsa, Tulsa, OK, United States, 3Stephenson School of Biomedical Engineering, University of Oklahoma, Norman, OK, United States
Synopsis
In simultaneous EEG-fMRI, cardioballistic (BCG) artifact removal algorithms require the detection of artifact occurrence time to form subtraction template for artifact correction. The artifact occurrence time can be estimated by an average delay following the R-peak of electrocardiogram (ECG) recording, or directly measured from the BCG component in the EEG data. Here we compared the BCG artifact waveform evaluated by artifact cycles measured from the BCG and ECG data. We found that direct BCG cycle detection from EEG data provides better BCG waveform for the artifact correction and eliminates the need for independent ECG recording.
Introduction
In simultaneous EEG-fMRI, electrocardiogram (ECG) is independently recorded to detect the occurrence time of cardioballistic (BCG) artifact in the EEG data to form BCG subtraction template for artifact removal.1,2 By detecting the R-peak of the ECG recording, the occurrence time of the artifact is taken at an average delay of 210ms following the R-peak.1,2 Recently a peak detection algorithm was proposed to detect the BCG artifact occurrence directly from the EEG data,3 and shown to achieve a high detection accuracy on a large EEG-fMRI dataset without using the ECG waveform. Since an effective BCG artifact removal relies on an accurate artifact template, here we examined the BCG artifact waveform (AW) segmented by different artifact cycles measured either from independent ECG recording or directly from the EEG data, and compared the performance of both derived AW for the BCG artifact correction.Methods
The simultaneous EEG-fMRI was conducted on a GE MR750 3T MRI with an 8-channel head coil and 32ch MR-compatible EEG system (Brain Products GmbH). One channel was designated for the ECG recording. For EEG preprocessing, MRI artifacts were removed. Independent component analysis was used to extract the BCG components (ICbcg), followed by the automatic ICbcg identification with the modified version of the algorithm described in [4]. The peak-to-background contrast (C) for all identified ICbcg was calculated in a 4s time window. The ICbcg with the highest contrast was used for the BCG artifact detection.
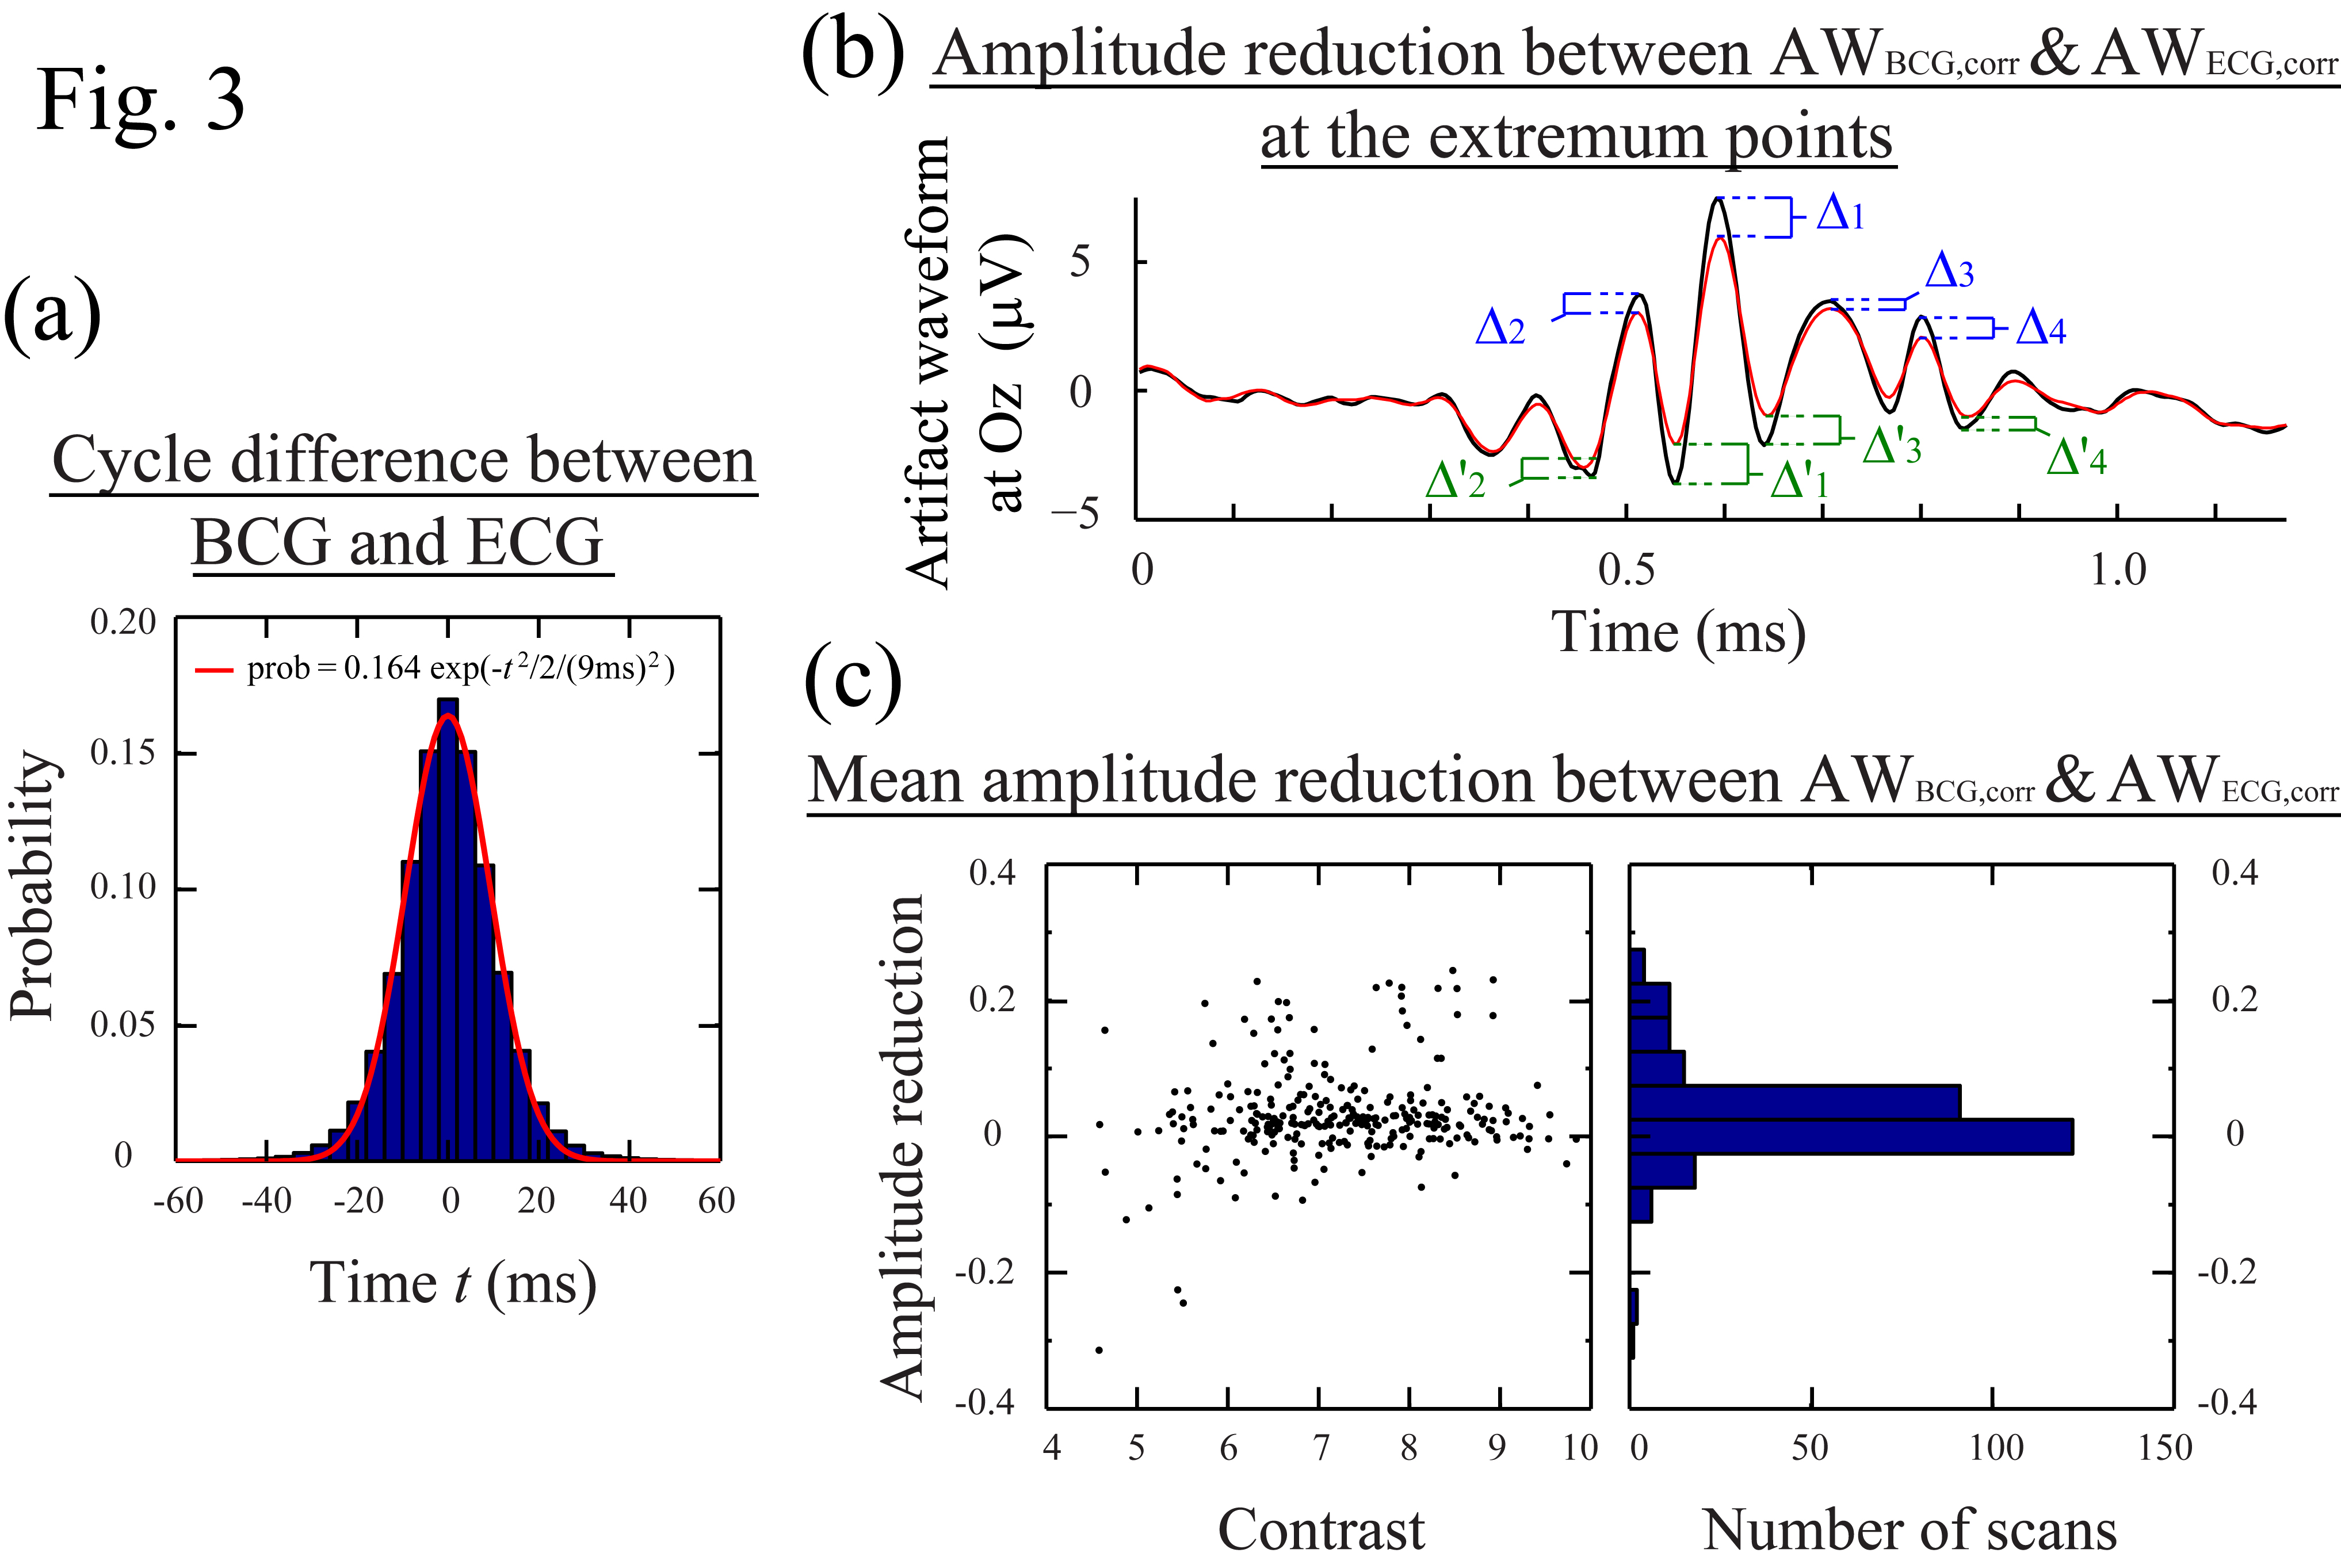
The ECG cycles were detected by the algorithm fmrib_qrsdetect.m implemented in EEGLAB (Fig. 1(a)).2,5-6 The ICbcg cycles were detected by the multi-scale peak detection algorithm (Fig. 1(b)).3 The benchmark peak timings of ECG and BCG were acquired in reference to both the ICbcg and ECG waveforms by semi-automatic search with subsequent manual inspection. To calculate the BCG AW, the EEG data was 1Hz high-pass filtered, segmented into equal-sized segments centered at the artifact occurrences, and averaged over the segments (Fig. 2). For each scan, we evaluated 4 AWs (AWBCG,corr, AWBCG, AWECG,corr, AWECG) based on the benchmark and detected artifact cycles obtained from the BCG and ECG measurements (Fig. 2). The AWs were then aligned to each other by maximizing their correlation. For comparison, the similarity between AWBCG,corr and AWBCG (or AWECG,corr and AWECG) was measured by the normalized root-mean-square (RMS) deviation. The mean amplitude reduction at the extremum points was used to measure the error of the AW (Fig. 3(b)). Comparisons were made in 281 resting scans from 48 subjects. Each scan lasted 526s. The first 6s and the time segments with unrecognizable ECG or BCG waveforms caused by subject motions were removed from the data analyses, giving a data length of 40.22 hours.Results
Figs.1 and 2 show the artifact cycles detected from the ECG and BCG data and the resulting BCG AW. It is noted that the ECG cycles detected by fmrib_qrsdetect.m are often not at the peak locations. More importantly, the detected cycles do not always consistently fall at a fixed position relative to the R-peak locations. This wavering phenomenon not only causes ambiguities in correcting the cycles when there are incorrect detections, it also smooths out the resulting BCG AW (Fig. 2: (S2)-(S3)). Since the detections of the BCG artifact occurrence using the ICbcg and ECG signal are separate measurements, it is important to understand the cycle difference measured by these two methods and the effect on the resulting BCG AW. Fig. 3(a) plots the distribution of the difference between the cycle periods obtained from the BCG and ECG data, showing good agreement with the maximum variation range of 40ms between the BCG and ECG events found in [1]. It also quantitatively demonstrates that 99% of the cycle differences lie within the 32ms range. Fig. 3(b) illustrates the amplitude reduction in the AW due to imprecise cycle detection. Fig. 3(c) plots the normalized mean amplitude reduction against the contrast (C) for the selected ICbcg. Provided that the ICbcg contrast C>6, the AW calculated with the cycles detected from the ICbcg are usually sharper (more positive in amplitude reduction) than those calculated from the ECG data. The RMS deviation between AWBCG,corr and AWBCG (AWECG,corr and AWECG) is plotted against the detection error (1-F1) in Fig. 4. The BCG cycle detection by the multi-scale peak detection algorithm gives significantly better results.Conclusion
We found that direct BCG cycle detection not only eliminates the need for ECG in simultaneous EEG-fMRI, together with the multi-scale peak detection algorithm, it generally provides better artifact waveform for BCG artifact correction when the contrast of the BCG component is sufficiently high.Acknowledgements
This work is supported by DOD award W81XWH-12-1-0607.References
1. Allen PJ, Polizzi G, Krakow K, et al. Identification of EEG events in the MR scanner: the problem of pulse artifact and a method for its subtraction. NeuroImage. 1998;8:229-239.
2. Niazy RK, Beckmann CF, Iannetti GD, et al. Removal of fMRI environment artifacts from EEG data using optimal basis sets. NeuroImage. 2005;28:720-737.
3. Wong CK, Luo Q, Zotev V et al. Multi-scale peak detection method for an automatic cardioballistic artifact period determination directly from EEG-fMRI data. Proc. Intl. Soc. Mag. Reson. Med. 2017; 25:5414.
4. Wong CK, Zotev V, Misaki M, et al. An automatic EEG-assisted retrospective motion correction for fMRI (aE-REMCOR). NeuroImage. 2016;129:133-147.
5. Christov II. Real time electrocardiogram QRS detection using combined adaptive threshold. BioMed. Eng. Online. 2004;3:28.
6. Delorme A. and Makeig S. EEGLAB: an open source toolbox for analysis of single-trial EEG dynamics (pdf, 0.7MB). J. Neuroscience Methods. 2004;134:9-21.
Figures
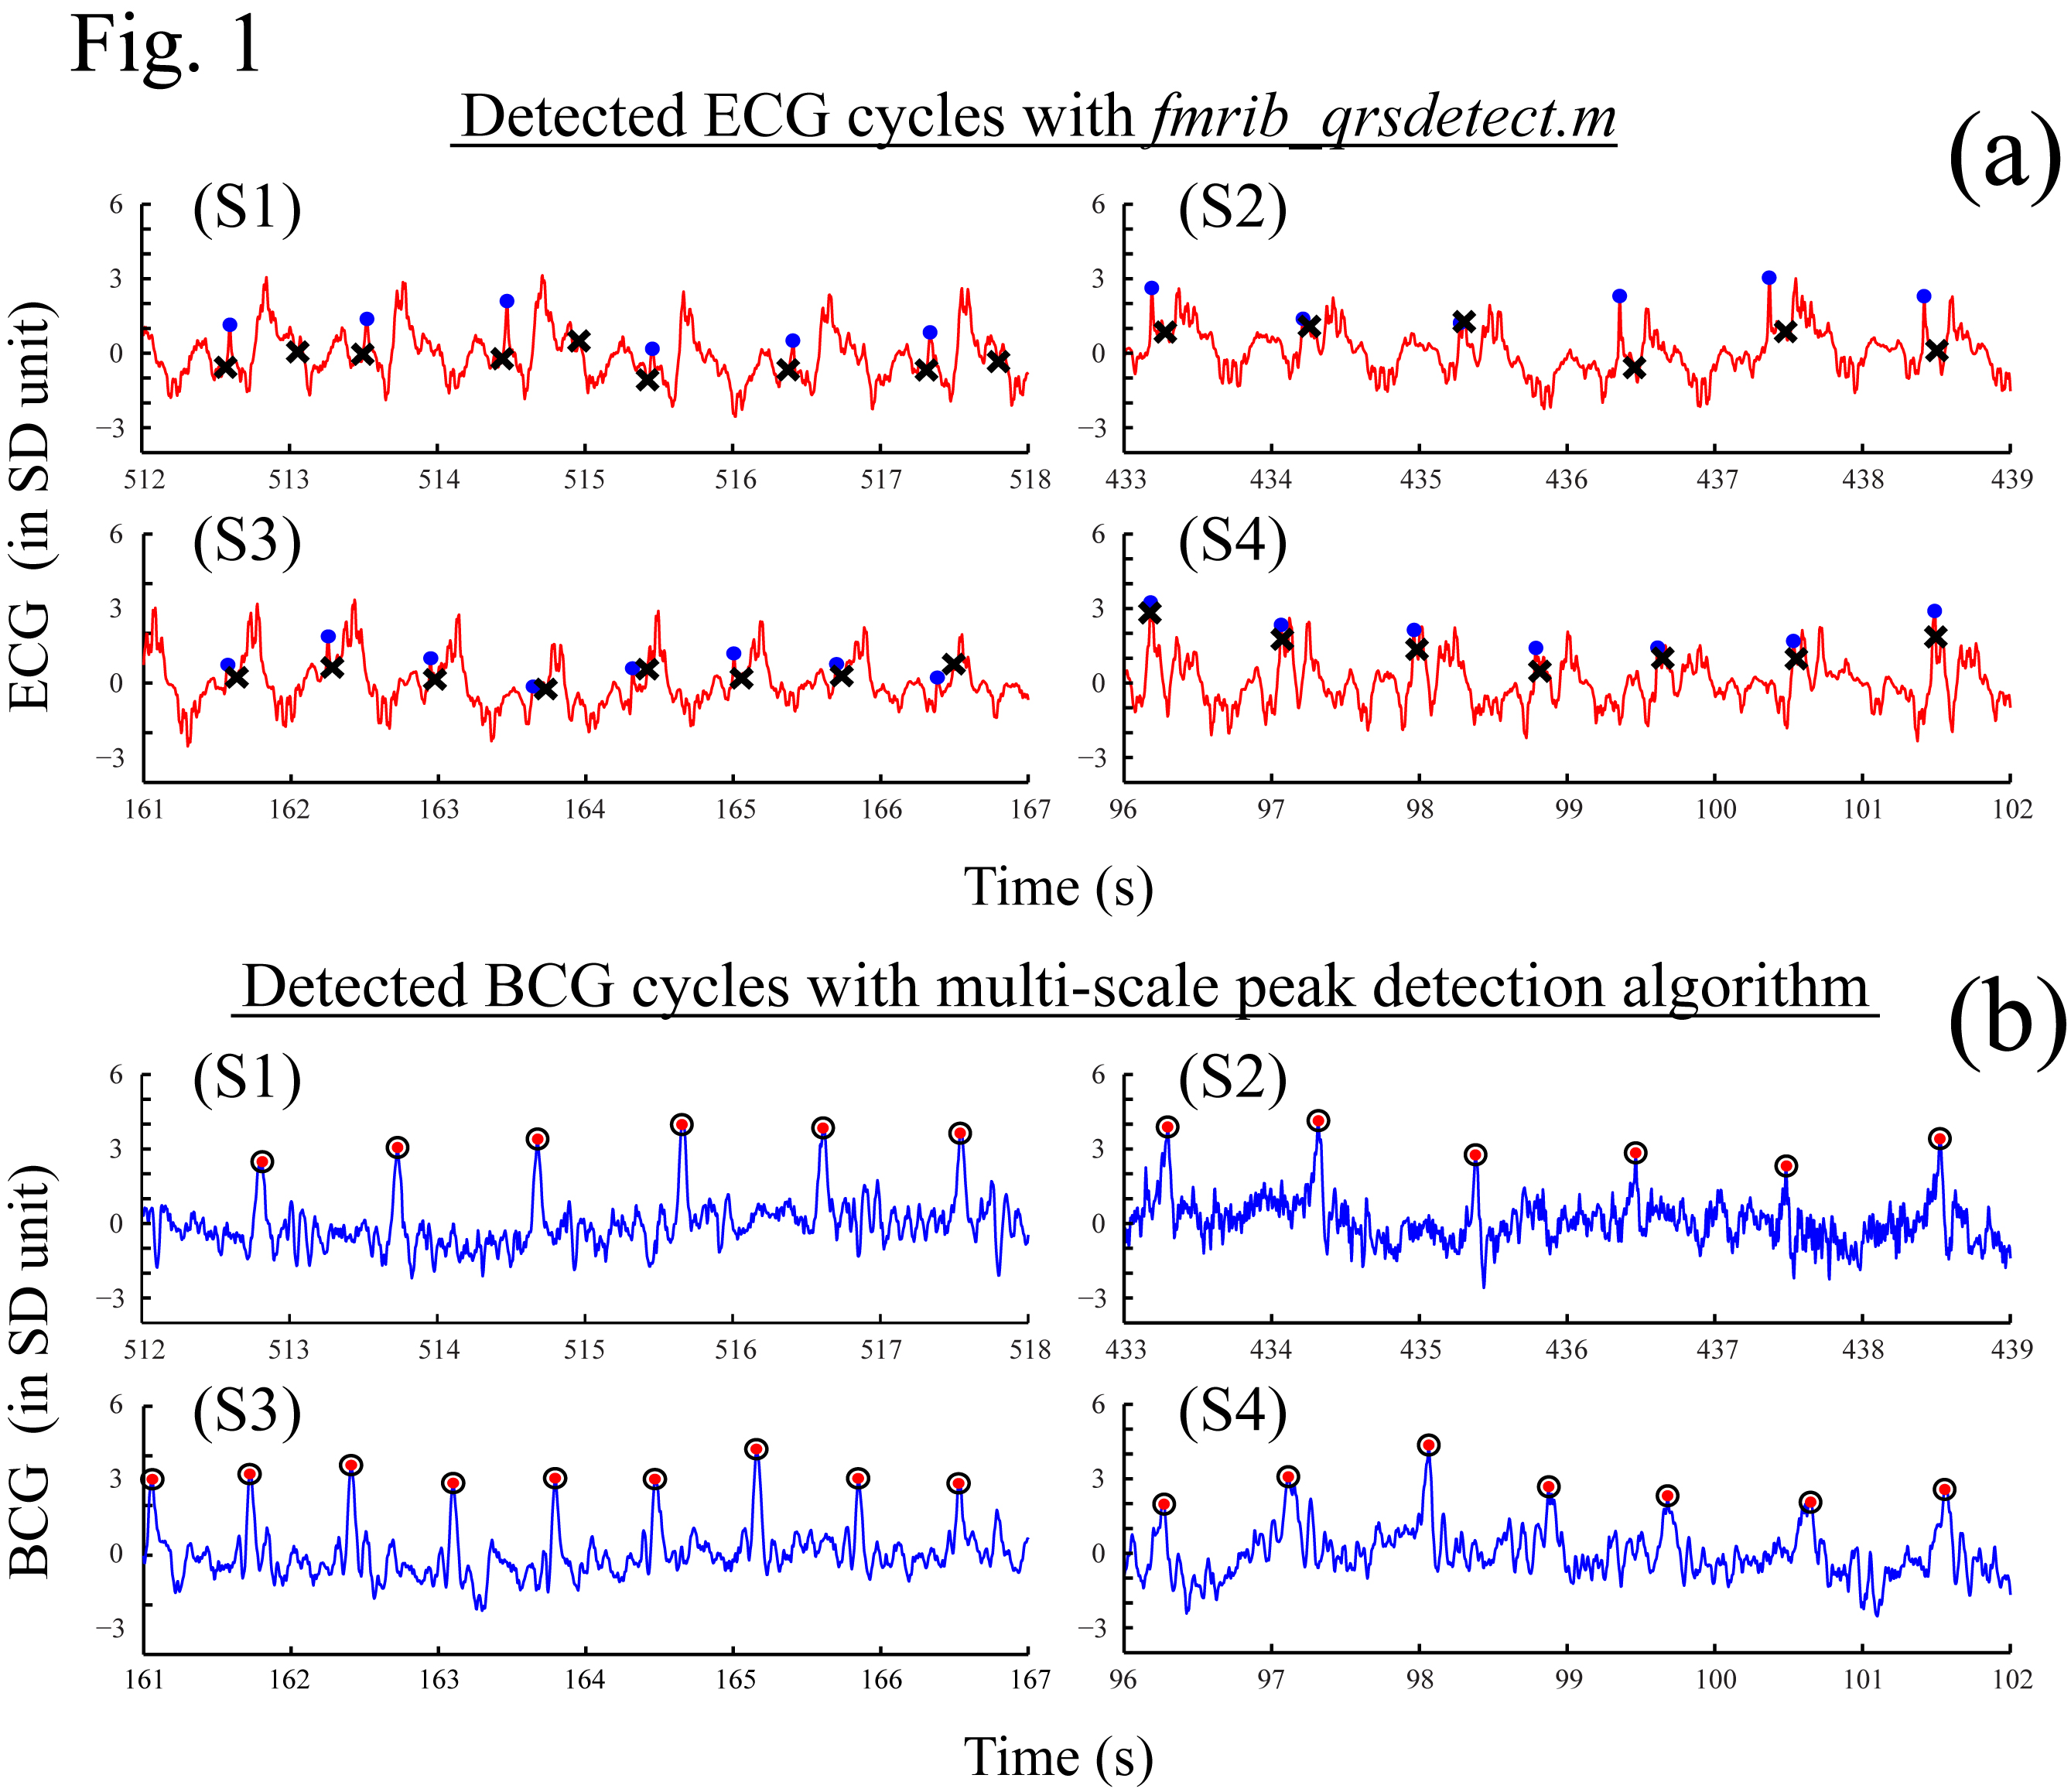
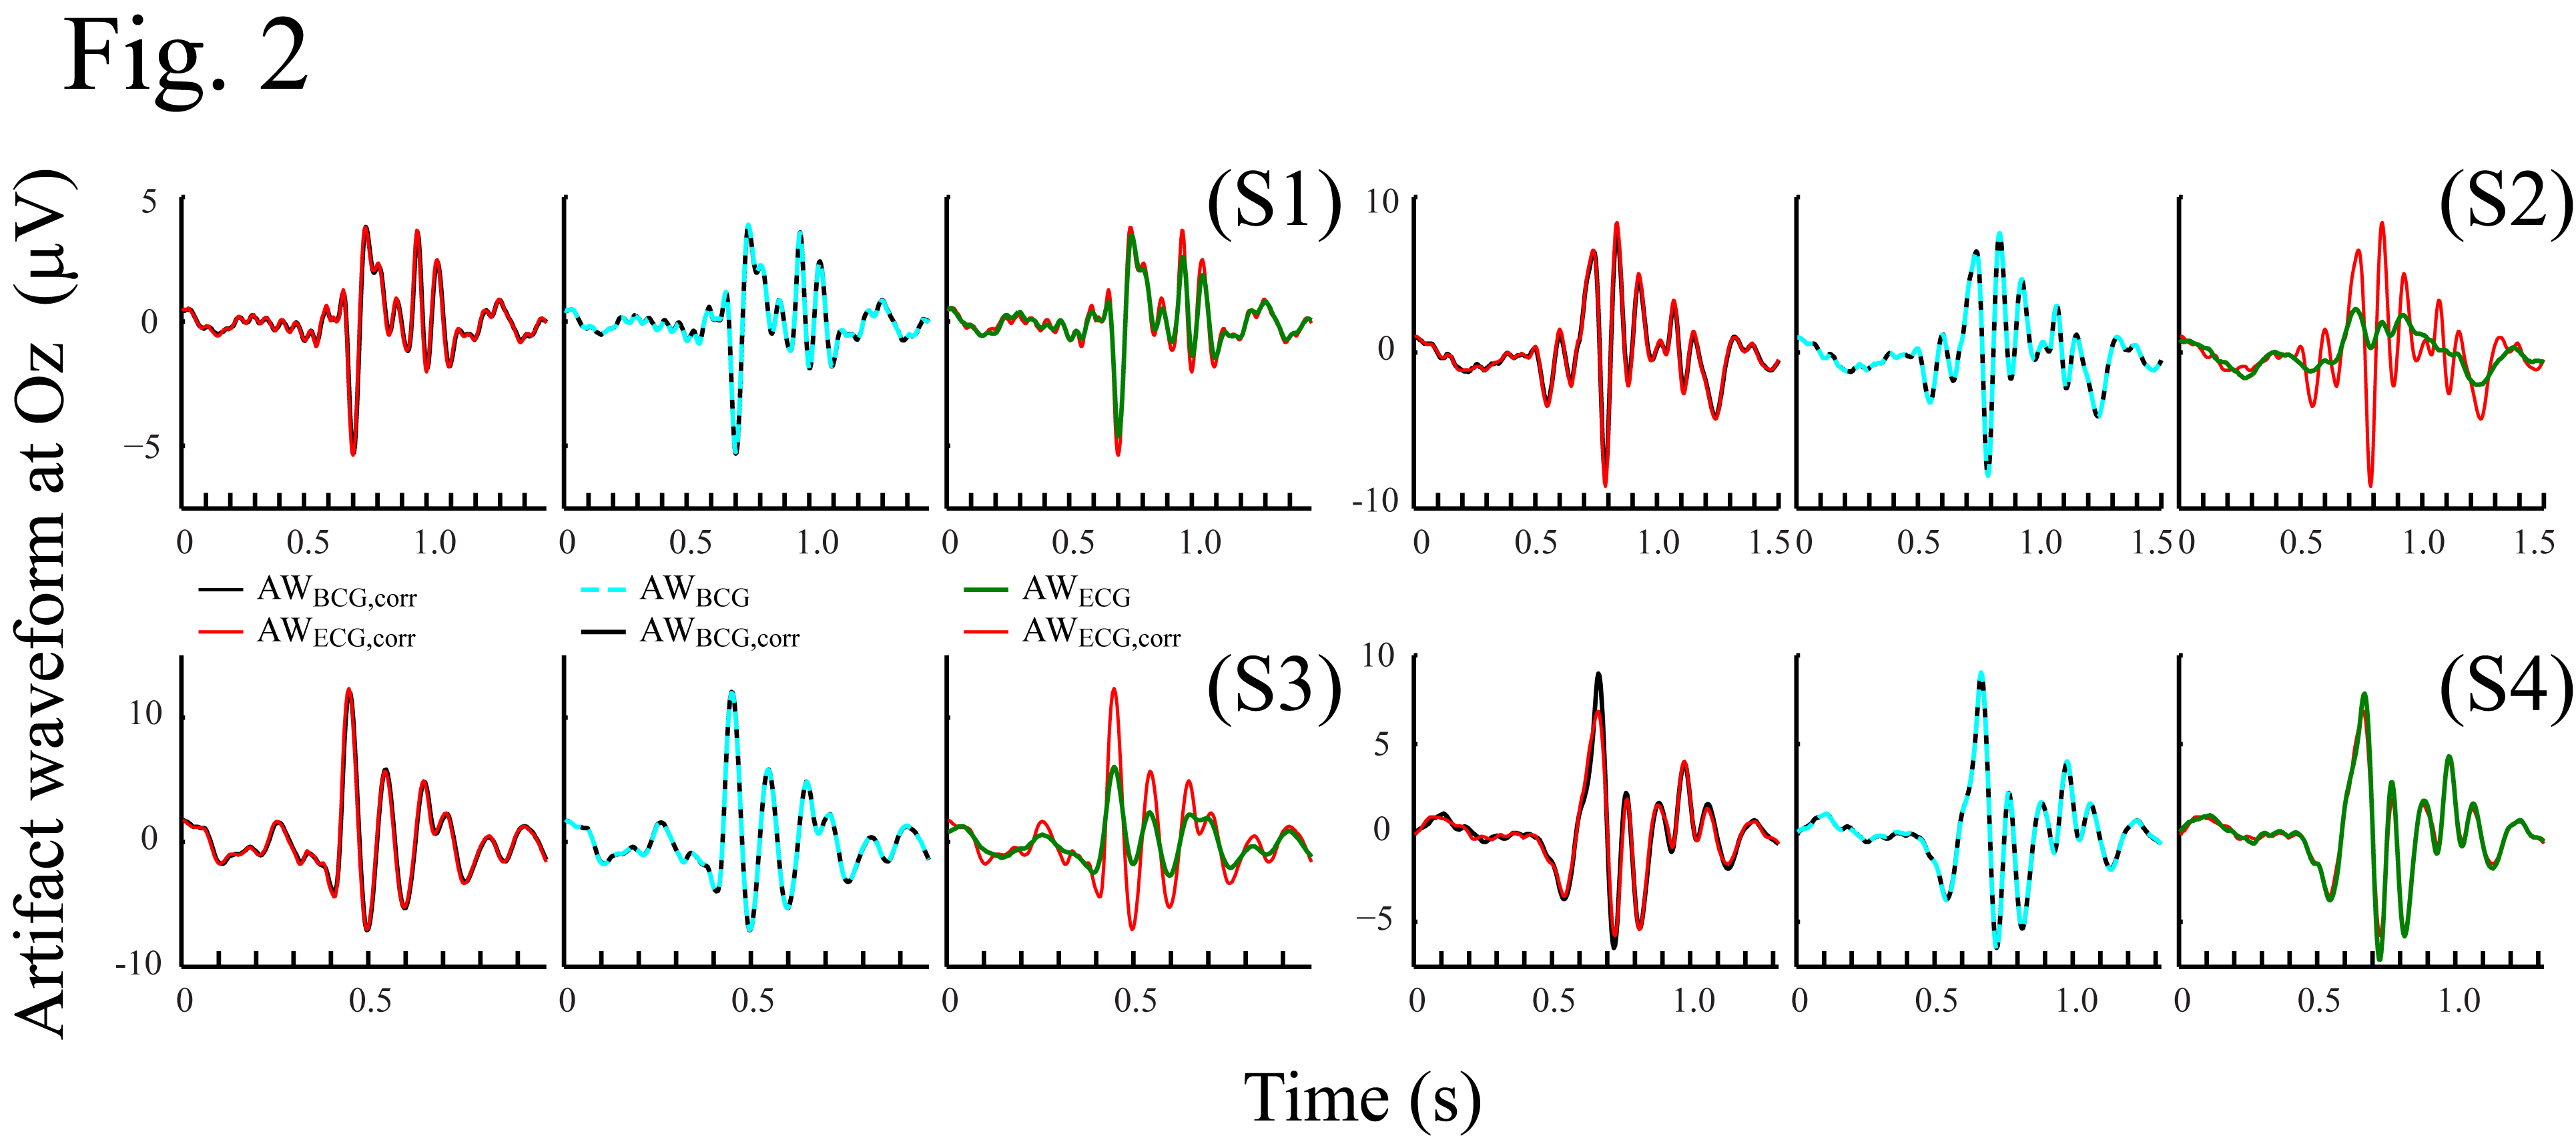
Fig. 2: BCG artifact waveform (AW) calculated from EEG data segmented using different measured artifact cycles. The same four subjects in Fig. 1 were used. The AW was calculated at electrode Oz. Black line (AWBCG,corr): AW segmented by the benchmark artifact cycles measured from ICbcg; red line (AWECG,corr): AW segmented by the benchmark artifact cycles measured from ECG; dotted cyan line (AWBCG): AW segmented by the artifact cycles detected from ICbcg with multi-scale peak detection algorithm;3 green line (AWECG): AW segmented by the artifact cycles detected from ECG with fmrib_qrsdetect.m.2,5,6