4520
Multimodal Correlation and Connectivity Analysis on Simultaneously Recorded MR-PET data1Institute of Neuroscience and Medicine (INM-4), Forschungszentrum Jülich GmbH, Jülich, Germany, 2Department of Psychiatry, Psychotherapy and Psychosomatics, RWTH Aachen University, Aachen, Germany, 3Forschungszentrum Juelich GmbH, Institute of Neuroscience and Medicine - 4, Jülich, Germany, 4Institute of Neuroscience and Medicine 4 (INM4), Forschungszentrum Jülich GmbH, Jülich, Germany, 5Department of Nuclear Medicine, RWTH Aachen University, Aachen, Germany, 6Institute of Neuroscience and Medicine 11, Forschungszentrum Jülich GmbH, Jülich, Germany, 7Department of Neurology, RWTH Aachen University, Aachen, Germany, 8Monash Biomedical Imaging, School of Psychological Sciences, Monash University, Melbourne, Australia
Synopsis
On a simultaneously recorded resting state MR-PET data, the functional connectivity metrics (namely ReHo, fALFF, and DC) from fMRI and the glucose metabolism from FDG – PET are calculated and correlated in the default mode network (DMN) regions of the brain. Results shows high connectivity of the DMN hubs is coupled with a high glucose consumption. Further investigations in patients are necessary to explore the potential of simultaneous imaging as a biomarker for disease staging, treatment response and monitoring
Introduction
Simultaneous measurements of magnetic resonance imaging (MRI) and positron emission tomography (PET) have become possible due to recent developments in magnetic field insensitive PET-detectors. Functions of the human brain can be explored by using diverse and complimentary information provided by simultaneous MR-PET imaging. The functional relationships between near and distant brain regions can be studied and characterised using the functional connectivity (FC) measures 1. Alterations in resting state (RS) functional MRI (fMRI) connectivity measures were already reported in various neurological disorders 2,3. The Default mode network (DMN), a most prominent RS network is found to be vulnerable to many neurological disorders 4,5. Exploration of the relationship between fMRI connectivity measures and glucose metabolism on DMN regions may shed more light in to understanding the RS brain’s functional mechanism and rationale behind neurological disorders. Involving healthy male subjects we aim to investigate the relationship between glucose metabolism accessed by 2-Deoxy-2-[18F]fluoro-D-glucose PET (FDG - PET) imaging and fMRI connectivity measures (namely regional homogeneity (ReHo 6), fractional amplitude of low frequency fluctuations (fALFF 7) as well as degree of centrality (DC 8)).Methods
The simultaneous MR-PET data were recorded concurrently in a single scanning session using 3T MR-BrainPET scanner system (Siemens, Erlangen, Germany). The eyes closed resting state MR-PET data were recorded from 11 healthy male volunteers (age 28.6 ± 3.4 years).
PET data acquisition
FDG was injected (200 ± 30 MBq) while the volunteer was lying in the MR-BrainPET scanner. PET data acquisition in list mode started simultaneously with the injection of the FDG tracer. The PET data recorded from 30 to 60 min were iteratively reconstructed into 6 frames (5 minutes each) with 153 slices (voxel size 1.25 x 1.25 x 1.25 mm3, matrix size 256 x 256). The PET data reconstruction incorporates corrections for attenuation 9, random and scattered coincidences, dead time and pile up.
MR data acquisition
The following MR sequences were included in the MR data acquisition protocol,
- magnetisation-prepared rapid acquisition gradient-echo (MP-RAGE) sequence (T1 weighted anatomical imaging sequence, repetition time (TR) = 2250 ms, echo time (TE) = 3.03 ms, voxel size = 1 x 1 x 1 mm3)
- echo planar imaging (T2*-weighted EPI sequence , TR = 2200 ms, TE = 30 ms, voxel size = 3.125 x 3.125 x 3.0 mm3, FA = 80°, slices = 36, volumes = 165).
Data Analysis
PET data
Using PMOD (PMOD Technologies LLC, Zürich, Switzerland, Version 3.5) the reconstructed PET images were converted to standard uptake value (SUV) maps accounting for the injected dose and body weight of each subject.
MR data
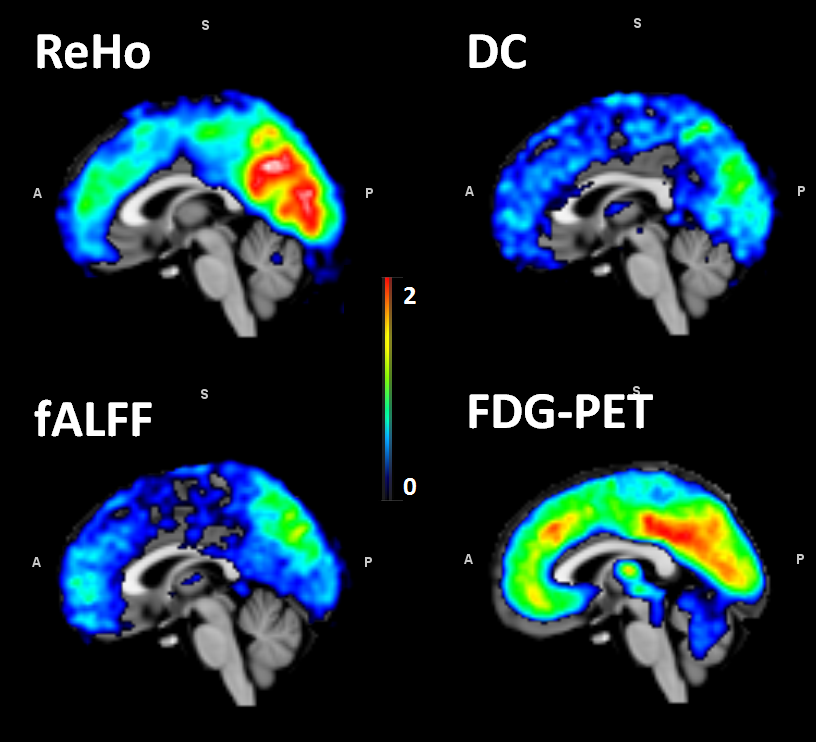
Functional connectivity measures (ReHo, DC, ALFF, fALFF) were calculated using SPM12 (http://www.fil.ion.ucl.ac.uk/spm/) and DPABI 10. The preprocessing steps carried out on fMRI volumes before calculating the functional connectivity measures include removal of the first 10 volumes of the total acquisition, slice time correction and nuisance covariates regression (NCR) and temporal filtering (only for ReHo and DC) between 0.01 and 0.08 Hz. The functional connectivity measures for each subject were calculated in the subject’s native image space. ReHo connectivity measure was calculated over a cluster of 27 neighbouring voxels 11 using Kendall’s coefficient of concordance (KCC) as homogeneity metric. The DC measure was computed with a Pearson correlation cutoff of 0.25 (p = 0.001).
Correlation analysis
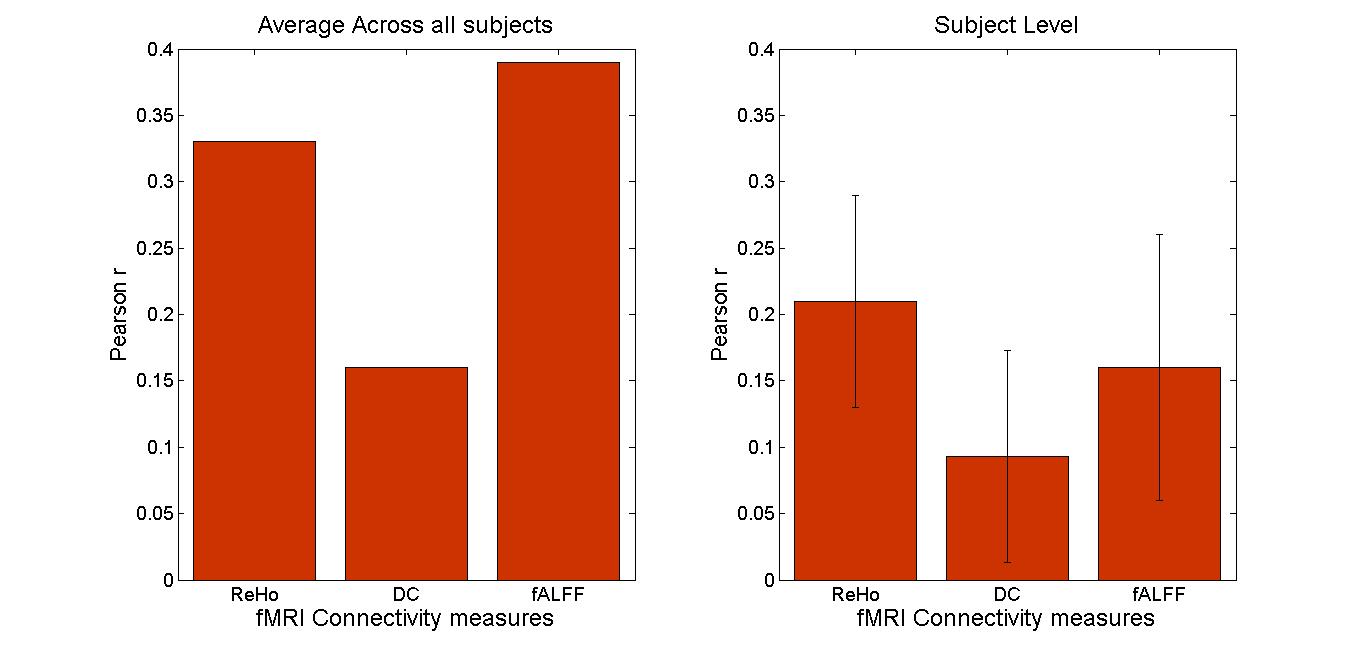
In order to perform inter-modality comparison of connectivity measures, the calculated measures were linearly standardised in to Z-values12 and coregistered to MNI152 (2mm3) standard space. A DMN template proposed by Power JD et. al (2011)13 was used for extracting voxel values from fMRI connectivity measures and PET SUV maps. These extracted voxel values were correlated using Pearson correlation method.
Results
The connectivity measures were calculated as mentioned above and are shown in Figure 1.The correlation values between fMRI connectivity measures and PET SUVs are summarised in Figure 2.
Discussion and Conclusion
Subject level results shows that high connectivity of the DMN hubs is coupled with a high glucose consumption rate 12. This mechanism leaves the DMN very vulnerable to diseases14,15. Further investigations in patients with neuropsychiatric disorders in different disease stages are necessary to explore the potential of simultaneous imaging as a biomarker for disease staging (early diagnosis before clinical symptoms occur), treatment response and monitoring.Acknowledgements
We gratefully thank Dr. Jorge Arrubla and Dr. Joerg Mauler for assistance in human data acquisition. We thank Andrea Muren, Cornelia Frey, Silke Frensch, and Suzanne Schaden for their technical assistance. This study was in part supported by the EU FP7 funded project TRIMAGE (Nr. 602621).References
1. Li, K., Guo, L., Nie, J., Li, G. & Liu, T. Review of methods for functional brain connectivity detection using fMRI. Computerized Medical Imaging and Graphics 33, 131–139 (2009).
2. Liu, H. et al. Decreased regional homogeneity in schizophrenia: a resting state functional magnetic resonance imaging study. Neuroreport 17, 19–22 (2006).
3. Zang, Y. et al. Altered baseline brain activity in children with ADHD revealed by resting-state functional MRI. Brain Dev 29, 83–91 (2007).
4. Garrity, A. G. et al. Aberrant ‘default mode’ functional connectivity in schizophrenia. American Journal of Psychiatry 164, 450–457 (2007).
5. Pankow, A. et al. Reduced default mode network connectivity in schizophrenia patients. Schizophrenia Research 165, 90–93 (2015).
6. Zang, Y., Jiang, T., Lu, Y., He, Y. & Tian, L. Regional homogeneity approach to fMRI data analysis. 22, 394–400 (2004).
7. Zou, Q. H. et al. An improved approach to detection of amplitude of low-frequency fluctuation (ALFF) for resting-state fMRI: Fractional ALFF. Journal of Neuroscience Methods 172, 137–141 (2008).
8. Koschützki, D. et al. Centrality Indices. Network analysis 16–61 (2005). doi:10.1007/978-3-540-31955-9_3
9. Rota Kops, E., Hautzel, H., Herzog, H., Antoch, G. & Shah, N. J. Comparison template-based versus CT-based attenuation correction for hybrid MR/PET scanners. IEEE Trans Nucl Sci 62, 2115–2121 (2015).
10. Yan, C.-G., Wang, X.-D., Zuo, X.-N. & Zang, Y.-F. DPABI: data processing & analysis for (resting-state) brain imaging. Neuroinformatics 14, 339–351 (2016).
11. Li, Z., Kadivar, A., Pluta, J., Dunlop, J. & Wang, Z. Test-retest stability analysis of resting brain activity revealed by blood oxygen level-dependent functional MRI. Journal of Magnetic Resonance Imaging 36, 344–354 (2012).
12. Aiello, M. et al. NeuroImage Relationship between simultaneously acquired resting-state regional cerebral glucose metabolism and functional MRI : A PET / MR hybrid scanner study. NeuroImage 113, 111–121 (2015).
13. Power, J. D. et al. Functional Network Organization of the Human Brain. Neuron 72, 665–678 (2011).
14. Seethalakshmi, R. et al. Regional brain metabolism in schizophrenia: An FDG-PET study. Indian journal of psychiatry 48, 149–53 (2006).
15. Shah, K., DeSilva, S. & Abbruscato, T. The role of glucose transporters in brain disease: Diabetes and Alzheimer’s disease. International Journal of Molecular Sciences 13, 12629–12655 (2012).
Figures