4518
Level of TMS-evoked activation in anterior cingulate cortex depends on timing of TMS delivery relative to frontal alpha phase1Department of Radiology and Radiological Science, Medical University of South Carolina, Charleston, SC, United States, 2Department of Biomedical Engineering, Columbia University, New York, NY, United States, 3Center for Healthy Minds, University of Wisconsin-Madison, Madison, WI, United States, 4Department of Psychiatry and Behavioral Sciences, Medical University of South Carolina, Charleston, SC, United States, 5Ralph H. Johnson VA Medical Center, Charleston, SC, United States
Synopsis
To test whether the level of activation of the anterior cingulate cortex (ACC) following a TMS pulse delivered to the dorsolateral prefrontal cortex depends on precise timing of its delivery relative to an individual’s alpha rhythm, we developed an integrated EEG-fMRI-TMS instrument capable of acquiring simultaneous EEG-fMRI while delivering TMS pulses in the scanner. We found a statistically significant effect of BOLD signal change in ACC dependent on individual subject frontal alpha phase just prior to TMS delivery. Specifically, TMS-evoked BOLD response in the ACC increased when TMS pulse was synchronized to the rising slope of the frontal alpha oscillation.
Introduction
Repetitive transcranial magnetic stimulation (rTMS) over the left dorsolateral prefrontal cortex (DLPFC) is approved as a therapeutic tool for treatment-refractory major depression. It has been suggested that synchronizing rTMS pulse delivery to instantaneous electroencephalogram (EEG) rhythms may increase efficacy of rTMS, but few studies have investigated this relationship.1,2,3 Here, we used simultaneous EEG-fMRI to investigate how ongoing brain activity in DLPFC shapes TMS-evoked responses in the anterior cingulate cortex (ACC) on a trial-by-trial basis.Methods
Twelve subjects participated (two subjects with two sessions). Our integrated EEG-fMRI-TMS instrument included a custom 43 channel MR-compatible bipolar EEG system (Innovative Technologies, CA, USA), a Siemens 3T Prisma MRI Scanner with custom 12 channel head coil (Rapid MR International), and a MagStim Rapid2 TMS device. The TMS coil was placed over subject’s DLPFC while subject lay in the scanner wearing MR-compatible EEG cap. Acquisition parameters: EEG - 488 Hz sampling rate; MR - multi-echo multiband EPI, 3.2 x 3.2 x 3.2 mm voxel, 36 slices, MB acceleration factor 2, repetition time (TR) 1.6s, TE1 11ms, TE2 32.16ms, TE3 53.32ms. Based on subject’s tolerance, TMS device output was set to 100-120% of motor threshold with EEG cap on. Pseudo randomized TMS inter-pulse interval ranged from four to six TRs. Four to six runs were collected, yielding 184 to 276 TMS pulses per session. All system clocks were synchronized with the 10 MHz scanner clock, and the scanner trigger initiated the EEG acquisition for each run. Raw EEG data was processed to reduce decaying oscillatory artifacts induced by the interaction between TMS and the EEG amplifier, gradient artifacts, and ballistocardiogram (BCG) artifacts.4,5 We constructed acausal bandpass filters centered around the individual subject alpha frequency (IAF) to extract alpha phase prior to each TMS pulse from averaged EEG signal over the four left frontal electrodes (AF3, Fp1, F3, F7). IAF was selected based on the peak frequency in 7.5-12.5 Hz range from the AF3 electrode. To prevent systematic contamination of our pre-TMS phase estimation by the large TMS pulse artifact, we locally mirrored the EEG signal from one TR prior to each pulse onto the following TR. Because this leads to unreliable phase estimates at the time of the pulse itself, we chose to extract phase at 0.15s prior to each TMS pulse. Alpha phase was estimated by taking the angle of the Hilbert transformed signal. Multi-echo independent component analysis (ME-ICA)6 was used for motion correction, slice time correction, differentiating Blood Oxygenation Level Dependent (BOLD) and non-BOLD signals, and merging the three denoised7 echo images into one image. Functional data was high-pass filtered, and spatially smoothed with a 5mm full-width Gaussian kernel. FEAT (FMRIB Software Library)8 was used to model TMS pulses in each run with boxcar functions whose onset matched pulse timing. We modeled activations across runs for each subject with a mixed-effects model, and re-thresholded the resulting statistical image at z > 1.8 and p < 0.05 to find clusters in the ACC modulated by TMS. For each pulse, TMS-evoked BOLD responses were extracted locked to the pulse onset and averaged over voxels in each subject’s TMS-modulated ACC cluster (Figure 1).Results
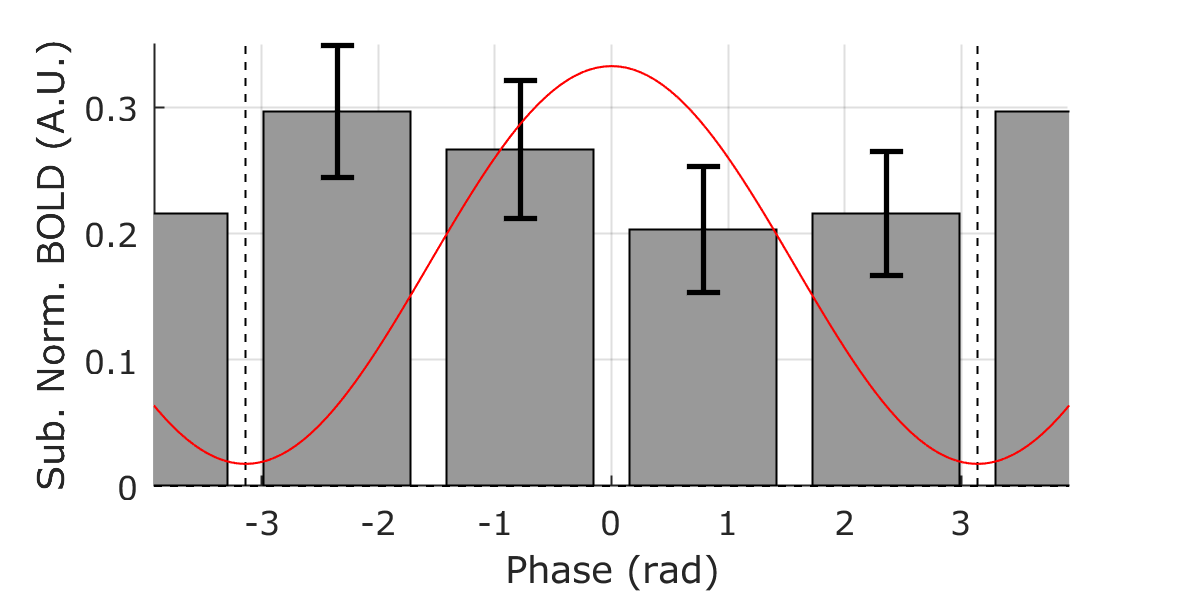
For each subject, we regressed out the sinusoidal contribution of BCG phase in the alpha band from the processed BOLD responses to minimize the possible effect of any residual BCG signal on our analysis. We then calculated the circular-linear correlation coefficient9 between peak BOLD response (4 to 5.6s following each TMS pulse) and alpha phase prior to pulse delivery for each subject. The circular-linear coefficient was corrected for bias by subtracting the median of the distribution generated by re-calculating the statistic from resampled BOLD values with respect to phase (Figure 2a). Using a one-tailed Wilcoxon signed-rank test, we found a distribution of corrected alpha-BOLD circular-linear correlation (Figure 2b) which was significantly greater than zero (p = 0.016, W = 57), rejecting the null hypothesis that the median of the coefficient is less than or equal to zero. Sorting the alpha phase into four bins from -π to π radians shows that BOLD response was largest when TMS was applied on the rising edge of the alpha wave (Figure 3).Conclusion
Our results indicate that TMS-evoked BOLD response in ACC depends on frontal alpha phase just prior to TMS delivery. These findings suggest optimizing rTMS treatment by creating a closed-loop EEG-TMS system to deliver TMS pulses synchronized to individual’s instantaneous frontal alpha phase to maximize the activation of ACC.Acknowledgements
We would like to thank Jordan Muraskin for help with early stages of this work.
This work was funded by NIH R21MH106775.
References
1. Veniero D, Brignani D, et al. Alpha-generation as basic response-signature to transcranial magnetic stimulation (TMS) targeting the human resting motor cortex: A TMS/EEG co-registration study. Psychophysiology, 2011;48(10):1381-1389.
2. Kundu B, Johnson JS, Postle BR. Prestimulation phase predicts the TMS-evoked response. J Neurophysiol, 2014;112(8):1885-1893.
3. Ferreri F, Vecchio F, et al. Time-varying coupling of EEG oscillations predicts excitability fluctuations in the primary motor cortex as reflected by motor evoked potentials amplitude: an EEG-TMS study. Human Brain Mapping, 2014;35(5):1969-1980.
4. Niazy RK, Beckmann CF, et al. Removal of FMRI environment artifacts from EEG data using optimal basis sets. Neuroimage, 2005;28(3):720-737.
5. Iannetti GD, Niazy RK, et al. Simultaneous recording of laser-evoked brain potentials and continuous, high-field functional magnetic resonance imaging in humans. Neuroimage, 2005;28(3):708-719.
6. Kundu P, Inati SJ, et al. Differentiating BOLD and non-BOLD signals in fMRI time series using multi-echo EPI. Neuroimage, 2012;60(3),1759-1770.
7. Veraart J, Novikov DS, et al. Denoising of diffusion MRI using random matrix theory. Neuroimage, 2016;142,394-406.
8. Smith SM, Jenkinson M, et al. Advances in functional and structural MR image analysis and implementation as FSL. Neuroimage, 2004;23: S208 –S219.
9. Fisher NI. Statistical analysis of circular data. Cambridge University Press, 1995.
Figures