4516
Estimation of simultaneous BOLD and FDG metabolism activation using a coherent ICA method1Department of Electrical and Computer System Engineering, Monash University, Clayton, Australia, 2Monash Biomedical Imaging, Monash University, Clayton, Australia, 3Australian Research Council Centre of Excellence for Integrative Brain Function, Monash University, Clayton, Australia, 4Monash Institute of Cognitive and Clinical Neuroscience, Monash University, Clayton, Australia
Synopsis
This abstract proposes a new joint fMRI and functional FDG-PET (fPET) ICA analysis method, coherent ICA, based on the simultaneously acquired dual-modality imaging data. It applies ICA on the spatiotemporal data sets from both modalities to obtain coherent activation maps and preserve their correspondent temporal information, which is not retained by existing methods. The preserved temporal information can potentially be used to investigate the interaction between BOLD signal and other metabolism change measured by fPET.
Introduction
Simultaneous MR-PET (Magnetic Resonance-Positron Emission Tomography) has recently been introduced for multimodal imaging of the human brain. The recent development of constant infusion functional FDG-PET (fPET) can detect glucose utilisation change in the brain in semi-real time1, 2. In terms of data analysis, independent component analysis (ICA) is a well-known data-driven method used in fMRI analysis. The joint ICA, parallel ICA and linked ICA 3, 4 have been proposed to conduct multi-modal imaging analysis. However, instead of running ICA approaches on raw spatiotemporal data set, these methods usually run ICA on brain activation maps, which are spatial information extracted from each imaging modality separately. These two-level analysis methods can only provide the fusion of spatial information as the temporal information of each modality have been removed or processed separately. In this abstract, a new coherent ICA analysis method, applied on pre-processed raw data of both modalities, is proposed to explore the relationship of BOLD and dynamic FDG signals in both spatial and temporal domain.Theory and Methods
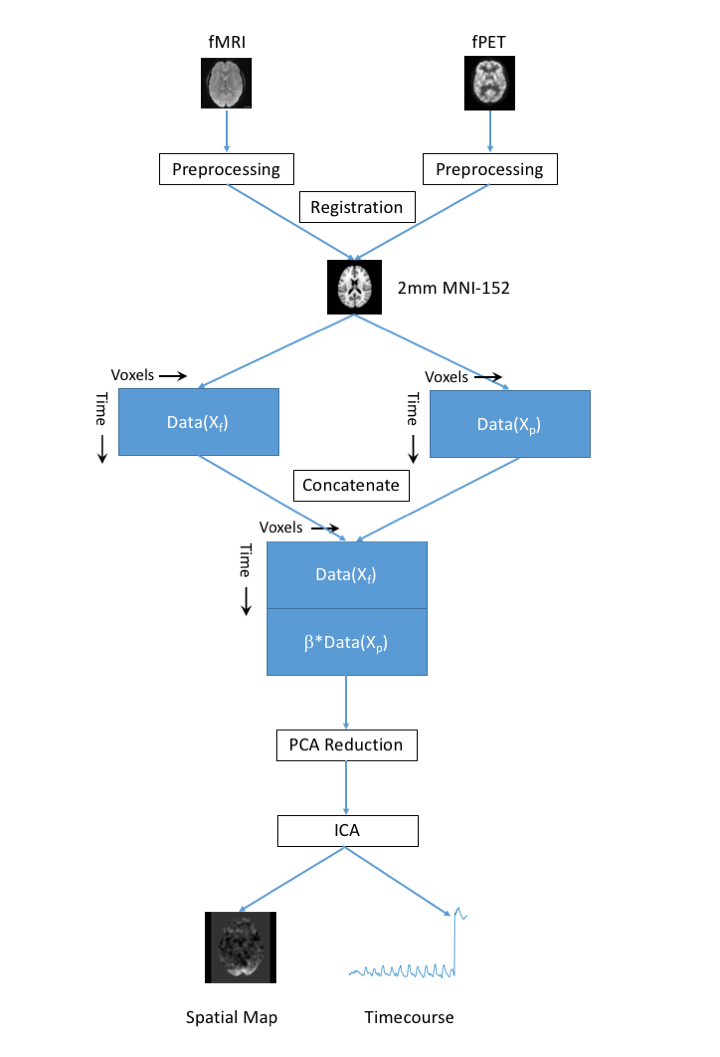
The fundamental idea of ICA is to maximize the non-Gaussianity of components estimation $$$\textbf{y}=W\textbf{x}$$$, where $$$\textbf{x}$$$ are mixed signal and $$$W$$$ is the un-mixing matrix. By registering the fMRI and fPET images into a common space, the concatenated data is given by
$$X_{joint}\in \mathbf{R}^{(n_f+n_p)\times m}=\left[\begin{array}{c} X_f \\X_p \end{array} \right].$$
where $$$X_f\in \mathbf{R}^{n_f\times m_f} $$$ and $$$X_p\in \mathbf{R}^{n_p\times m_p} $$$ are fMRI and fPET spatiotemporal matrices at individual or group level, respectively. The coherent ICA problem is given by
$$\label{joint_obj_m}\max_{W_{joint}} J\{W_1X_f+ W_2X_p\} \quad \quad \quad \quad \quad \quad \quad \quad (1)$$
where $$$ J\{\bullet\}$$$ denote the measurement of non-Gaussianity5 and $$$W_{joint}=\left[\begin{array}{cc} W_1 & W_2\end{array} \right]$$$ contains the temporal information for each imaging modality.
To solve the uneven power contribution of each modality in (1), a principle component analysis (PCA) dimension reduction on weighted $$$\{W_1X_f+ \beta W_2X_p\}$$$ is needed before applying ICA. The variance contribution from each modality in (1) can be tuned by $$$\beta$$$. The processing flow chart of proposed joint coherent fMRI-fPET ICA is given in the Figure 1.
Data Acquisition and Task Design
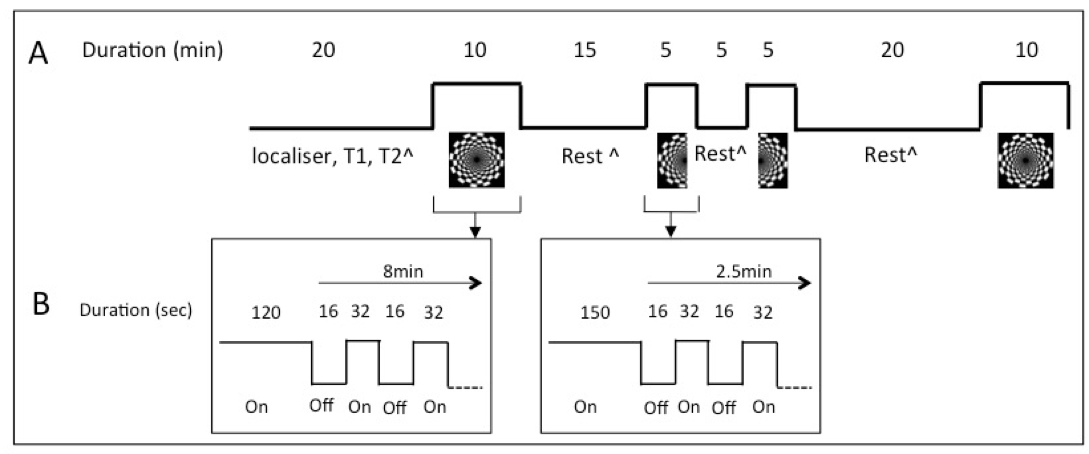
A group of 5 subjects (19-30 yrs) were scanned on a 3T Siemens Biograph mMR. The study was approved by the institute ethics committee. The task paradigm and scanning protocols are
- All participants were asked to take part in three visual stimulation tasks during scan. The detail of task paradigm is given in Figure 2. Only the first full checkerboard stimulation (2 minutes fixed board and then periodical off/on stimulation at frequency 1/48s=0.0208Hz) is used in this study.
- Each participant was infused with 100MBq F18-FDG at a constant rate 36mL/hr over 90 minutes. The PET listmode data was binned into 1 minute frame, and reconstructed using ordered subset expectation maximisation (OSEM) with point-spread function (PSF) correction. There were total 30 frames selected for the first full checkerboard stimulation, including 10 frames resting, 10 frames task and another 10 frames resting after stimulus. Each frame was voxelwisely divided by the average utilisation of gray matter to generate the relative glucose utilisation map.
- During the first full checkerboard, 10 minutes echo-planar image (EPI) pulse sequence(TR=2450ms, TE=30ms, FA=90°, 44 axial slices, slice thickness: 3mm) were performed to acquire total 242 frames in each subject.
Results and Discussion
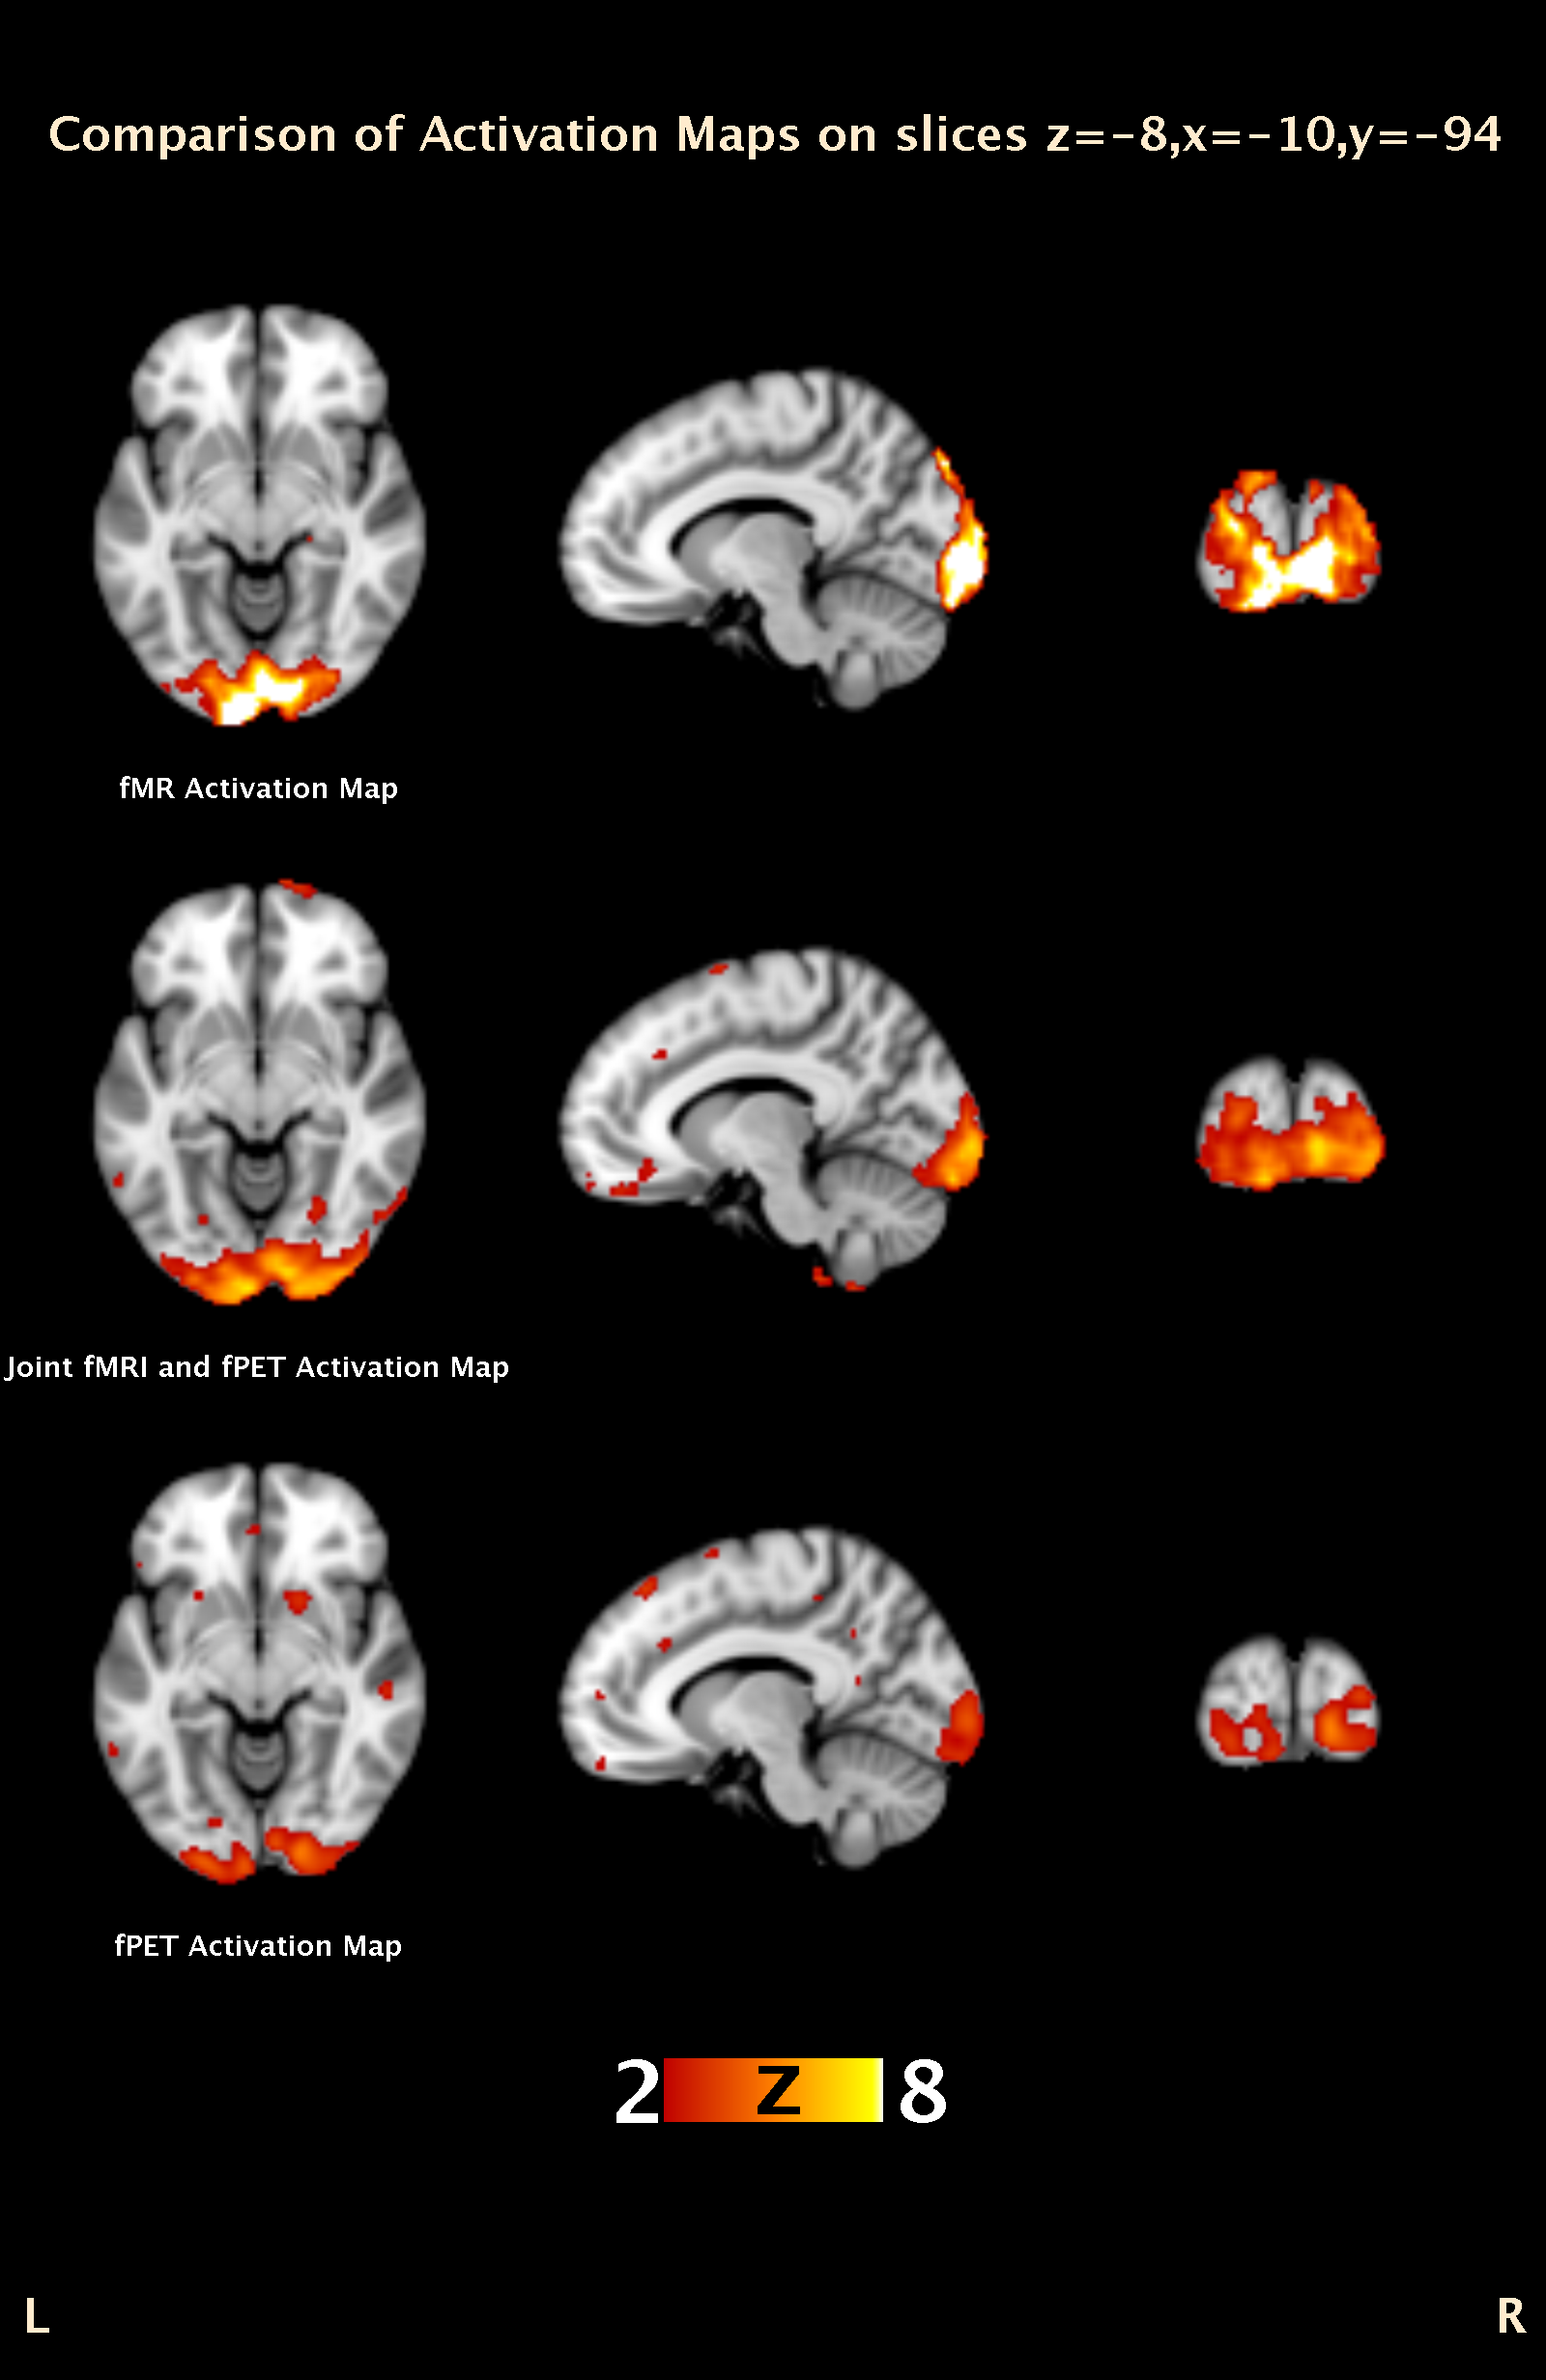
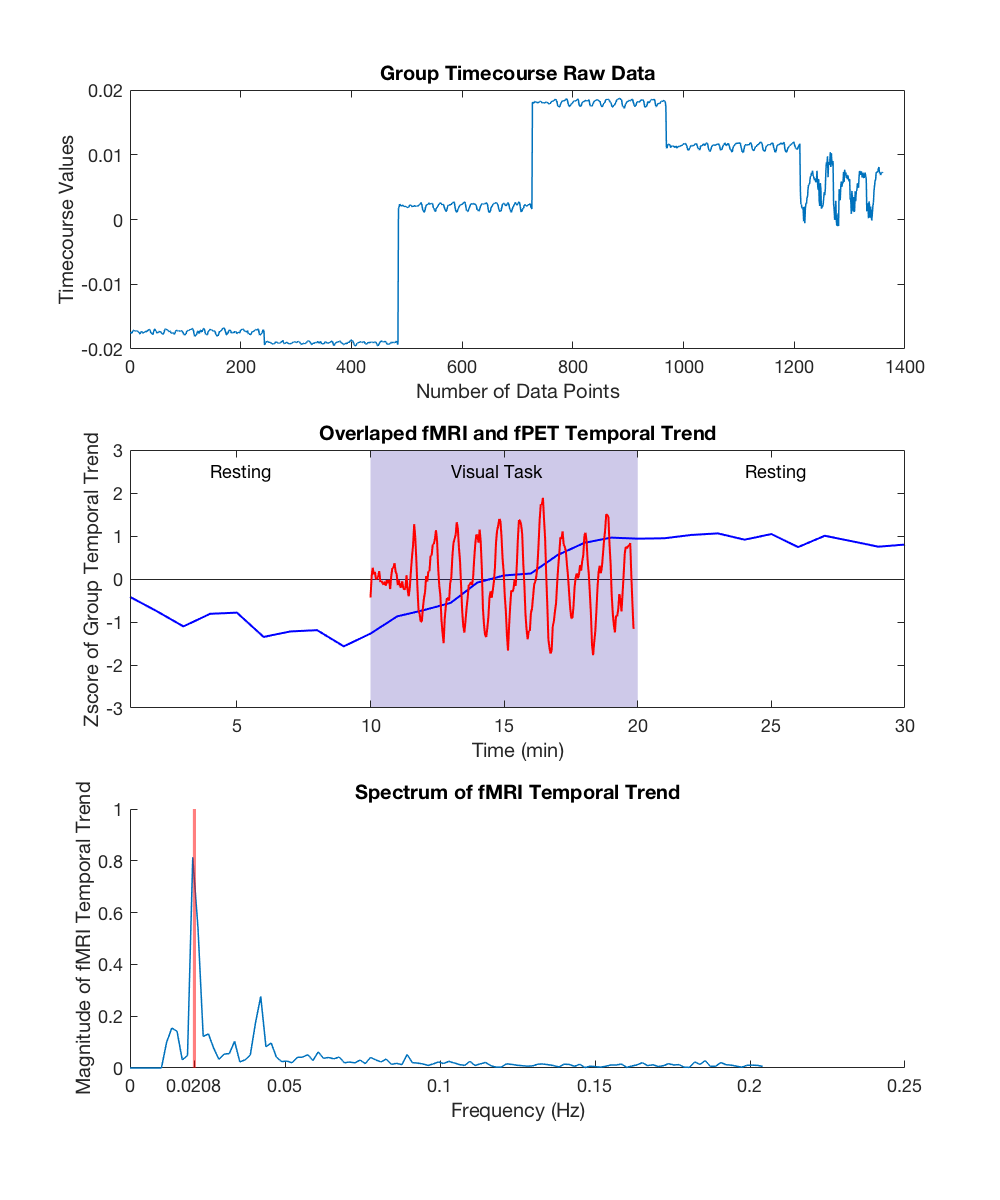
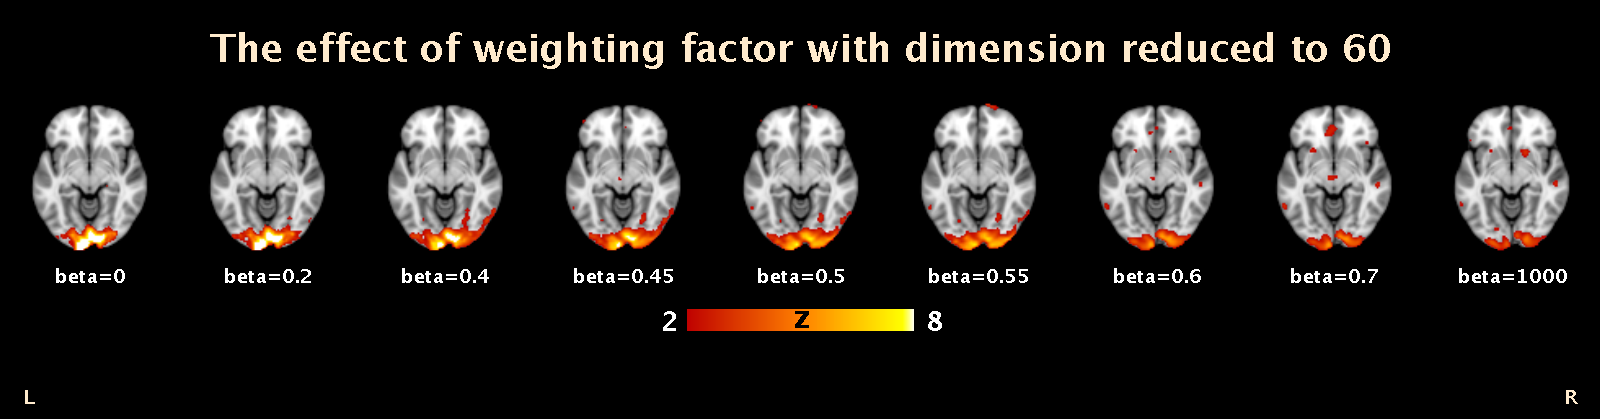
In Figure 3, activation of simultaneous BOLD and glucose utilisation change has been identified using the coherent ICA method.The joint fMRI-fPET activation map shows the mutual information of BOLD and glucose utilisation change. Different regions within the visual area are identified by fMRI, fPET, and the joint fMRI-fPET. Further investigation of these differences is currently underway. Figure 4 demonstrates the temporal information of the joint fMRI-fPET obtained by coherent ICA. The top plot shows the group timecourse obtained from un-mixing matrix $$$X_{joint}$$$. The middle plot illustrates the normalised group average of temporal trend of fPET (blue) and fMRI (red). During task activation from 10 to 20 minutes, the activated region shows higher relative glucose utilisation change. Combined with fMRI spectrum shown in bottom plot, both fMRI and fPET temporal trends are consistent to the task paradigm. Figure 5 shows that, by tuning weighting factor $$$\beta$$$ from 0 to a sufficient high number (1000), the activation map gradually changes from fMRI to fPET results.Conclusion
This paper proposes a new joint fMRI and fPET ICA analysis method, coherent ICA, based on the simultaneously acquired dual-modality imaging data. Compared to existing multi-modality ICA methods, this new method performs ICA on pre-processed spatiotemporal data sets to obtain coherent activation maps and preserve their correspondent temporal information, which is not retained by existing methods. The preserved temporal information can be potentially used to investigate the interaction between BOLD signal and other metabolism change measured by fPET.Acknowledgements
We acknowledge Richard McIntyre, Alexandra Carey and Thomas Close for their support in this work.References
1. M. Villien, H. Y. Wey, J. B. Mandeville, C. Catana, J. R. Polimeni, C. Y. Sander, N. R. Zurcher, D. B. Chonde, J. S. Fowler, B. R. Rosen, and J. M. Hooker. Dynamic functional imaging of brain glucose utilization using fpet-fdg. Neuroimage , 100:192-199, 2014.
2. A. Hahn, G. Gryglewski, L. Nics, M. Hienert, L. Rischka, C. Vraka, H. Sigurdardottir, T. Vanicek, G. M. James, R. Seiger, A. Kautzky, L. Silberbauer, W. Wadsak, M. Mitterhauser, M. Hacker, S. Kasper, and R. Lanzenberger. Quantication of task-specic glucose metabolism with constant infusion of 18f-fdg. J Nucl Med , 57(12):1933-1940, 2016.
3. V. D. Calhoun, J. Liu, and T. Adali. A review of group ica for fmri data and ica for joint inference of imaging, genetic, and erp data. Neuroimage , 45:S163-172, 2009.
4. A. R. Groves, C. F. Beckmann, S. M. Smith, and M. W.Woolrich. Linked independent component analysis for multimodal data fusion. Neuroimage , 54(3):2198-2217, 2011.
5. A. Hyvarinen and E. Oja. Independent component analysis: algorithms and applications. Neural Networks , 13:411-430, 2000.
Figures