4512
BOLD Hemodynamic Response Function Varies as a Function of Both Brain State and Brain Region1University of Sherbrooke, Sherbrooke, QC, Canada, 2Philips Healthcare, Markham, ON, Canada
Synopsis
The BOLD signal is linked to neural activity through the canonical hemodynamic response function (HRF), often assumed to be static across both brain area and brain state. We employed simultaneous EEG-FMRI recordings to investigate the hemodynamic response to neural activity in the alpha, beta, and gamma frequency bands. We find that the shape of the HRF depends on both brain region, and brain state. Default mode network (DMN) BOLD signals are linked to alpha synchronization, while occipital BOLD signals are linked to alpha/beta desynchronization and gamma synchronization. Connectivity estimates assuming a canonical HRF may be biased by HRF differences across region and state.
Introduction
Blood oxygen level dependent functional magnetic resonance imaging (BOLD FMRI) has become the most widely used imaging modality for investigating human brain activity, and changes in the BOLD signal are thought to reflect changes in underlying neural activity. However, the precise relationship between neural activity and BOLD is still unknown.
Typically a hemodynamic response function (HRF), which assumes a linear relationship between neural activity and BOLD [1], is used to relate neural activity to BOLD. For example, when computing resting state FMRI connectivity, the assumption is that different brain regions all possess the same HRF [2], making it possible to correlate BOLD signals from different brain areas. Similarly, in studies of dynamic functional connectivity, the HRF is assumed to be constant in time.
Using simultaneous EEG-FMRI, we investigated the assumption that the HRF is constant across brain region and time, by observing simultaneous alpha-BOLD and gamma-BOLD coupling in different brain states and regions.
Methods
Simultaneous EEG-FMRI in a 3T Philips Ingenia, 9 healthy subjects recruited from University of Sherbrooke (4 female), EEG sampling 64 channel Brainvision EEG cap, FMRI TR=0.693, voxel size = 3.75mm, image size 64x64x33mm isotropic, multiband 3.
Four separate brain states were investigated: retinotopic mapping, resting state, event-related visual stimulation (drifting grating), and continuous visual stimulation (movie). With the exception of resting state (eyes closed), subjects were required to fixate a red crosshair for the duration of the scan, each scan lasted 8.5 minutes.
EEG and FMRI were denoised using temporal and spatial ICA respectively, removing noise components (head motion, heart beat, ventricles, eye blinks, muscular contraction, etc) by visual inspection. Clean EEG signals were source-localized (8mm isotropic) using precise electrode locations [3] and head model [4] and source power was computed in each voxel using multi-taper time-frequency analysis. Clean FMRI signals were bandpass filtered [5] (0.01-0.5Hz) and correlated on a per-voxel basis with source localized EEG power time series. A preprocessing flow chart can be seen in Figure 1A, and EEG data quality control in Figure 1B (comparing EEG acquired inside and outside the scanning environment in response to visual stimulus).
Voxel-based correlation of EEG and BOLD was performed two ways 1) convolving EEG power with the canonical HRF [1] and then correlating with BOLD, resulting in an EEG-BOLD coupling spectrum from 0-100Hz in each voxel, or 2) cross correlation of EEG power with BOLD, resulting in an EEG-BOLD time-frequency coupling matrix in each voxel.
Results
A general pattern of positive gamma-BOLD correlations and negative alpha/beta-BOLD correlations is consistent across brain states (Figure 2A).
EEG-BOLD coupling differs across regions: when comparing alpha-BOLD coupling in the default mode network (DMN) and primary visual cortex (V1), HRF-convolved alpha power correlated more strongly with BOLD in V1 than in DMN (Figure 2B, p=0.005).
EEG-BOLD coupling differs across states: when comparing alpha-BOLD and gamma-BOLD coupling in V1 across states, the retinotopic mapping experiment trended towards stronger coupling for both frequency bands as compared to resting state (Figure 2C, p=0.08, p=0.11).
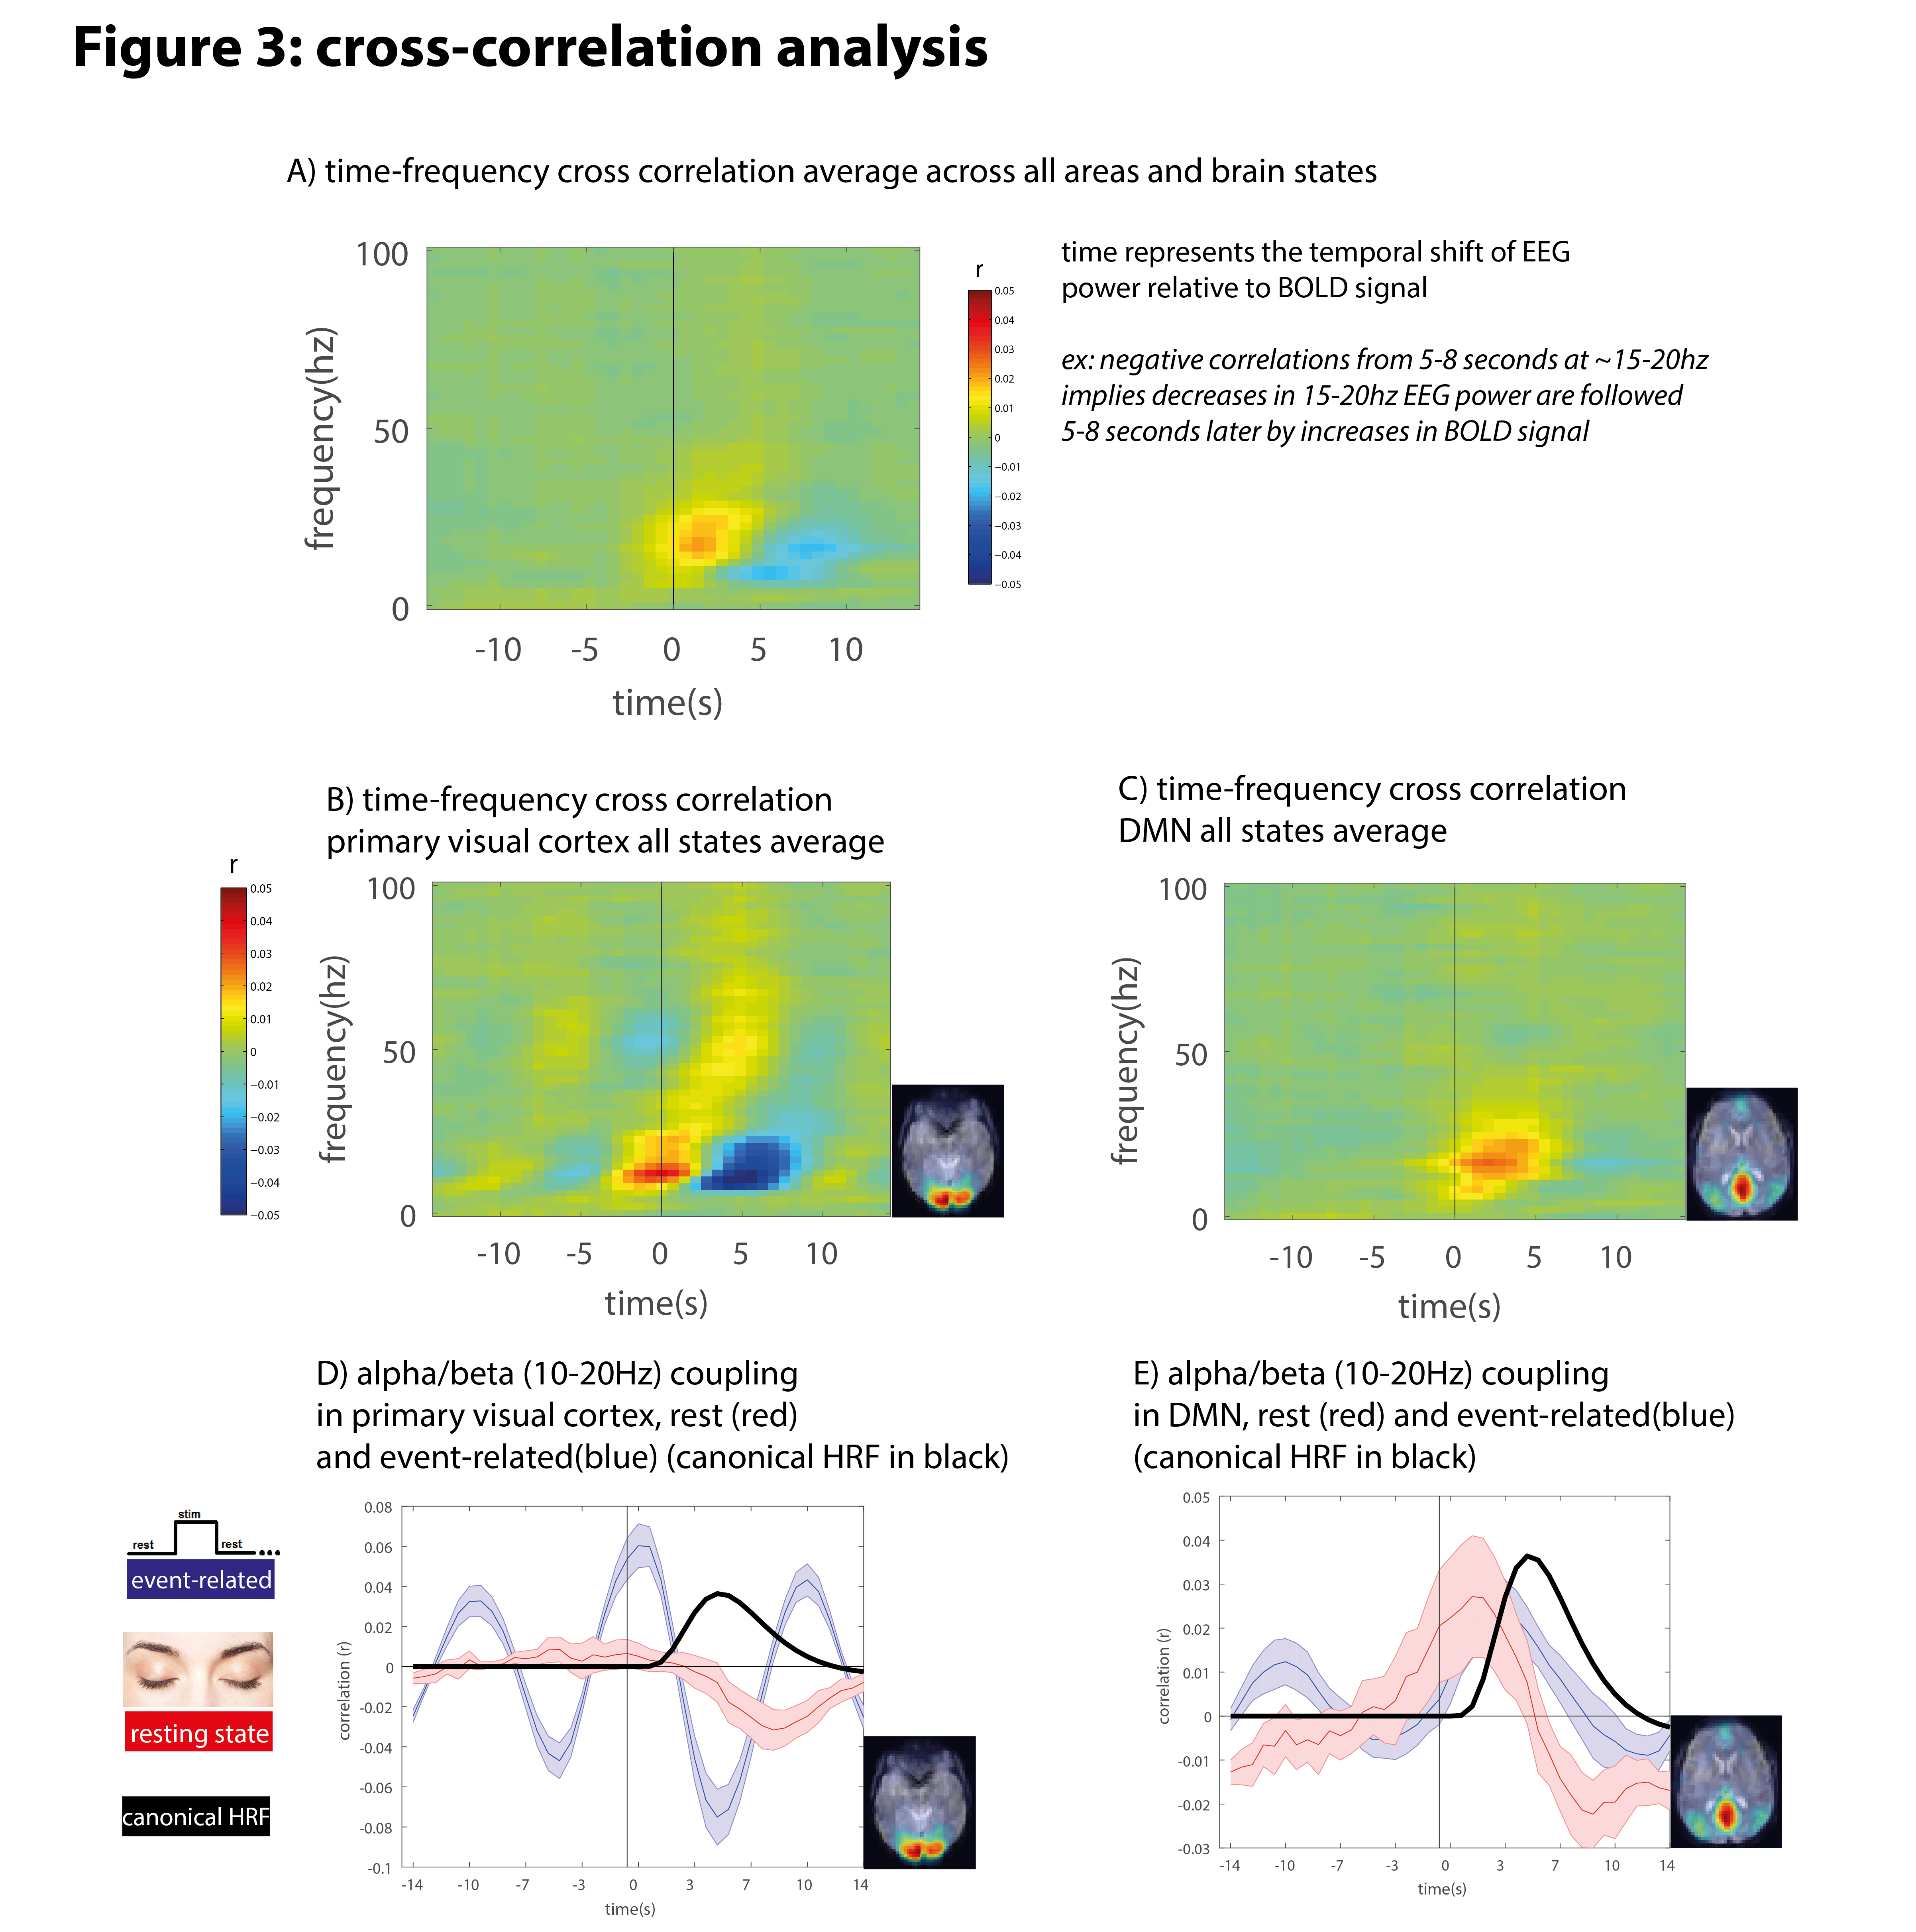
Cross correlation analysis: averaging time-frequency cross correlation matrices across all brain states and regions revealed biphasic coupling in the 10-20Hz frequency range with positive coupling at 0-4s time lag, and negative coupling at 5-10s time lag (Figure 3A). V1 had negative alpha-BOLD coupling and positive gamma-BOLD coupling at canonical time lag (6sec) (Figure 3B, Figure 3D), while DMN had positive alpha-BOLD coupling at non-canonical time lag (3s) (Figure 3C, Figure 3E).
Discussion
In accordance with previous work [6], our cross-correlation analysis revealed reliable BOLD-EEG alpha/beta coupling at 6-8s time lag. However, the HRF varies as a function of both brain state and area, and the fixed hemodynamic delay of 6 seconds does not hold for all areas. Furthermore, in some areas such as DMN, alpha-BOLD coupling is positive, suggesting that changes in DMN activity are linked to alpha synchronization rather than desynchronization [7].
The regional variability of neurovascular coupling suggests that BOLD signal connectivity measured across different brain areas [8] must be interpreted with caution, and state dependent coupling suggests that dynamic changes in functional connectivity[9] may be partly due to changes in coupling and must also be cautiously interpreted.
Conclusion
The relationship between EEG power and BOLD is state and region dependent. More work is necessary to understand the neural basis for BOLD signals, and the extent to which connectivity measures depend on choice of HRF.Acknowledgements
No acknowledgement found.References
[1] J. M. Zumer, M. J. Brookes, C. M. Stevenson, S. T. Francis, and P. G. Morris, “Relating BOLD fMRI and neural oscillations through convolution and optimal linear weighting.,” Neuroimage, vol. 49, no. 2, pp. 1479–89, Jan. 2010.
[2] “Review of methods for functional brain connectivity detection using fMRI,” Comput. Med. Imaging Graph., vol. 33, no. 2, pp. 131–139, Mar. 2009.
[3] R. Butler, G. Gilbert, M. Descoteaux, P.-M. Bernier, and K. Whittingstall, “Application of polymer sensitive MRI sequence to localization of EEG electrodes,” J. Neurosci. Methods, vol. 278, pp. 36–45, 2017.
[4] B. Fischl, “FreeSurfer.,” Neuroimage, vol. 62, no. 2, pp. 774–81, Aug. 2012.
[5] R. W. Cox, “AFNI: software for analysis and visualization of functional magnetic resonance neuroimages.,” Comput. Biomed. Res. an Int. J., vol. 29, no. 3, pp. 162–173, 1996.
[6] J. C. de Munck et al., “The hemodynamic response of the alpha rhythm: An EEG/fMRI study,” Neuroimage, vol. 35, no. 3, pp. 1142–1151, 2007.
[7] G. Winterer, F. W. Carver, F. Musso, V. Mattay, D. R. Weinberger, and R. Coppola, “Complex relationship between BOLD signal and synchronization/desynchronization of human brain MEG oscillations.,” Hum. Brain Mapp., vol. 28, no. 9, pp. 805–16, Sep. 2007.
[8] E. L. Dennis and P. M. Thompson, “Functional Brain Connectivity Using fMRI in Aging and Alzheimer’s Disease,” Neuropsychol. Rev., vol. 24, no. 1, pp. 49–62, Mar. 2014.
[9] “Dynamic functional connectivity: Promise, issues, and interpretations,” Neuroimage, vol. 80, pp. 360–378, Oct. 2013.
Figures
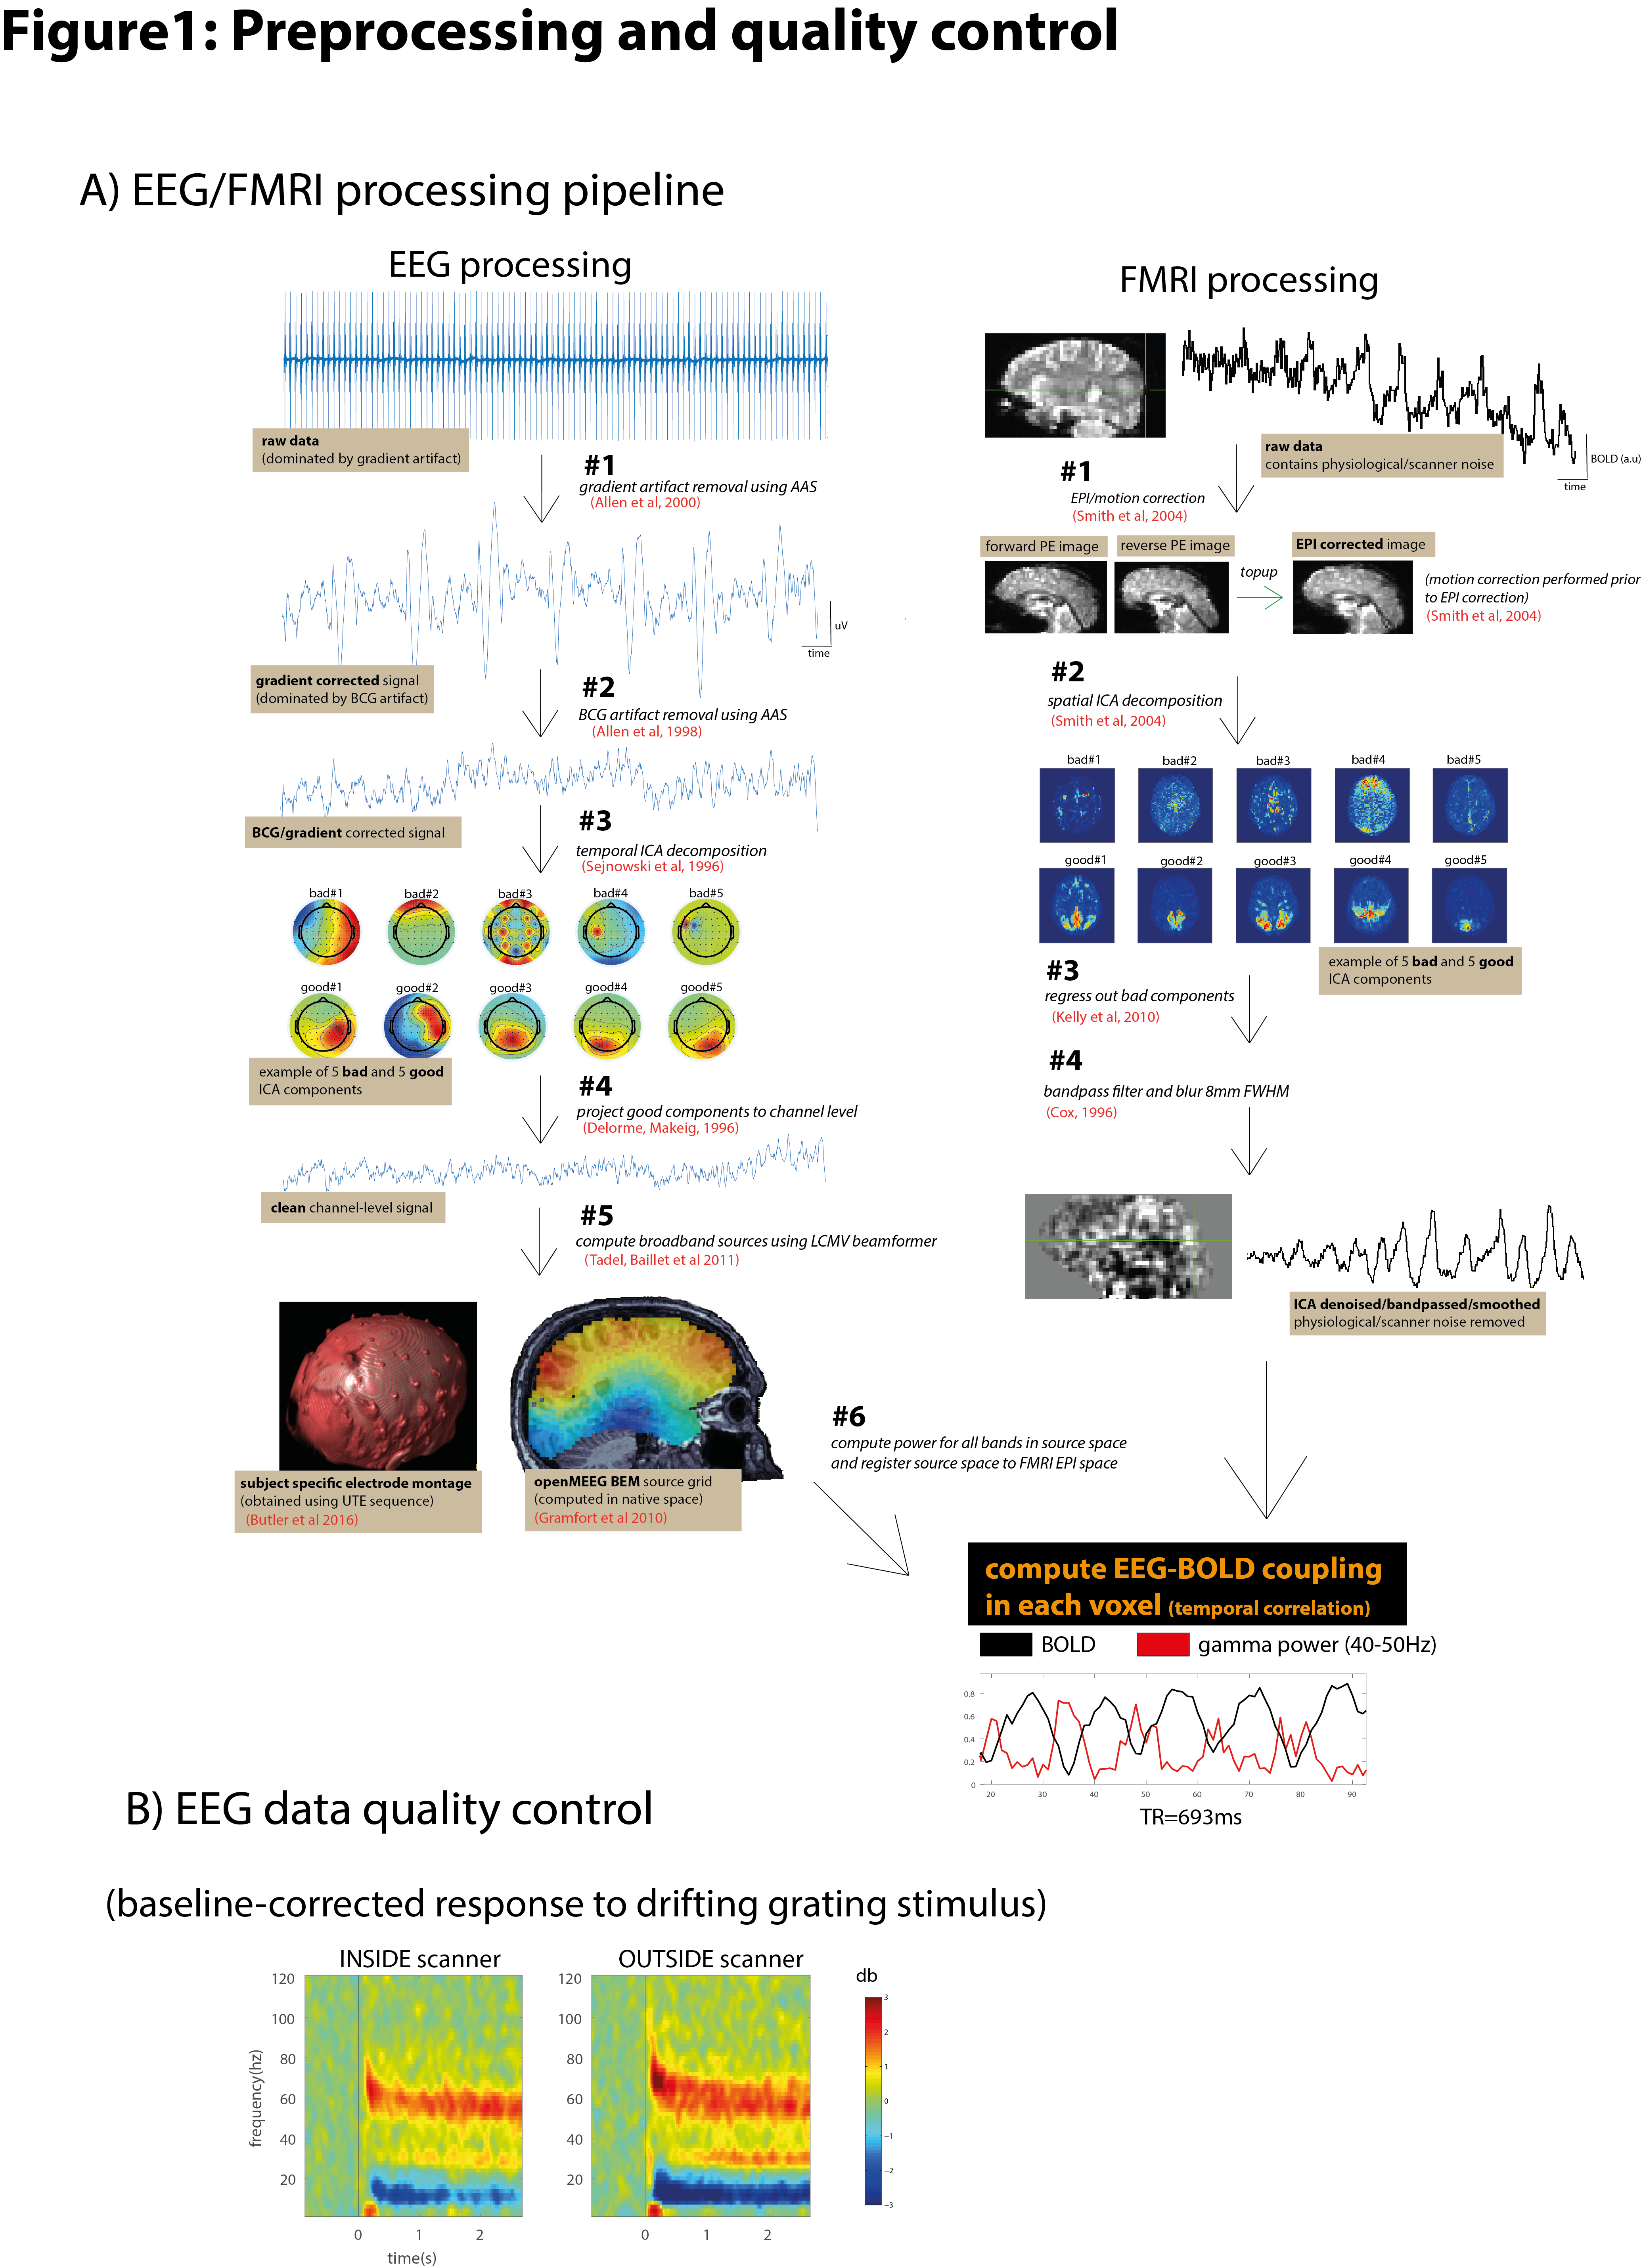
Figure 1: Preprocessing and quality control
A) EEG/FMRI processing pipeline. Gradient/Ballistocardiogram artifacts were removed from EEG signals, noise components were removed using ICA, and clean channel-level signal were projected to source space using precise electrode locations obtained from ultra-short TE MRI image of EEG cap. FMRI underwent EPI correction, noise removal using ICA, and bandpass filtering (0.01-0.5Hz). BOLD signal was correlated with downsampled, bandpass filtered EEG power in different frequency bands, in each voxel.
B) EEG data quality control. To ensure good quality EEG alpha/beta and gamma response inside scanner, identical stimuli were presented outside scanner for comparison.
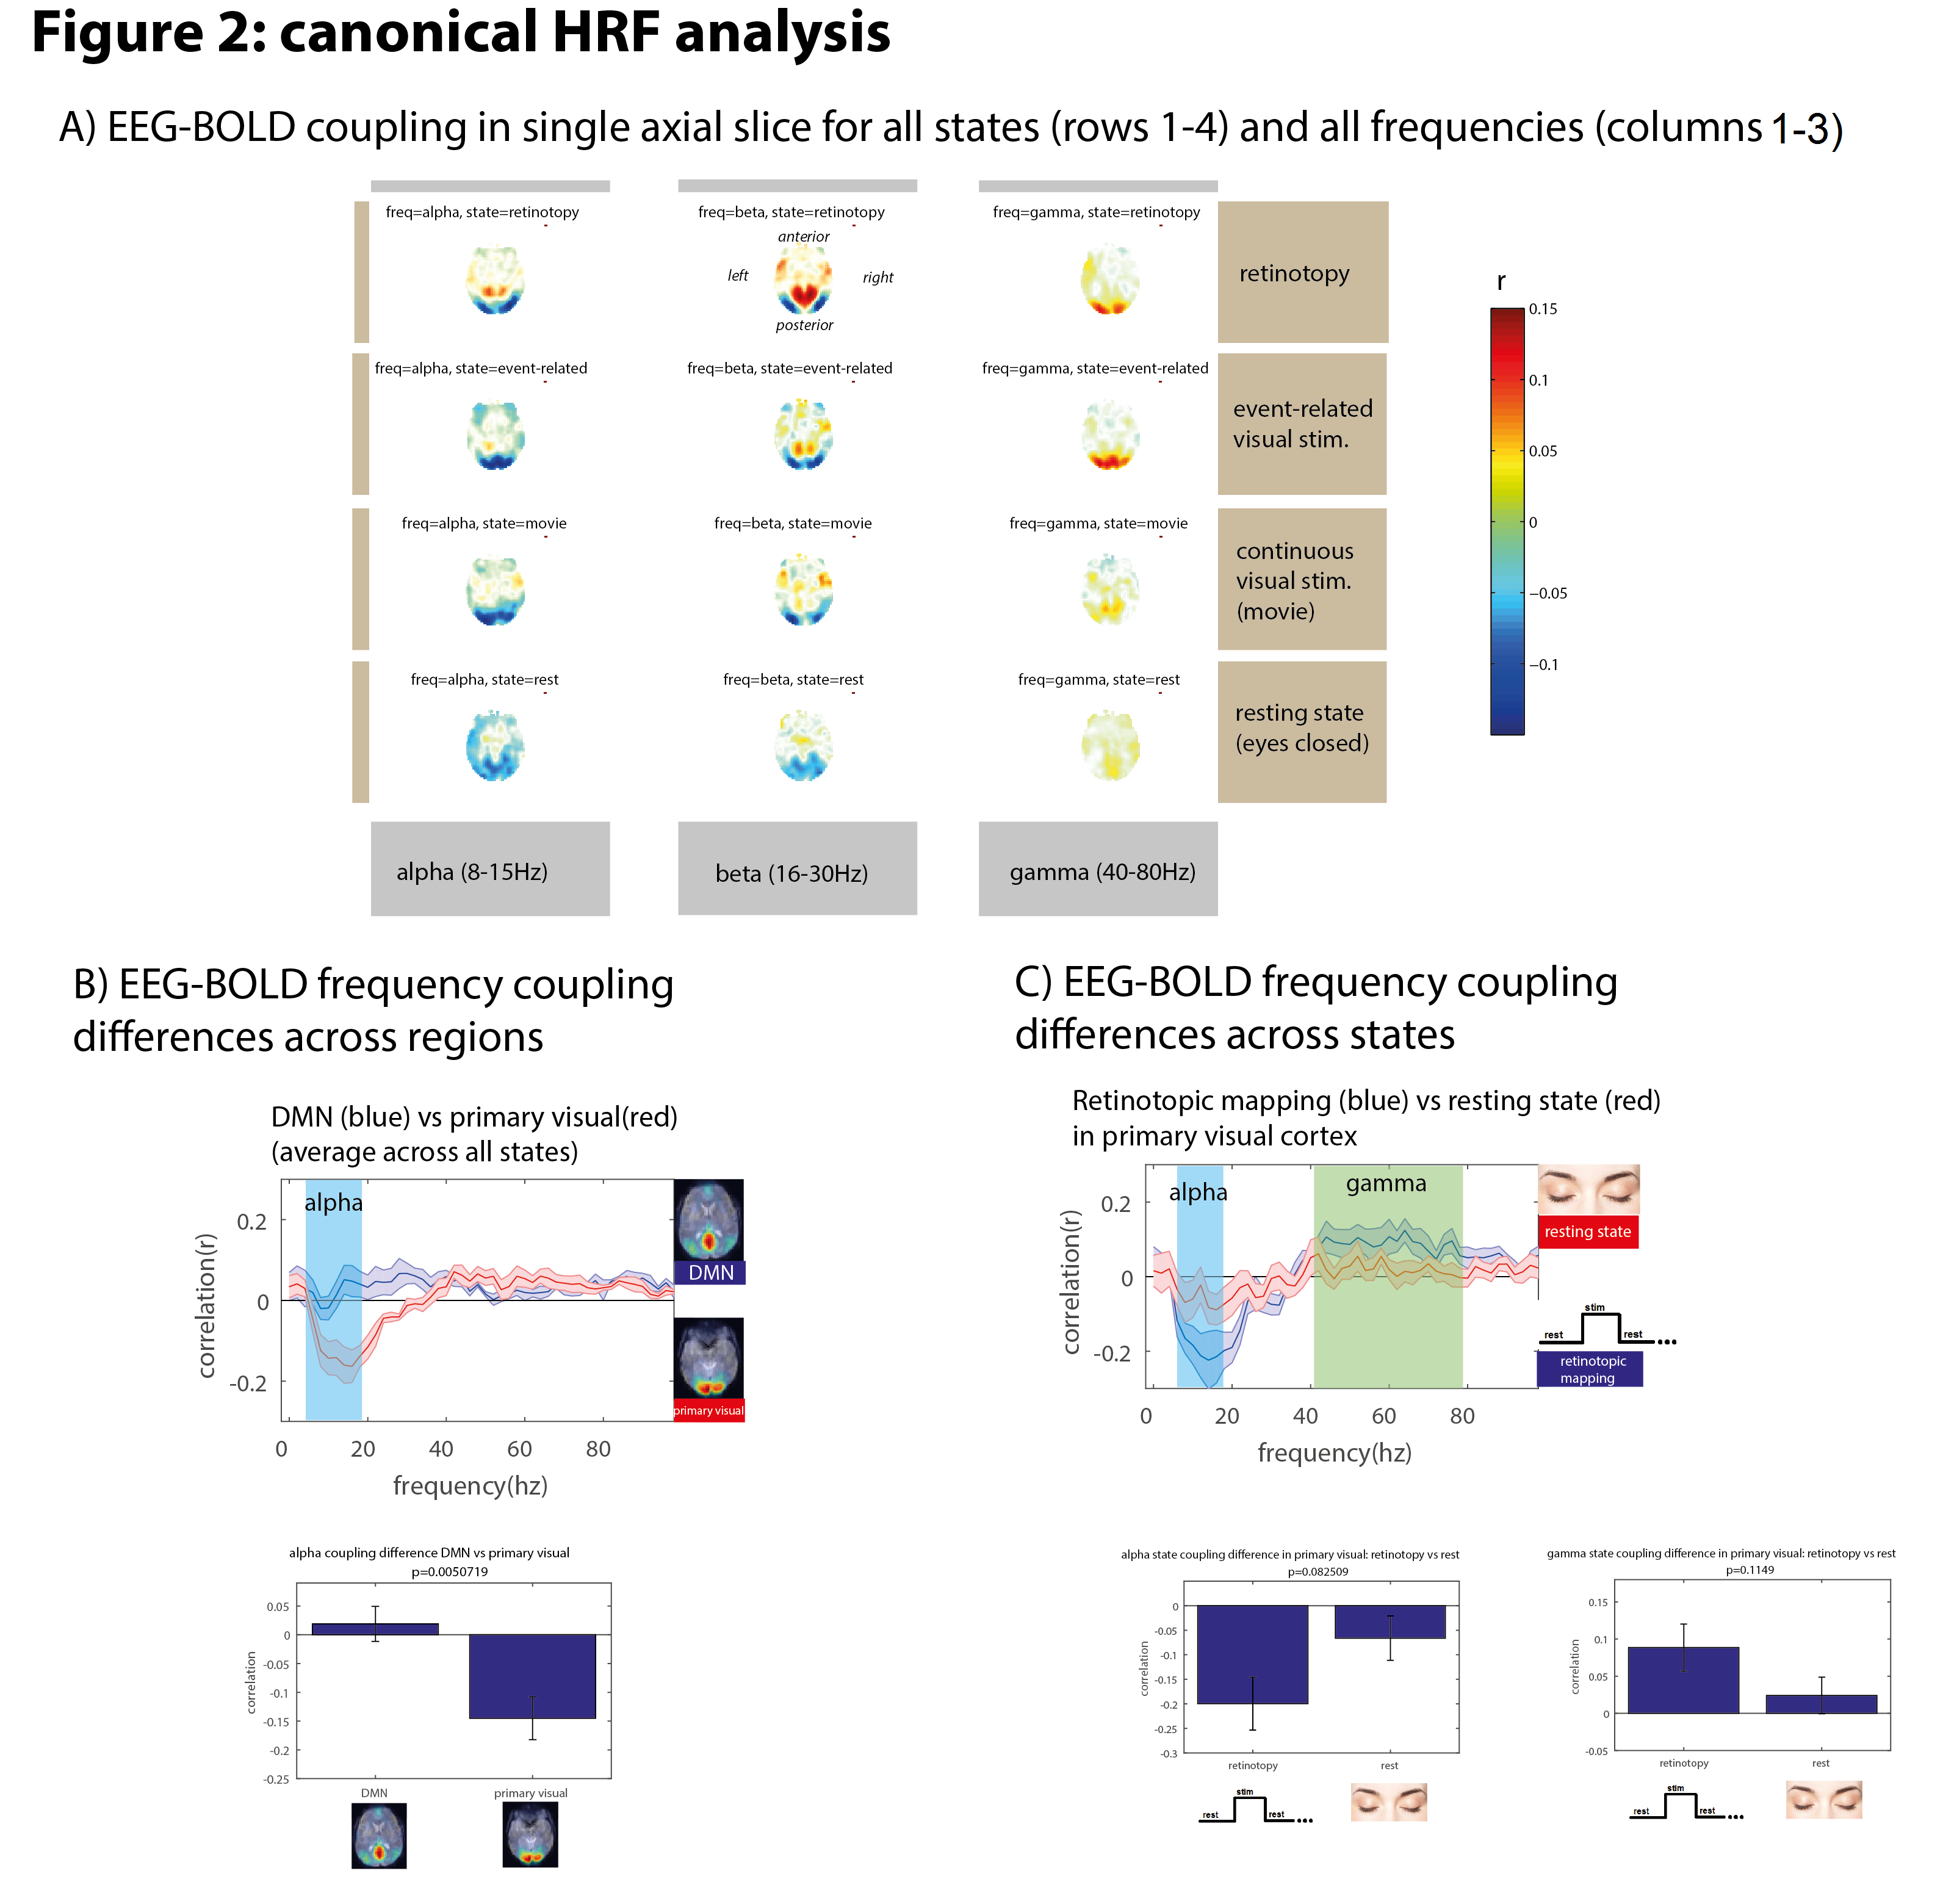
Figure 2: Canonical HRF analysis
A) EEG-BOLD coupling for different states and frequency bands. Correlating alpha/beta power with the canonical HRF and correlating with bold revealed negative correlations in the occipital lobe, while doing the same with gamma power revealed positive gamma-BOLD correlations.
B) examining the coupling spectrum in two specific regions (occipital lobe and DMN) reveals significant differences in alpha-BOLD coupling across regions.
C) examining the coupling spectrum in the same region but across two specific states (resting state and retinotopy) reveals differences in coupling depending on brain state.