4509
Evaluation of Fitting Uncertainties and Errors for Dispersion-Based Imaging of Prostate DCE-MRI1Radiological Sciences, University of California, Los Angeles, Los Angeles, CA, United States
Synopsis
The MR dispersion imaging (MRDI) has shown great promise in prostate DCE-MRI, but there still exist practical limitations due to the complex model fitting. We evaluate fitting uncertainties and errors in parameter estimation for MRDI and recently proposed modified MRDI (mMRDI). We use the time-concentration curves derived from 94 prostate cancer lesions for fitting uncertainties and errors and assess the ability to delineate between cancerous and normal prostate tissues.
Introduction
Dynamic contrast-enhanced MRI (DCE-MRI) has great potential to improve the specificity in the diagnosis of prostate cancer (PCa). Magnetic resonance dispersion imaging (MRDI) 1,2, was recently proposed to be able to characterize the microvascular architecture through an intravascular dispersion parameter, but the complexity of model fitting sometimes increases uncertainties in parameter estimation. A variation of MRDI, called modified MRDI (mMRDI) 3, was proposed to reduce the model fitting complexity and showed a great promise in prostate DCE-MRI. In this work, we evaluate fitting uncertainties and errors in parameter estimation. Both MRDI and mMRDI were compared with the standard Toft model using 53 prostate DCE-MRI cases. We used the time-concentration curves (TCCs) derived from different types of prostate tissue for fitting uncertainties and errors and assessed the ability of DCE parameters from different pharmacokinetic (PK) models to delineate between cancerous and normal prostate tissues.Methods
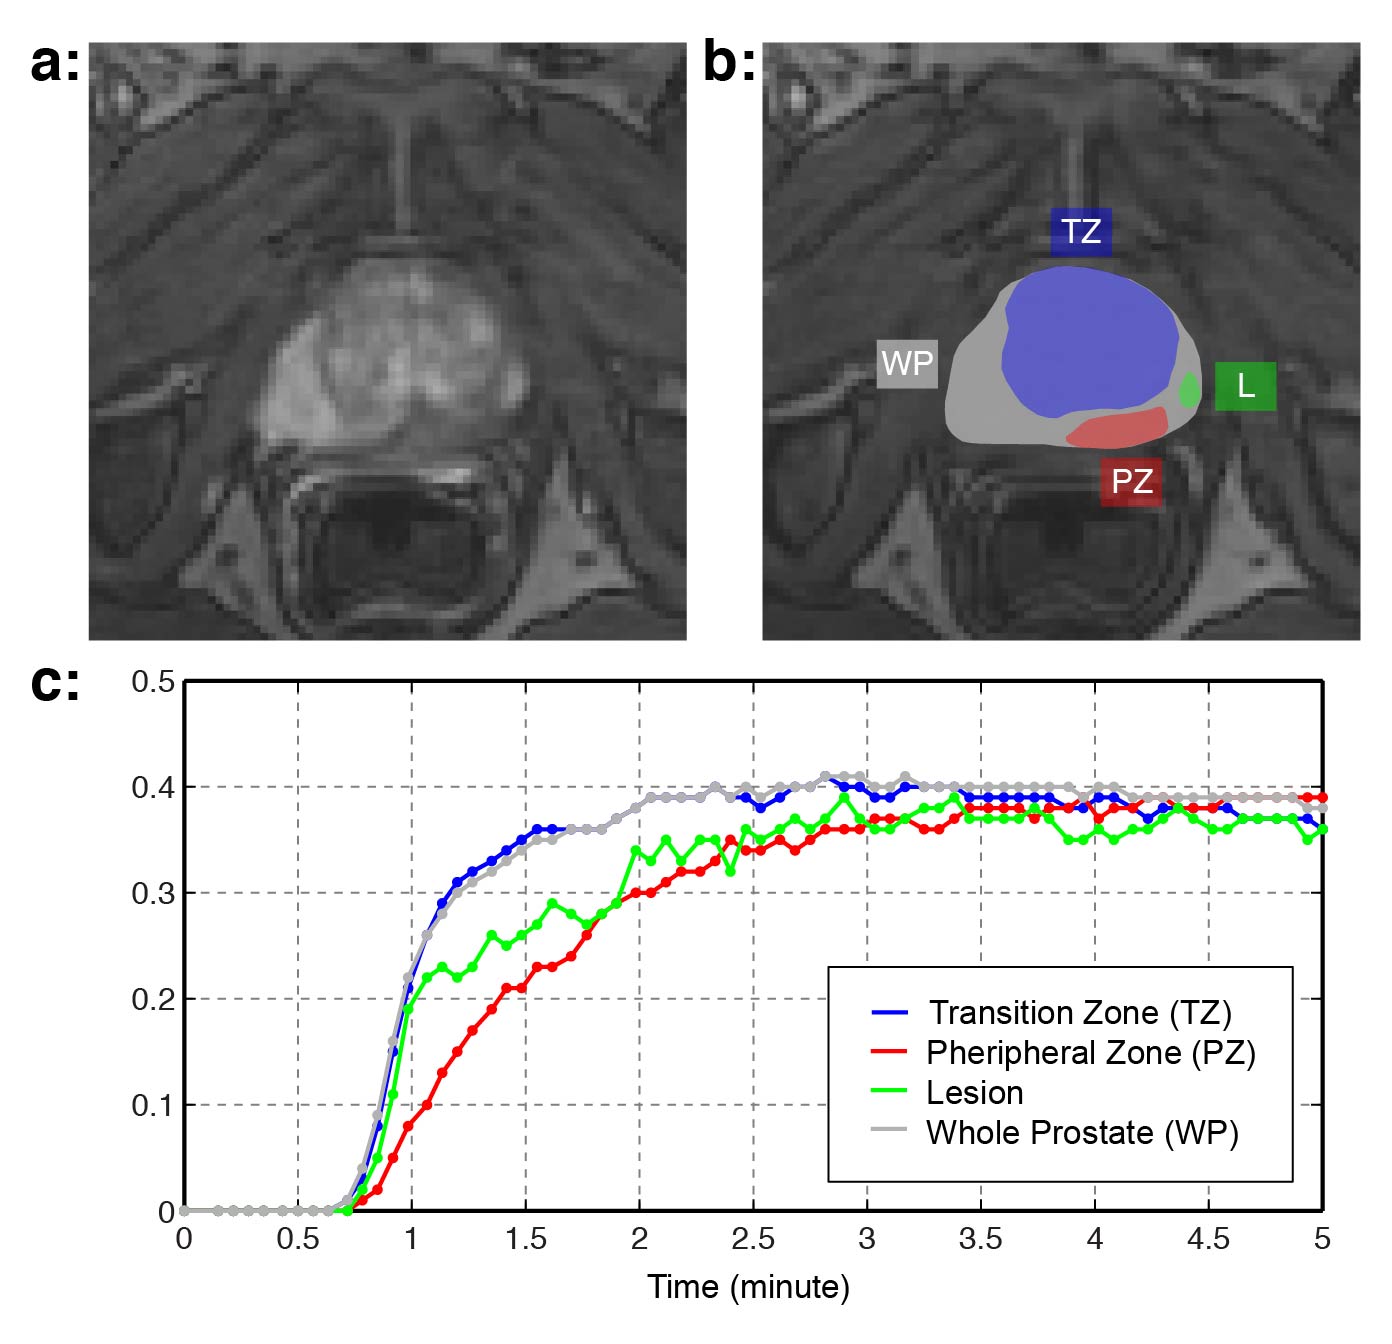
DCE-MRI from 53 patients who later underwent radical prostatectomy were included for evaluation. All imaging was performed on 3T MRI scanners (Trio/Skyra/Prisma Siemens Healthcare), and 94 lesions were identified from genitourinary radiologists and were later confirmed by the corresponding wholemount histopathology (WMHP). Each lesion (L) was categorized into three: low-grade PCa (GS=6), high-grade PCa (GS>6), and false positive (FP) in transition and peripheral zones (Fig 1). Normal tissues in different prostatic zones (TZ: Transition Zone, PZ: Peripheral Zone, and WP: Whole Prostate) were also manually defined, resulting in four types of TCCs for each lesion (L, TZ, PZ, WP).
For comparison, we used the standard Toft model 4 with two population-averaged AIFs, including Weinmann 5 and Parker 6. The Weinmann AIF inherently represents high intravascular dispersion while the Parker AIF represents low intravascular dispersion. The proposed mMRDI model can be described as, $$C_t(t) = K^{trans} \int_0^t{C_p^{mMRDI}(t')e^{-k_{ep}(t-t')}dt', }$$ where $$$C_p^{mMRDI}(t,\beta)=C_p(t)\star \frac{1}{\beta}e^{-t/\beta}.$$$ We used the Parker AIF for Cp(t), and the intravascular dispersion factor β was directly fitted to TCC along with Ktrans and kep.
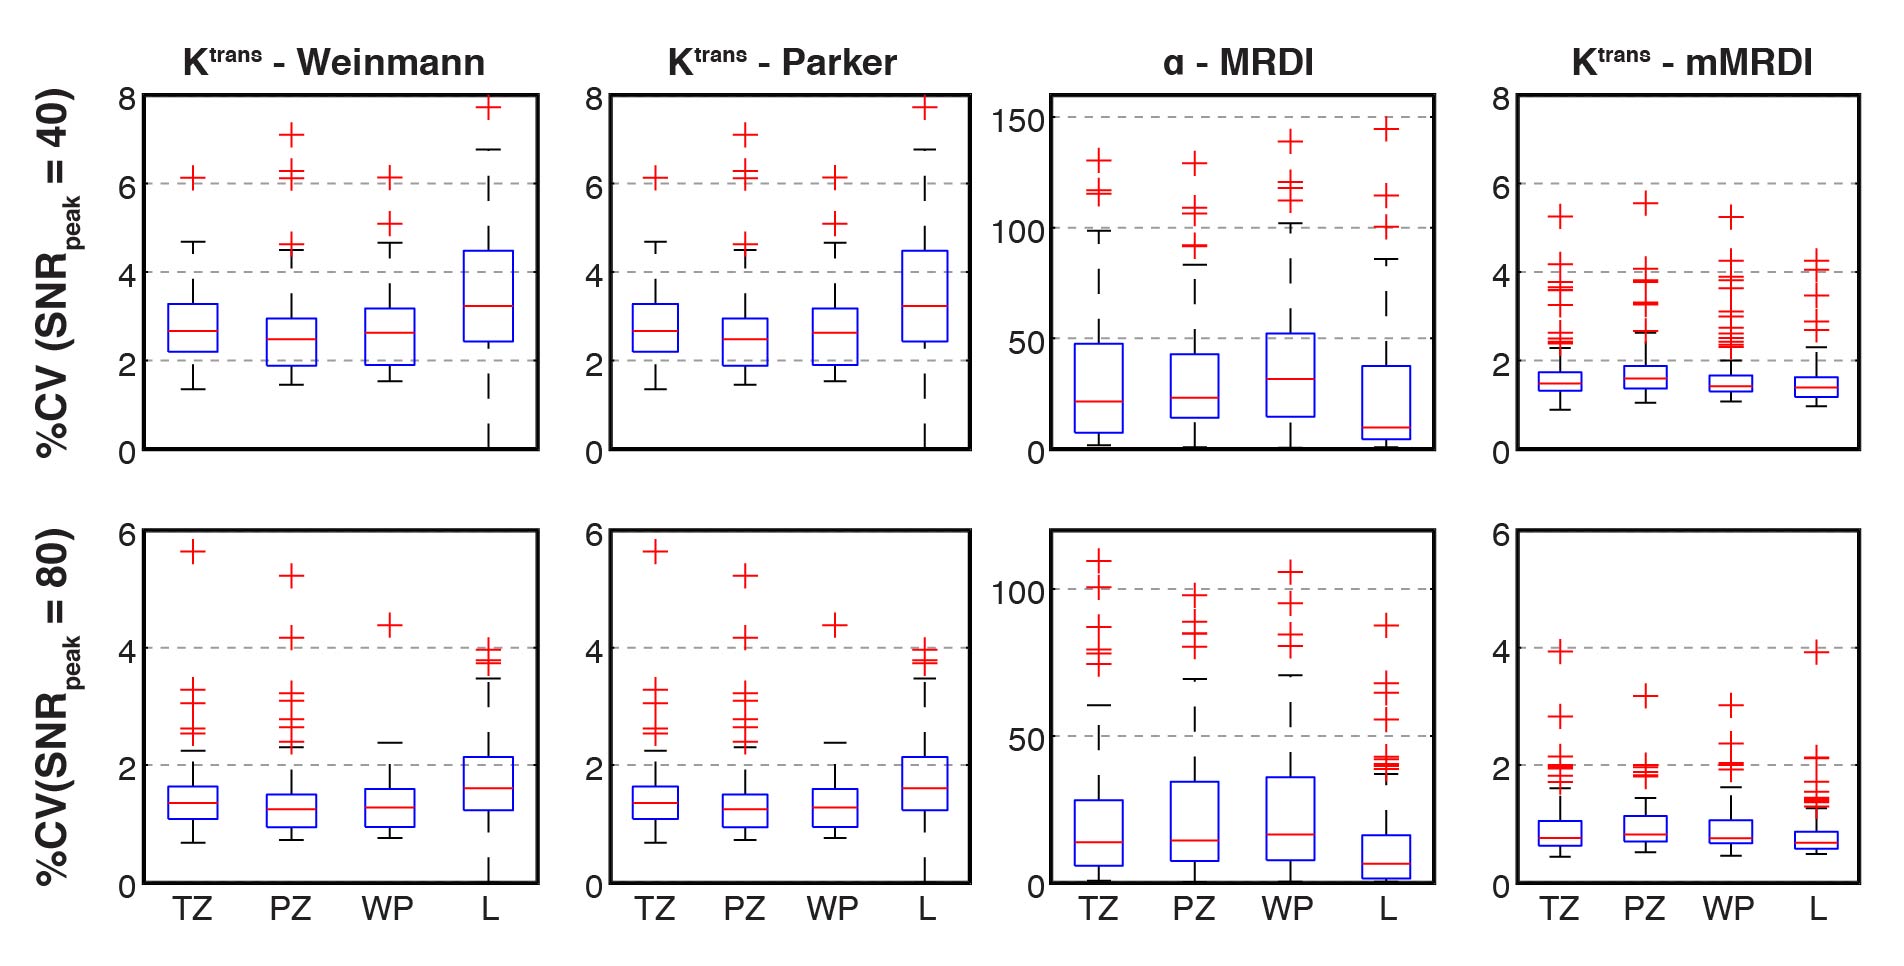
Fitting Uncertainty: Random Gaussian noise was added to TCCs to test fitting uncertainties. The low and high levels of noise were added based on peak SNR (SNRpeak), defined by TCCpeak/σ. The coefficient of variation (%CV = SD/mean x 100) was calculated for each DCE parameter based on 100 iterations.
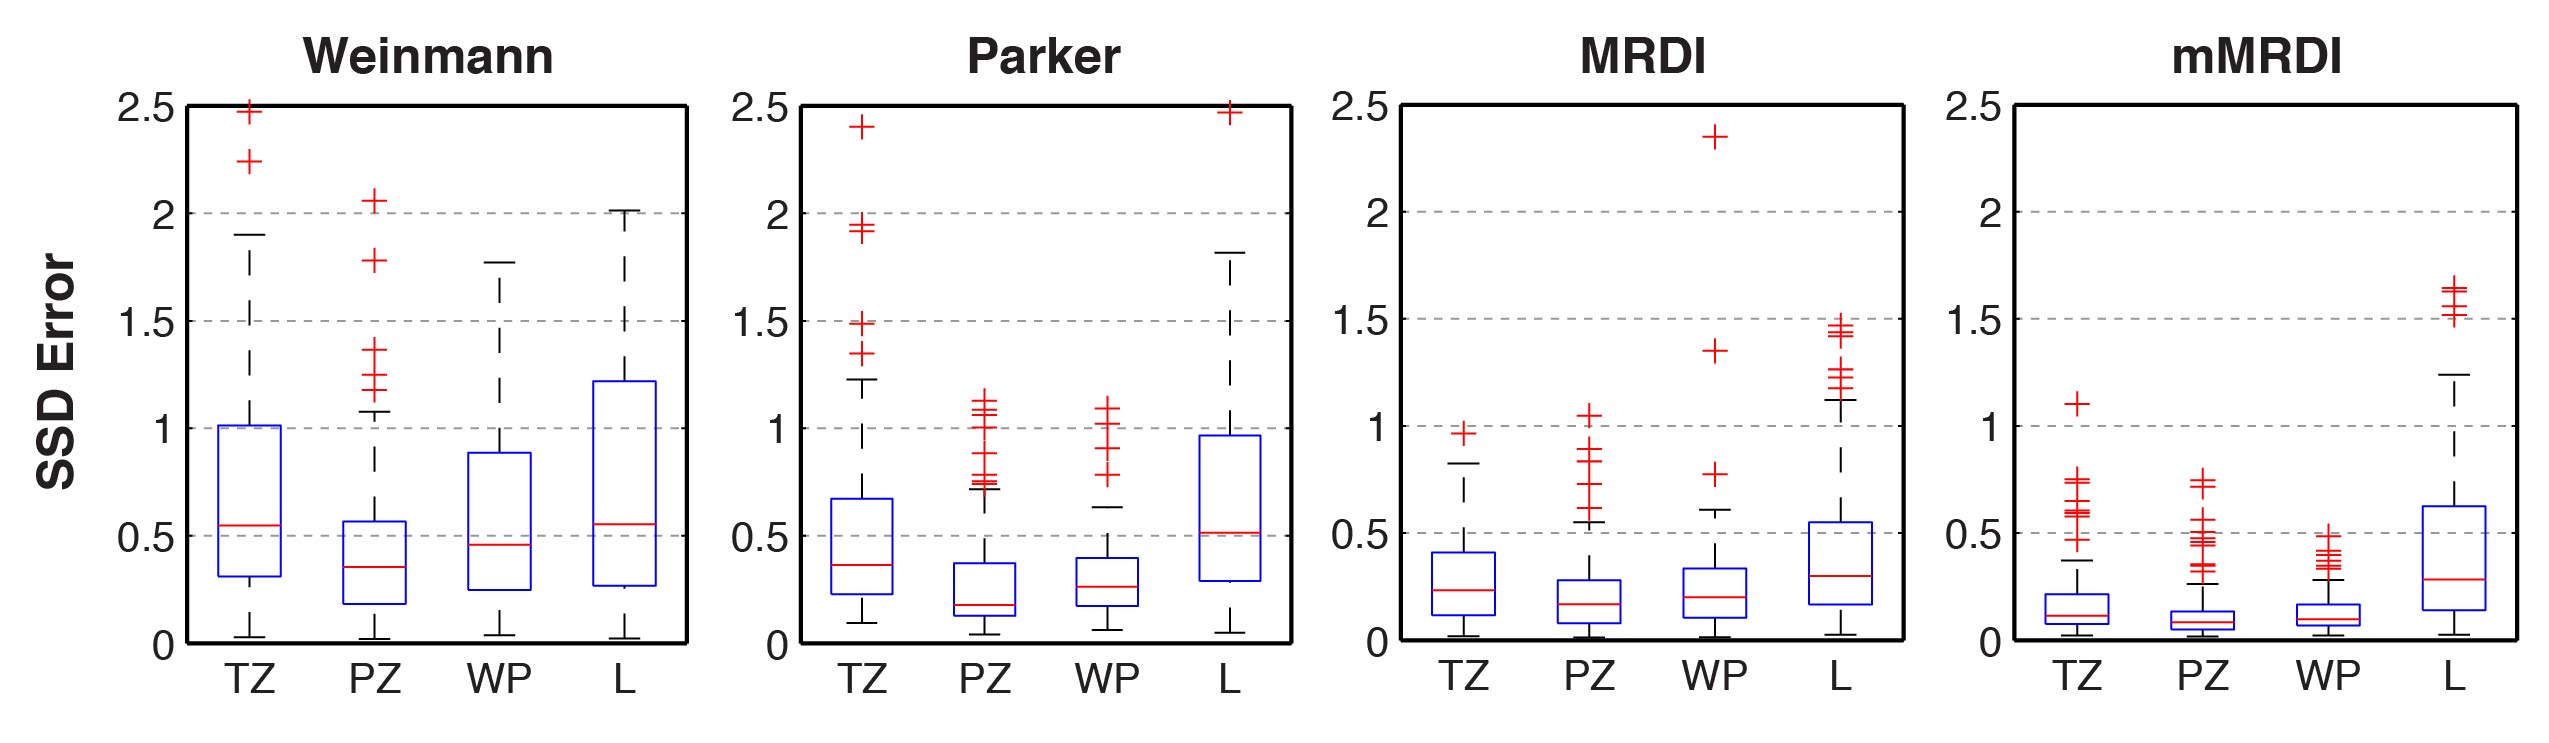
Parameter Fitting Error: Fitting errors were measured for all 94 lesions by the sum of squares due to error (SSD), $$$SSD=\sum_{i=1}^n{(C_t(i)-\hat{C_t}(i))^2}$$$ , where $$$ \hat{C_t}(i) $$$is the fitted TCC based on a PK model.
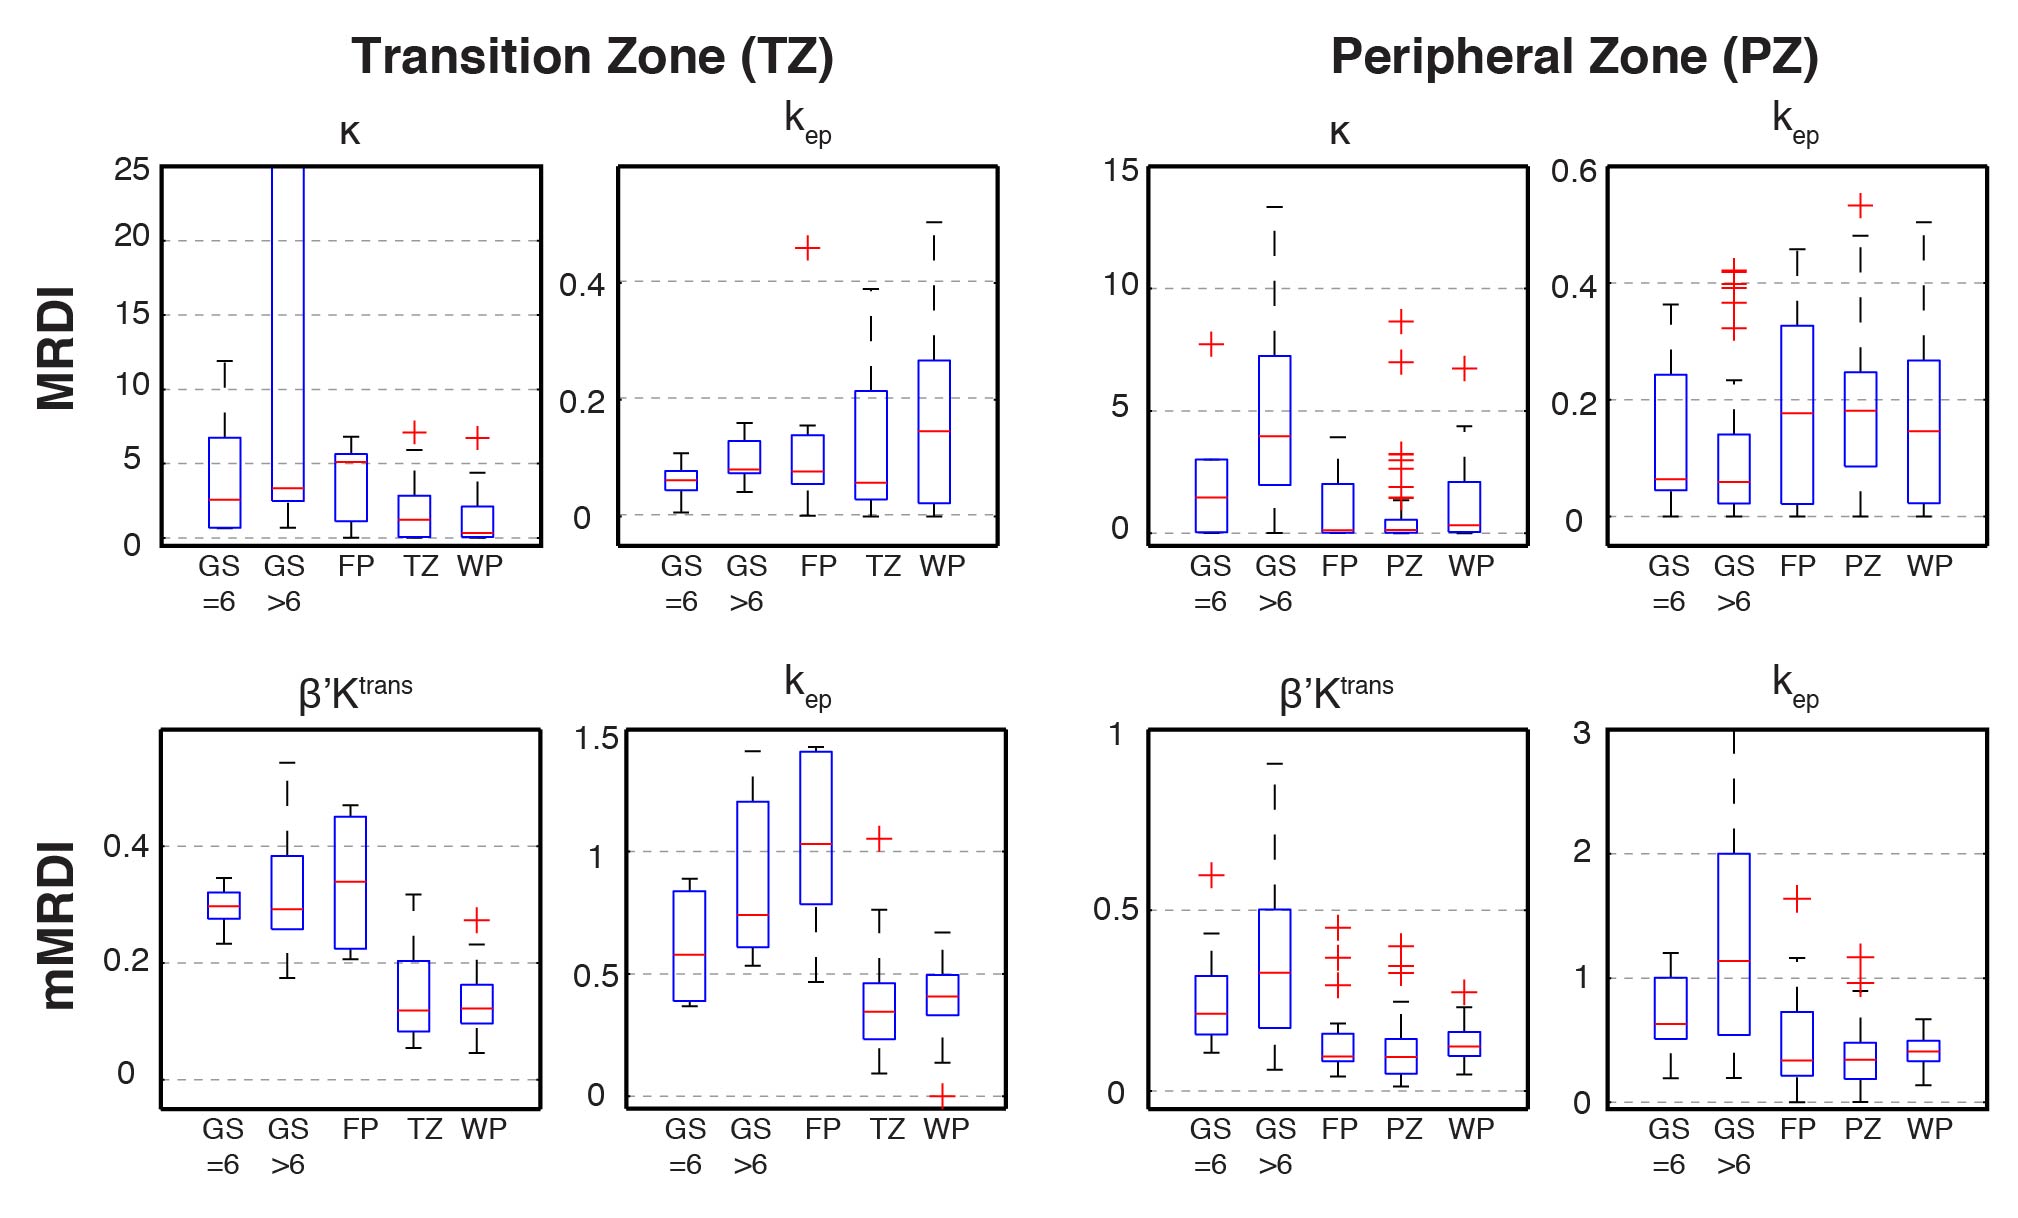
Prostate Cancer Classification: The DCE parameters derived from MRDI and mMRDI were tested by the ability to delineate different PCa lesions (low-grade, high-grade, and FP) in both TZ and PZ. The total number of lesions tested in this study was 6, 10, and 7 for low-grade PCa, high-grade PCa and FP in TZ, and 15, 39 and 17 in PZ.
Results and Discussion
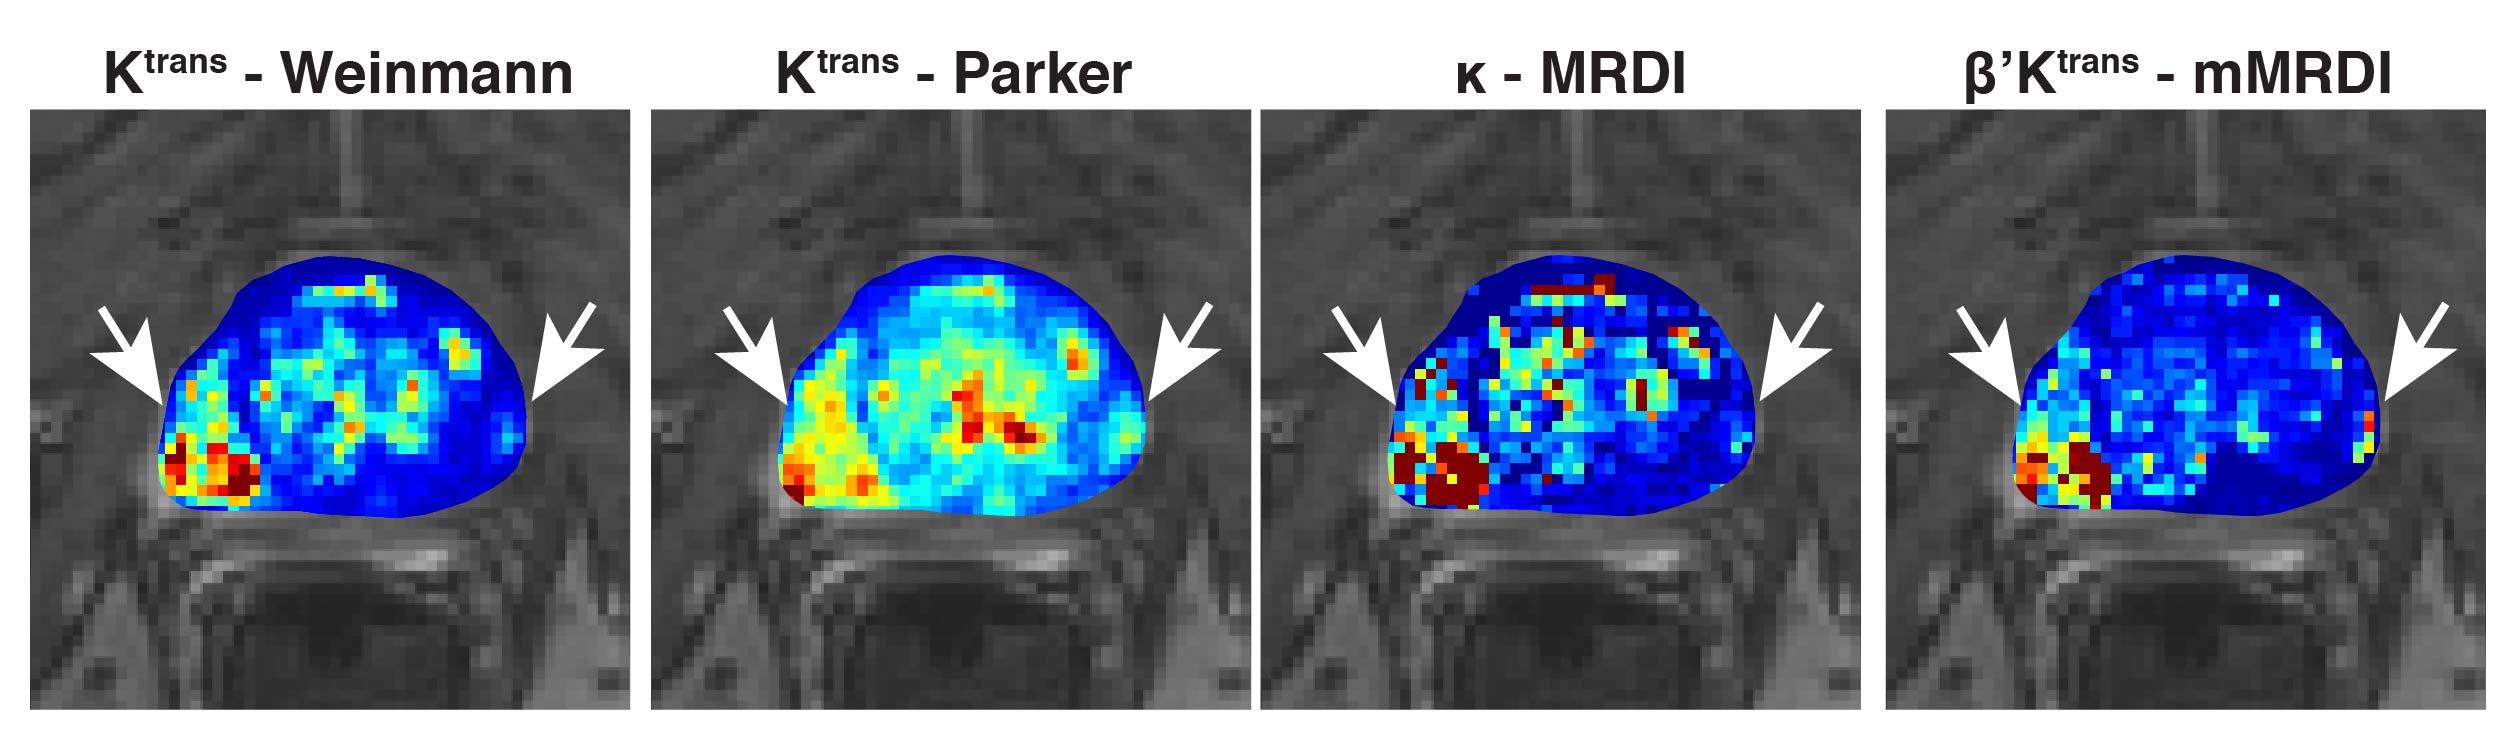
Fig. 2 contains %CVs for high noise (SNRpeak = 40) and low noise (SNRpeak = 80) situations. In both situations, mMRDI has the lowest %CV, while MRDI has the highest variations (note that the y-axis is different for MRDI). This is mainly due to the high model complexity of MRDI, causing significant uncertainty in the DCE parameters. Fig. 3 shows the parameter fitting errors, and both MRDI and mMRDI have lower fitting errors than the models with population-averaged AIFs. This is due to the addition of intravascular dispersion to the PK model, and particularly, mMRDI has the lowest fitting errors in the normal tissue types (TZ, PZ, and WP). Fig. 4 shows the excellent contrast between normal and PCa using MRDI and mMRDI. The DCE parameters derived from mMRDI were better to delineate between cancerous and normal prostate tissue than those from MRDI, probably due to improved fitting errors, also shown as pixel-by-pixel maps (Fig. 5).Conclusion
We showed the mMRDI model could achieve the minimal fitting uncertainties and errors due to the low model complexity, and the improved contrast between prostate cancer and normal tissue.Acknowledgements
This study was supported in part by Siemens Healthcare.References
1. Kuenen MPJ, Saidov T a, Wijkstra H, Mischi M: Contrast-ultrasound dispersion imaging for prostate cancer localization by improved spatiotemporal similarity analysis. Ultrasound Med Biol 2013, 39:1631–41.
2. Mischi M, Turco S, Lavini C, Kompatsiari K, de la Rosette JJ, Breeuwer M, Wijkstra H. Magnetic resonance dispersion imaging for localization of angiogenesis and cancer growth. Invest Radiol. 2014 Aug;49(8):561-9.
3. Sung K, X Zhong X, Wu H. Modified Dispersion Model in Prostate Dynamic Contrast-Enhanced MRI. Proceedings ISMRM Twenty-Fifth Scientific Sessions, 2017. p4797.
4. Tofts PS, Brix G, Buckley DL, Evelhoch JL, Henderson E, Knopp M V, Larsson HB, Lee TY, Mayr N a, Parker GJ, Port RE, Taylor J, Weissko RM: Estimating kinetic parameters from dynamic contrast-enhanced T(1)-weighted MRI of a di usable tracer: standardized quantities and symbols. J Magn Reson Imaging 1999, 10:223–32.
5. Weinmann HJ, Laniado M, Mützel W. Pharmacokinetics of GdDTPA/dimeglumine after intravenous injection into healthy volunteers. Physiol Chem Phys Med NMR. 1984;16(2):167-172.
6. Parker GJM, Roberts C, Macdonald A, et al. Experimentally-derived functional form for a population-averaged high-temporal-resolution arterial input function for dynamic contrast-enhanced MRI. Magn Reson Med. 2006;56(5):993-1000.
Figures