4508
The diagnostic potential and repeatability of Relative Enhanced Diffusivity (RED) as a biomarker for prostate cancer1Department of Circulation and Medical Imaging, NTNU, Norwegian University of Science and Technology, Trondheim, Norway, 2St. Olavs Hospital, Trondheim University Hospital, Trondheim, Norway, 3Department of Radiology and Nuclear Medicine, St. Olavs Hospital, Trondheim University Hospital, Trondheim, Norway, 4Department of Cancer Research and Molecular medicine, NTNU, Norwegian University of Science and Technology, Trondheim, Norway, 5Department of Urology, St. Olavs Hospital, Trondheim University Hospital, Trondheim, Norway
Synopsis
Relative Enhanced Diffusivity (RED) expresses the relative change in ADC between lower and higher b-value regimes. The purpose of this study was to investigate the diagnostic potential and repeatability of RED as a biomarker for prostate cancer (PCa).
Ten (10) healthy volunteers and 28 high-risk patients diagnosed with PCa underwent diffusion-weighted MRI. For the healthy volunteers, the repeatability of RED was good to acceptable. For the patients, RED was able to discriminate tumors from healthy tissue in the peripheral zone using either b=50 or b=400 mm/s2 as the intermediate b-value (p < 0.001).
Introduction
The mathematical model underlying the calculation of apparent diffusion coefficient (ADC) maps assumes mono-exponential signal decay as a function of b-value due to pure diffusion of water molecules. In reality, however, most tumors also have a perfusion component that contributes to signal decay at lower b-values, resulting from microcirculation of blood in the capillary network.1 Our group recently introduced a novel marker for breast cancer microcirculation called Relative Enhanced Diffusivity (RED),2 which expresses the relative change in ADC between lower and higher b-value regimes. The purpose of this study was to investigate the diagnostic potential and repeatability of RED as a biomarker for prostate cancer.
Methods
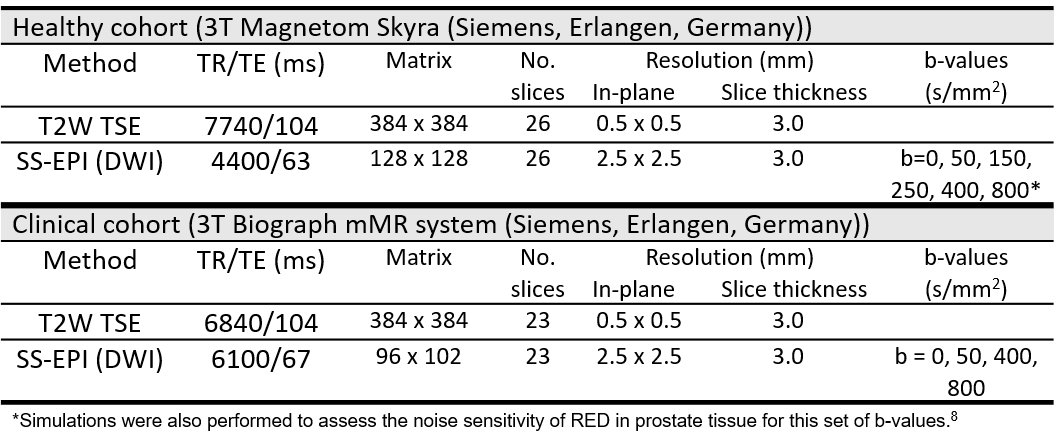
This study included a healthy and a clinical cohort. The MR acquisition protocols are described in Table 1. The healthy cohort consisted of 10 healthy, asymptomatic volunteers (median (range) age 31 (24-43) years) scanned on 3 different days. The median interval between scans 1 and 2, and 2 and 3, was 12 and 15 days, respectively. T2-weighted (T2W) images were used as a reference to place 4 circular regions-of-interest (ROIs) (diameter 8 mm) in both the peripheral zone and central gland in the b=0 diffusion-weighted images.
The clinical cohort consisted of 28 patients (median (range) age 66 (55-72) years) diagnosed with high-risk prostate cancer who underwent PET/MRI before radical prostatectomy. Tumors, benign lesions and healthy tissue ROIs were outlined on T2W images guided by whole mount histopathology slices marked by an uropathologist. These images were then used as a reference to place circular ROIs (8 mm diameter) in healthy tissue and tumors of the peripheral zone (n=33) and central gland (n=7) in the ADC-map.
RED values were calculated as2 $$$RED=100\times (\frac{RED_{low}}{RED_{high}} -1)$$$, where ADClow was calculated between b=0 s/mm2 and the intermediate b-value (i.e. b=50, 150, 250 or 400 for the healthy volunteers, and b=50 or 400 for the patients), and ADChigh between the intermediate b-value and b=800. ADC values using all b-values were also calculated for the clinical cohort.
The coefficient of variation (CoV) was calculated to assess the repeatability of RED in the healthy cohort, and receiver-operating curve (ROC) analysis was used to assess the performance for discriminating between healthy tissue and tumors in the clinical cohort. The significance of differences between tumor and healthy tissue was tested with paired t-tests. The correlation between RED and ADC was assessed using Pearson’s correlation coefficient. All analysis was performed in MATLAB (Mathworks, Natick, MA, USA).
Results
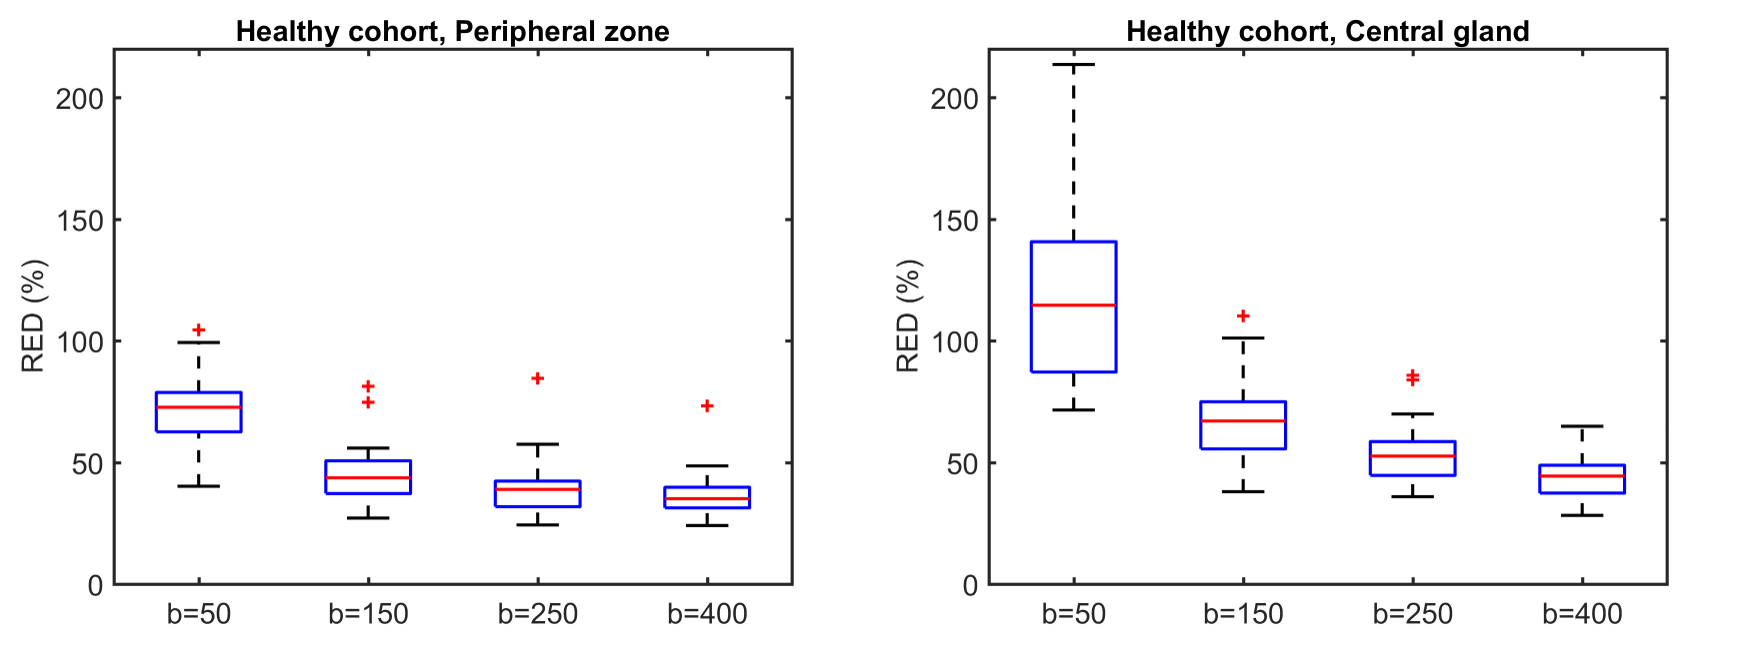
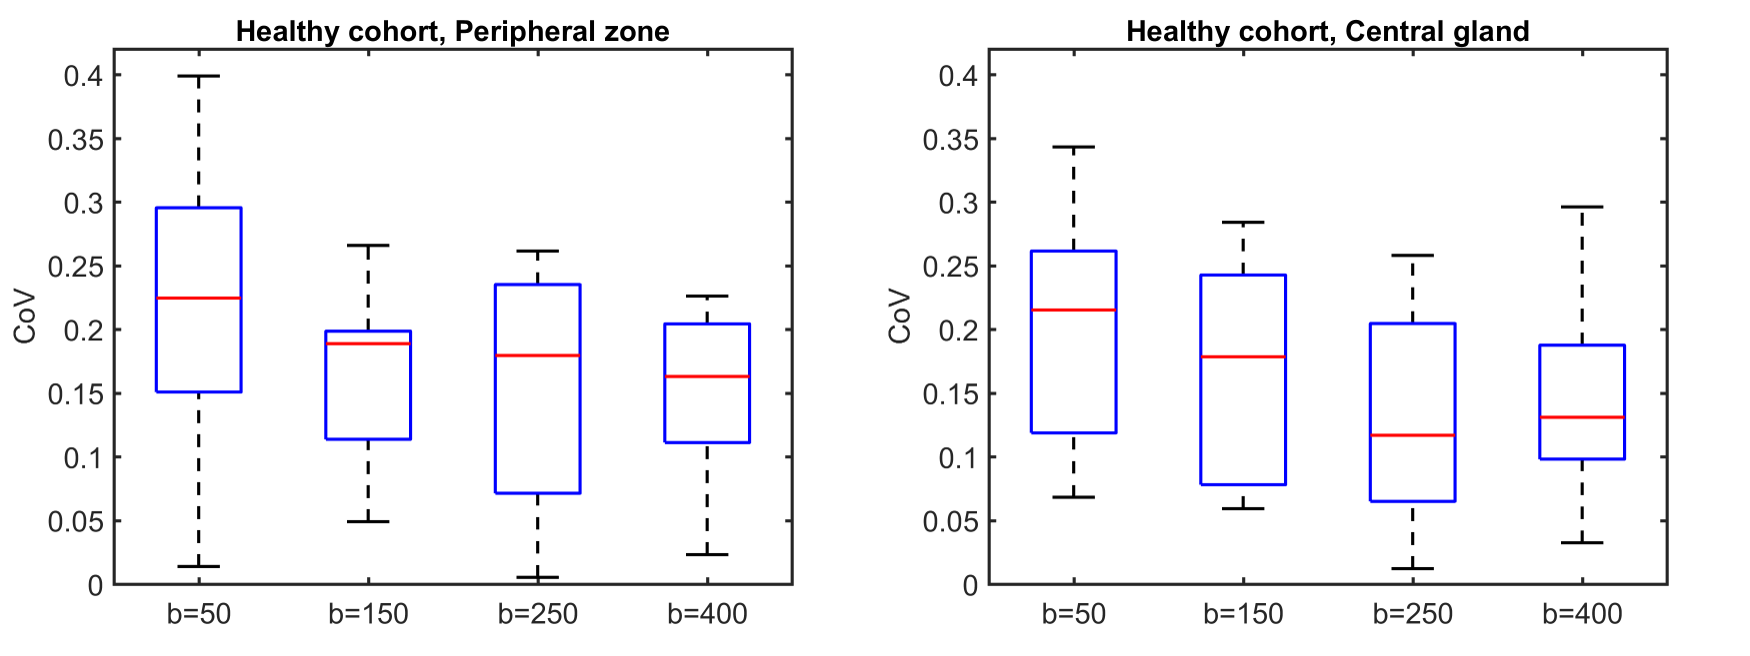
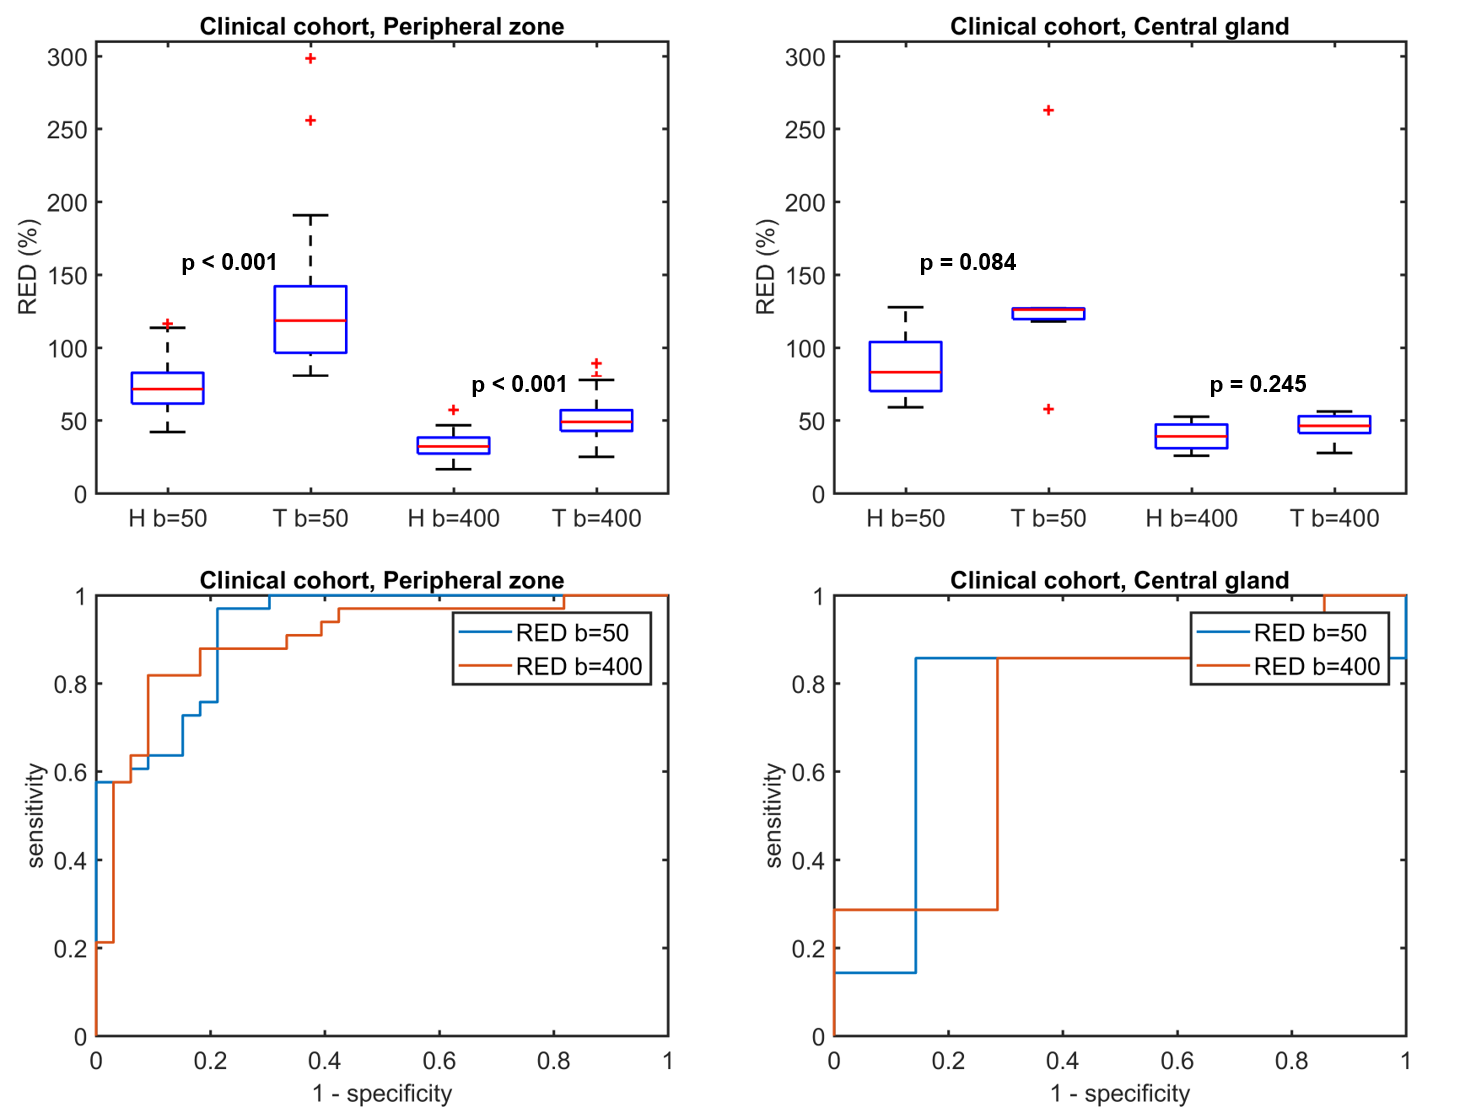
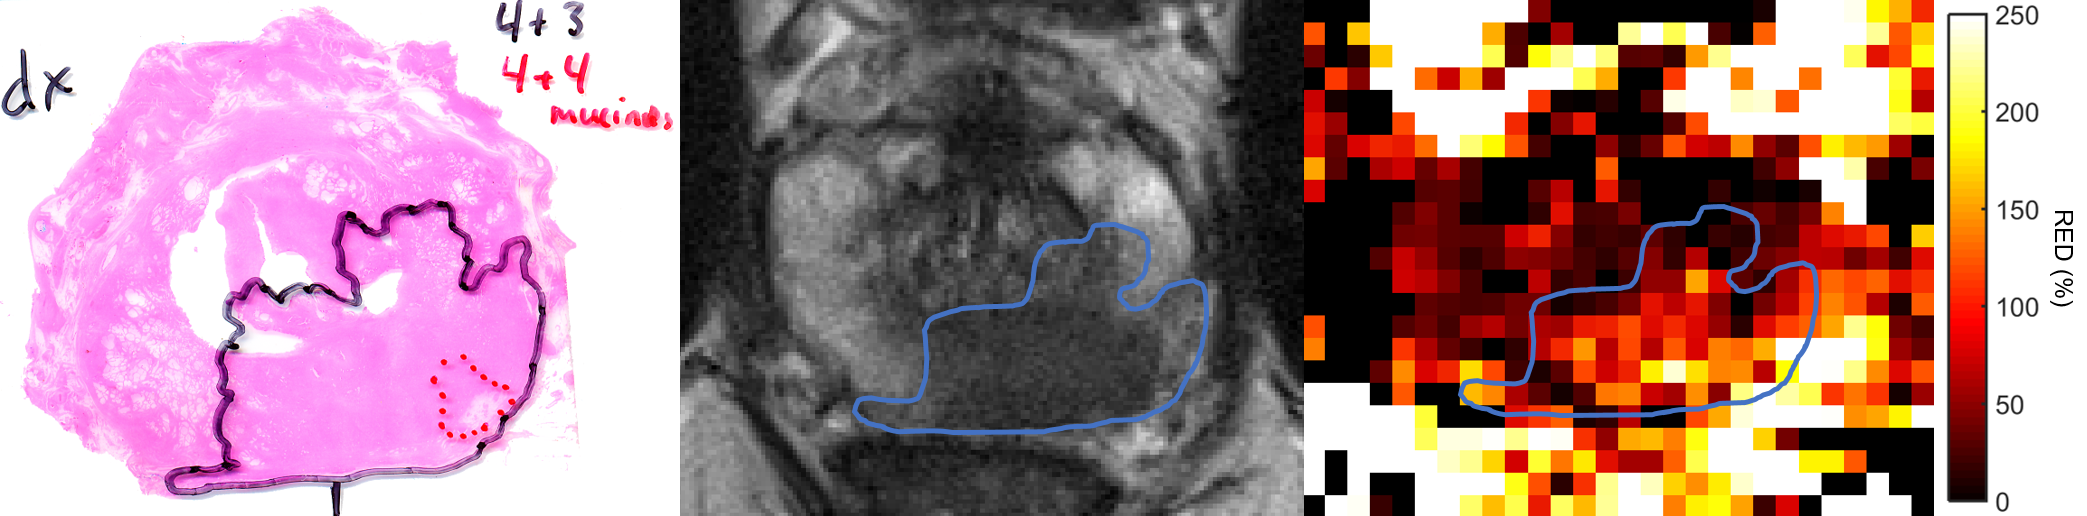
Figure 1 shows RED as a function of intermediate b-value in the healthy cohort. The highest values were observed at the lowest intermediate b-value, indicating the highest sensitivity to perfusion. The repeatability was good (0.1-0.2) to acceptable (0.2-0.3) for all intermediate b-values tested (Figure 2).3 Larger differences in RED between healthy and tumor tissue were observed with an intermediate b-value of b=50 than for b=400, which is also reflected by the ROC curves (Figure 3). A RED parametric map besides a T2W image is shown in Figure 4. A moderate negative correlation was observed between RED (b=50) and ADC values (ρ=-0.53, p<0.05), which indicates that the parameters probe distinct physiological processes.Discussion
We found that RED has good to acceptable repeatability, with the lowest CoV for an intermediate b-value of b=250, although the differences were not significant. A limitation of this study was the limited number of b-values in the clinical cohort, so we could not assess the diagnostic potential of this intermediate b-value.
RED using b=50 as the intermediate b-value performed slightly better than b=400 for discriminating between healthy tissue and tumors in the clinical cohort, but had arguably slightly worse repeatability in the healthy cohort. The best option for an intermediate b-value might therefore be somewhere in between, which is subject of ongoing research.
There is an ongoing discussion on the value of dynamic contrast-enhanced (DCE) MRI for detection and staging of primary prostate cancer.4 The IVIM model5 has been proposed as an alternative to probe tissue microvasculature,6,7 but typically requires ≥6 b-values. RED can also be regarded as a surrogate measure of tissue microvasculature, and requires only 3 b-values. In future studies we will investigate how RED relates to perfusion measurements from DCE MRI and IVIM.8
In contrast to the peripheral zone, no significant differences between healthy tissue and cancer were found in the central gland. However, there were only a limited number of central gland tumors in this small clinical cohort. Another limitation was that only high-risk patients were included. Nevertheless, these results provide a solid basis for further investigation of the value of RED in larger and more heterogeneous prostate cancer cohorts.
Conclusion
RED is a repeatable biomarker that may have value for prostate cancer diagnosis.Acknowledgements
No acknowledgement found.References
1. Le Bihan D, Turner R. The capillary network: a link between IVIM and classical perfusion. Magn Reson Med. 1992;27(1):171-8.
2. Teruel JR, Goa PE, Sjobakk TE, et al. A Simplified Approach to Measure the Effect of the Microvasculature in Diffusion-weighted MR Imaging Applied to Breast Tumors: Preliminary Results. Radiology. 2016;281(2):373-81.
3. Kakite S, Dyvorne H, Besa C, et al. Hepatocellular carcinoma: short-term reproducibility of apparent diffusion coefficient and intravoxel incoherent motion parameters at 3.0T. J Magn Reson Imaging. 2015;41(1):149-56.
4. De Visschere P, Lumen N, Ost P, et al. Dynamic contrast-enhanced imaging has limited added value over T2-weighted imaging and diffusion-weighted imaging when using PI-RADSv2 for diagnosis of clinically significant prostate cancer in patients with elevated PSA. Clin Radiol. 2017;72(1):23-32.
5. Turner R, Le Bihan D, Maier J, et al. Echo-planar imaging of intravoxel incoherent motion. Radiology. 1990;177(2):407-14.
6. Yang DM, Kim HC, Kim SW, et al. Prostate cancer: correlation of intravoxel incoherent motion MR parameters with Gleason score. Clin Imaging. 2016;40(3):445-50.
7. Valerio M, Zini C, Fierro D, et al. 3T multiparametric MRI of the prostate: Does intravoxel incoherent motion diffusion imaging have a role in the detection and stratification of prostate cancer in the peripheral zone? Eur J Radiol. 2016;85(4):790-4.
8. While PT, Teruel JR, Vidic I, Bathen TF, Goa PE. Relative
enhanced diffusivity: noise sensitivity, protocol optimization, and the
relation to intravoxel incoherent motion. Magn Reson Mater Phy. 2017 (in
press). https://doi.org/10.1007/s10334-017-0660-x
Figures