4507
Quantitative T2 in ex vivo prostate: relationship to microstructure and VERDICT MRI parameters1Centre for Medical Image Computing, University College London, London, United Kingdom, 2Department of Physics, Ryerson University, Toronto, ON, Canada, 3Centre for Advanced Biomedical Imaging, University College London, London, United Kingdom, 4Imaging, Francis Crick Institute, London, United Kingdom, 5Discipline of Medical Radiation Sciences, University of Sydney, Sydney, Australia, 6Centre for Medical Imaging, University College London, London, United Kingdom, 7Division of Surgery and Interventional Science, University College London, London, United Kingdom, 8Department of Urology, University College London Hospitals, London, United Kingdom, 9Department of Research Pathology, University College London, London, United Kingdom
Synopsis
Quantitative T2 and VERDICT diffusion MRI data were acquired in ex vivo prostate specimens, using a patient-specific mold to allow comparison with registered prostate images. Analysis indicated differences from in vivo T2 spectra, such as a single T2 component dominating the spectrum in most regions, but with longer T2 values where there was generally more lumen space. A small component with T2 of 10-20 ms was observed in some cancerous regions. The geometric mean of the T2 spectrum was inversely correlated with the intracellular fraction parameter from VERDICT and correlated with the diffusion coefficients of the Tensor component modelling the extracellular space.
Introduction
Several MRI methods aim to improve the specificity of prostate cancer diagnosis by relating MRI signal to tissue microstructure, eg.:
- LWI – Luminal Water Imaging produces a T2 spectrum from multi-echo data. Long T2s relate to luminal water in vivo1.
- VERDICT – Vascular Extracellular and Restricted DIffusion for Cytometry in Tumours2, uses a compartmental model to fit diffusion data. Restricted diffusion relates to cellular fraction on histology3.
Here we use a unique protocol with patient-specific molds4 to relate T2 findings ex vivo to registered histology and VERDICT parameters.
Methods
Five patients underwent radical prostatectomy. Prostates were placed into molds incorporating guides to align MR and histological image planes4. MRI was completed on unfixed specimens within 8 hours of surgery.
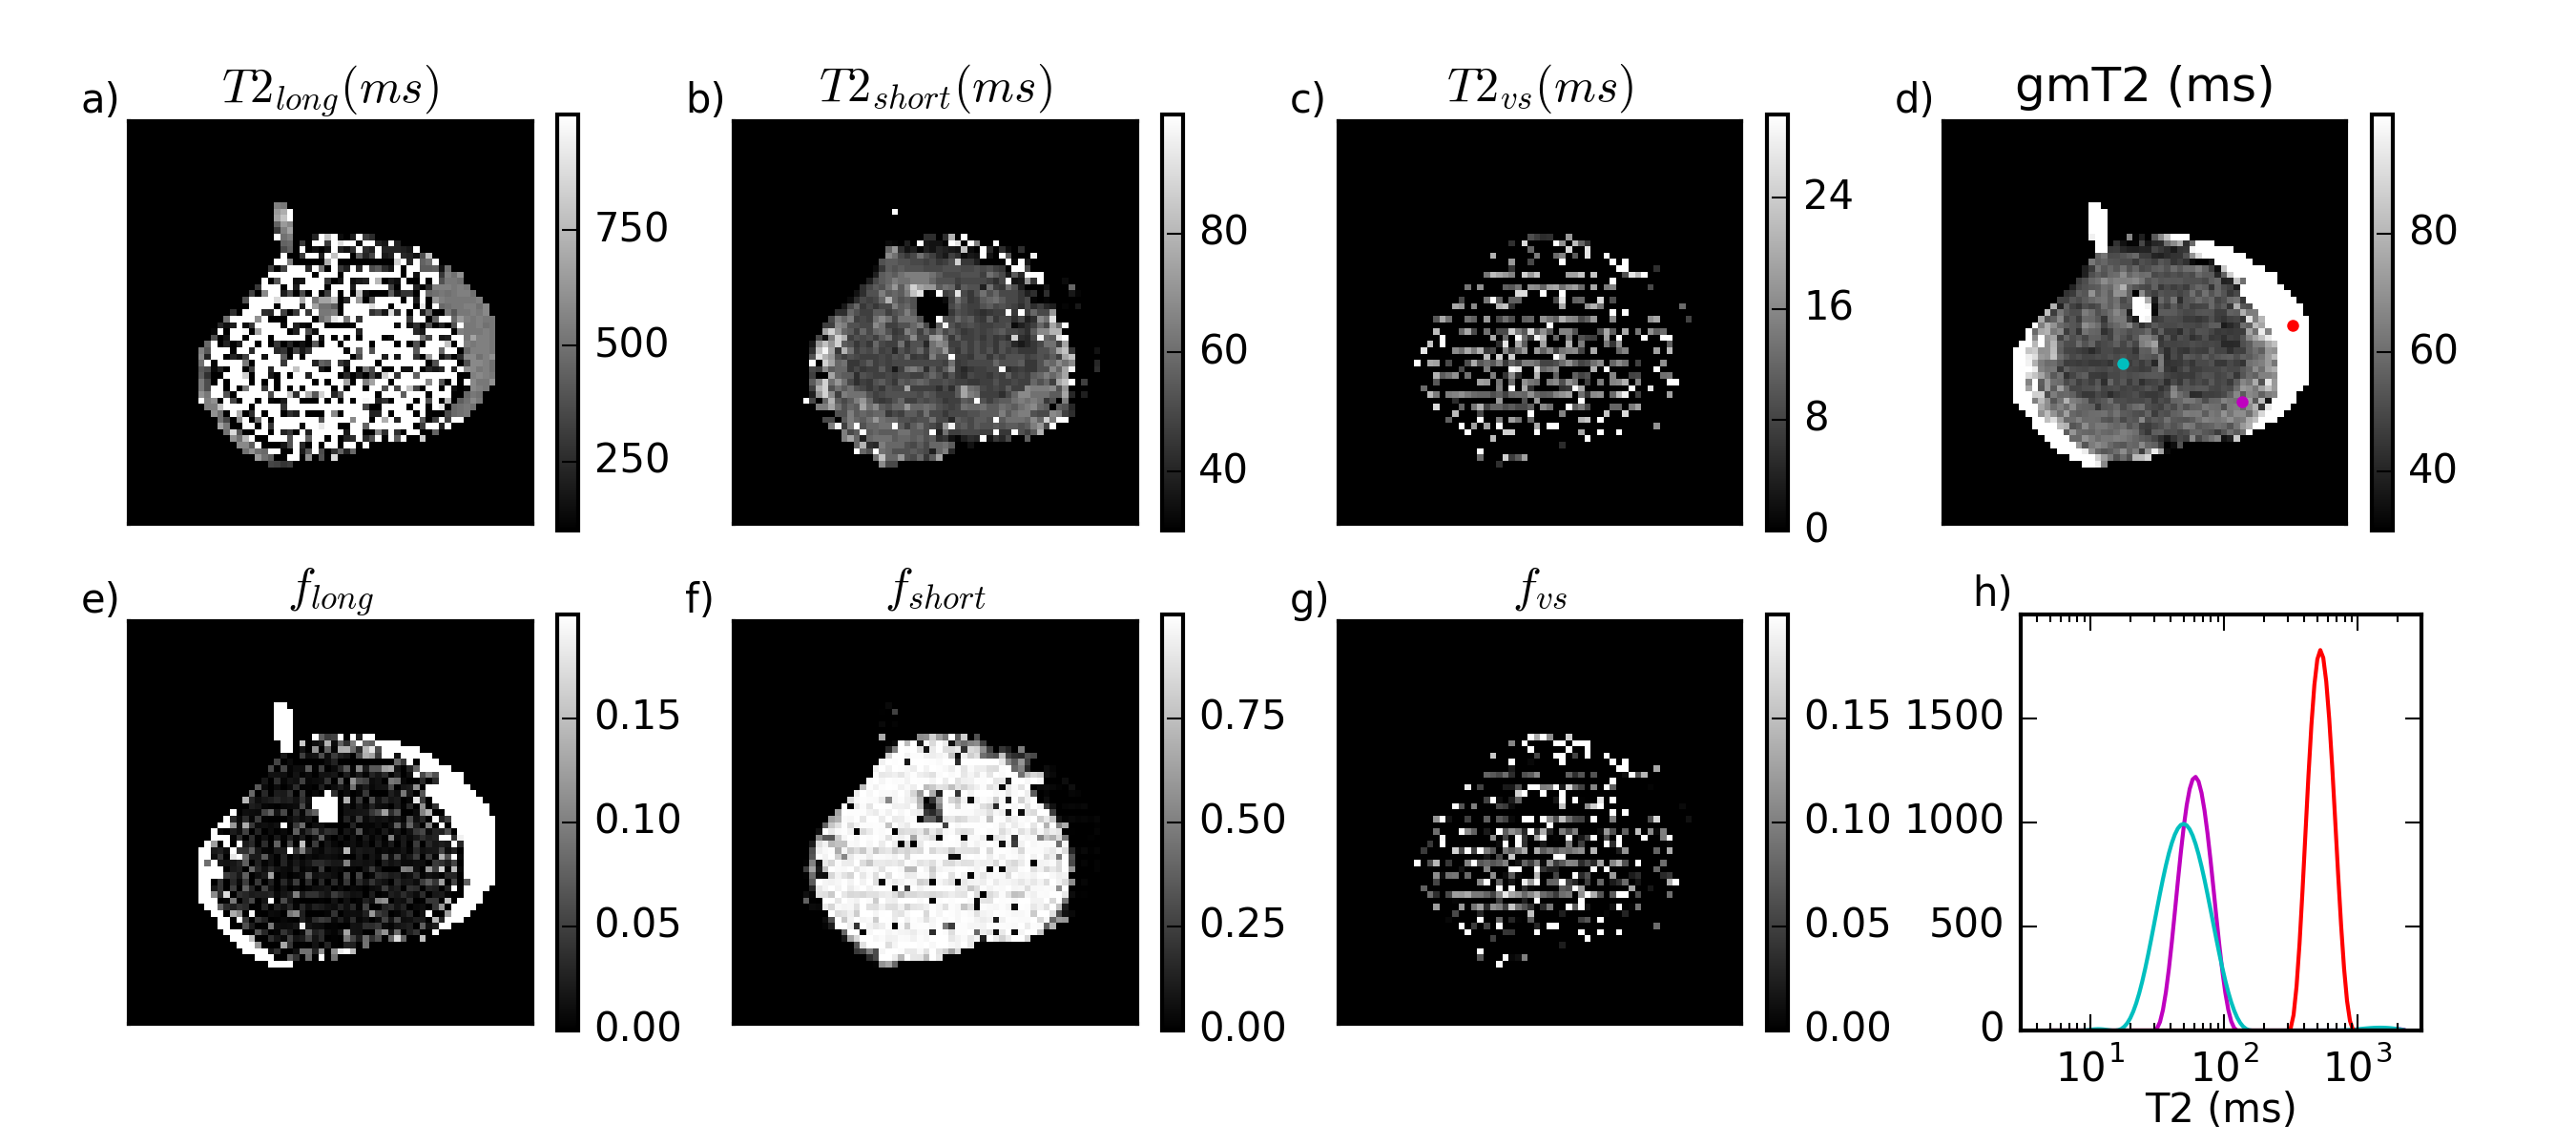
At 9.4 T (Varian), a multi-echo sequence (TE=3 ms, 96 echoes, TR = 2.2 s) was acquired for quantitative T2 (qT2) analysis. The final 94 echoes were fitted to a multi-exponential function (120 logarithmically-spaced values from 5-2200 ms) using regularized non-negative least squares1,5 to yield long, short and/or very short (vs) T2 components, each with a corresponding fraction of the total spectral area. The geometric mean of the T2 distribution is
$$gmT2=\sum_j \frac{S(T_{2j})ln(T_{2j})}{S(T_{2j})}$$
where S(T2j) is the height of the spectrum at T2j.
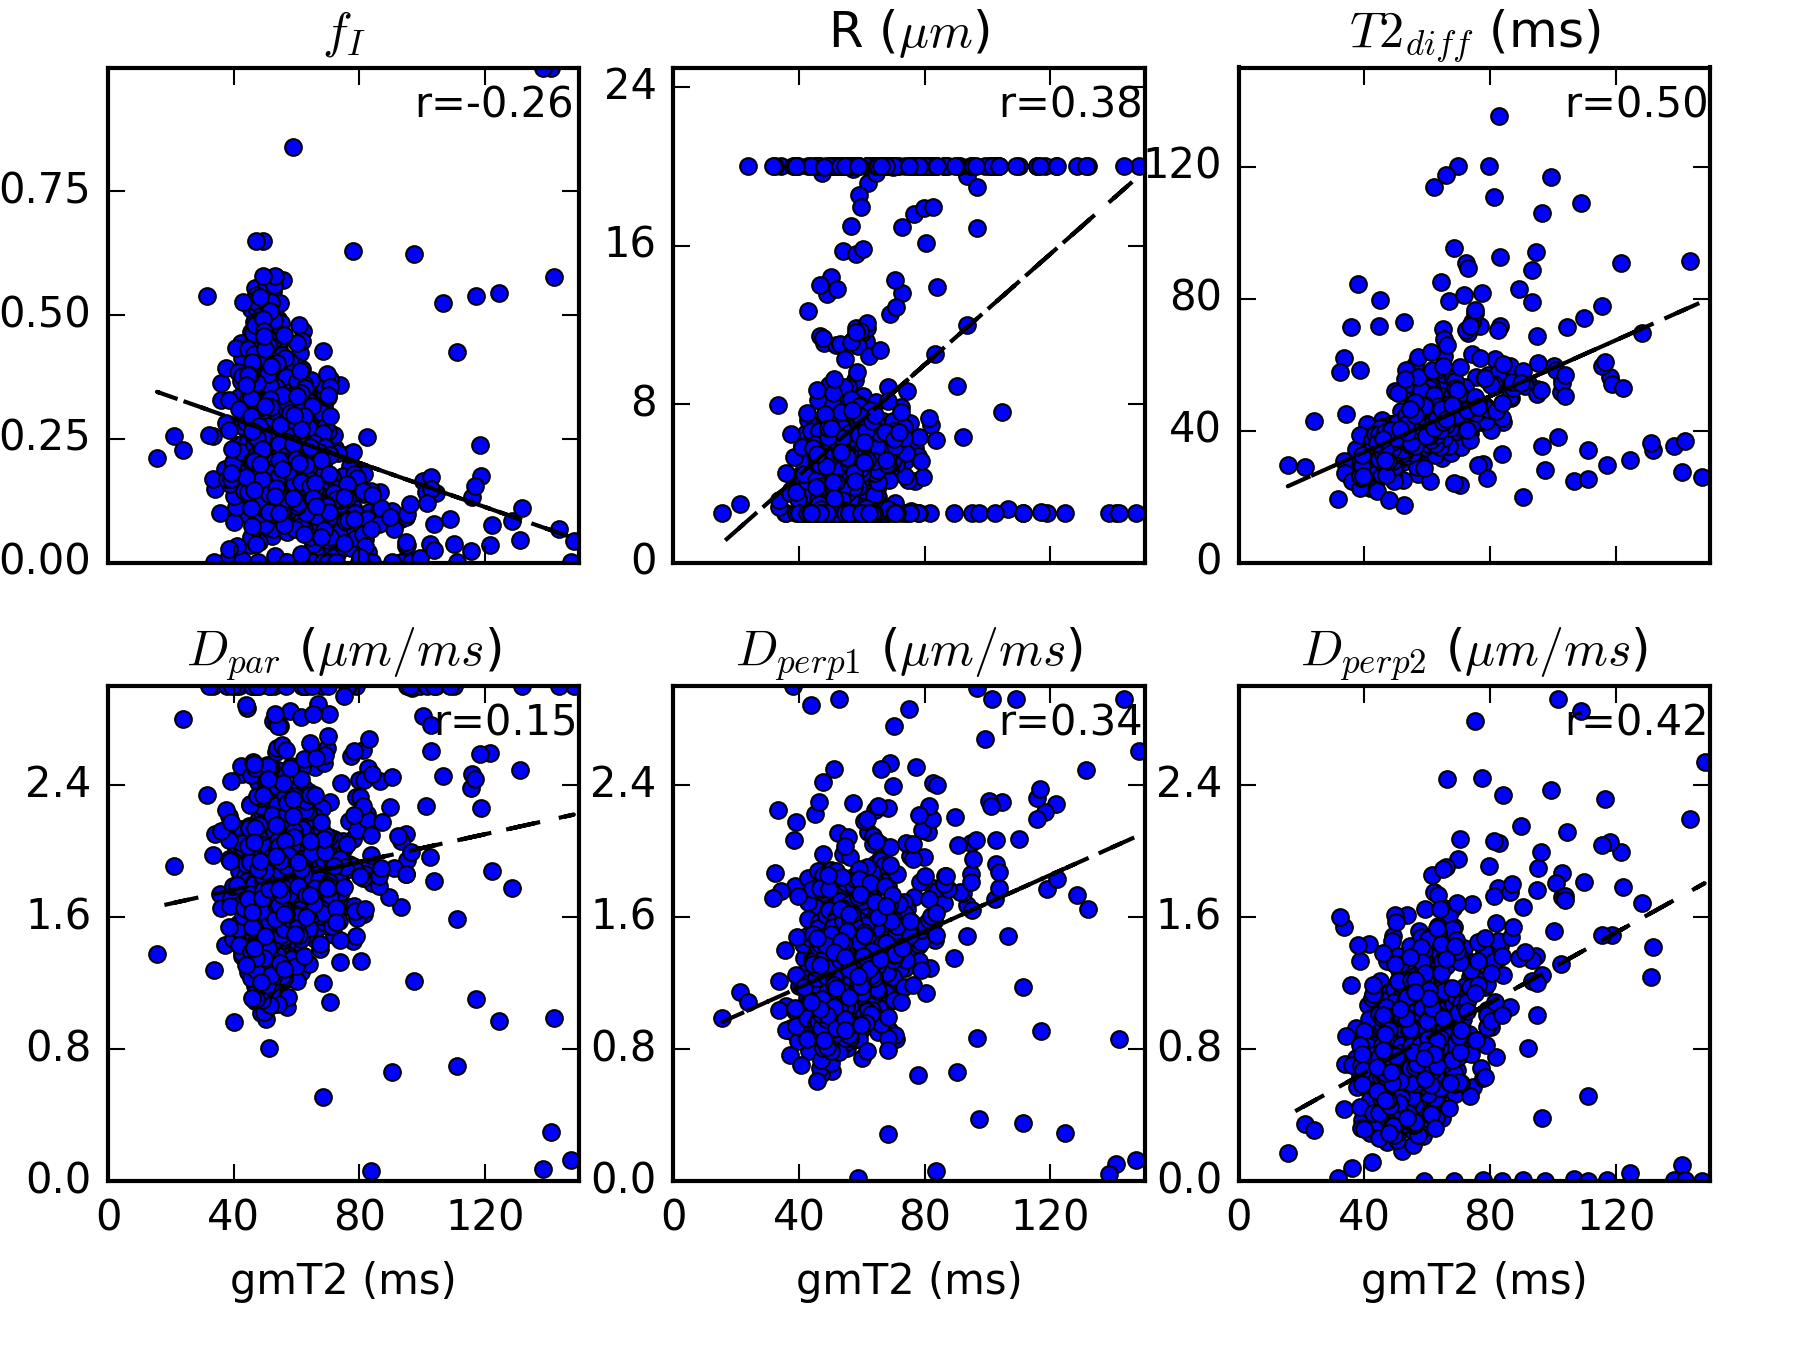
The VERDICT protocol3 consists of 21 PGSEs, b-values from 0-15,000 s/mm2 and gradient separations from 10-50 ms. Both qT2 and VERDICT protocols had 8 x 8 cm2 field of view, 2.5 mm thickness and 1.25 x 1.25 mm2 resolution. VERDICT data were analysed using a Tensor-Sphere model3,6, where the Tensor models diffusion in the extracellular space as anisotropic unrestricted diffusion and the Sphere models intracellular diffusion as isotropic restricted diffusion. Parameters include intracellular volume fraction, fI; average sphere radius, R; and Tensor diffusion coefficients Dpar, Dperp1 and Dperp2. The model also includes a normalization parameter, S0, and a T2diff parameter to account for different echo times.
A high-resolution T2-weighted image (fast spin-echo, TE=20 ms, TR=6 s, 375 x 375 µm2 resolution, 0.5 mm thick) was acquired for registration.
A 5 mm slice was cut using the slicing guides in the mold to align with the MRI plane; from this, a 3-µm section was cut and stained with haematoxylin and eosin and digitized (Hamamatsu NanoZoomer) at 20x resolution. Images were downsampled to 0.2x for 2D rigid registration using a block-matching strategy with correlation coefficient as similarity measure7,8.
Results and Discussion
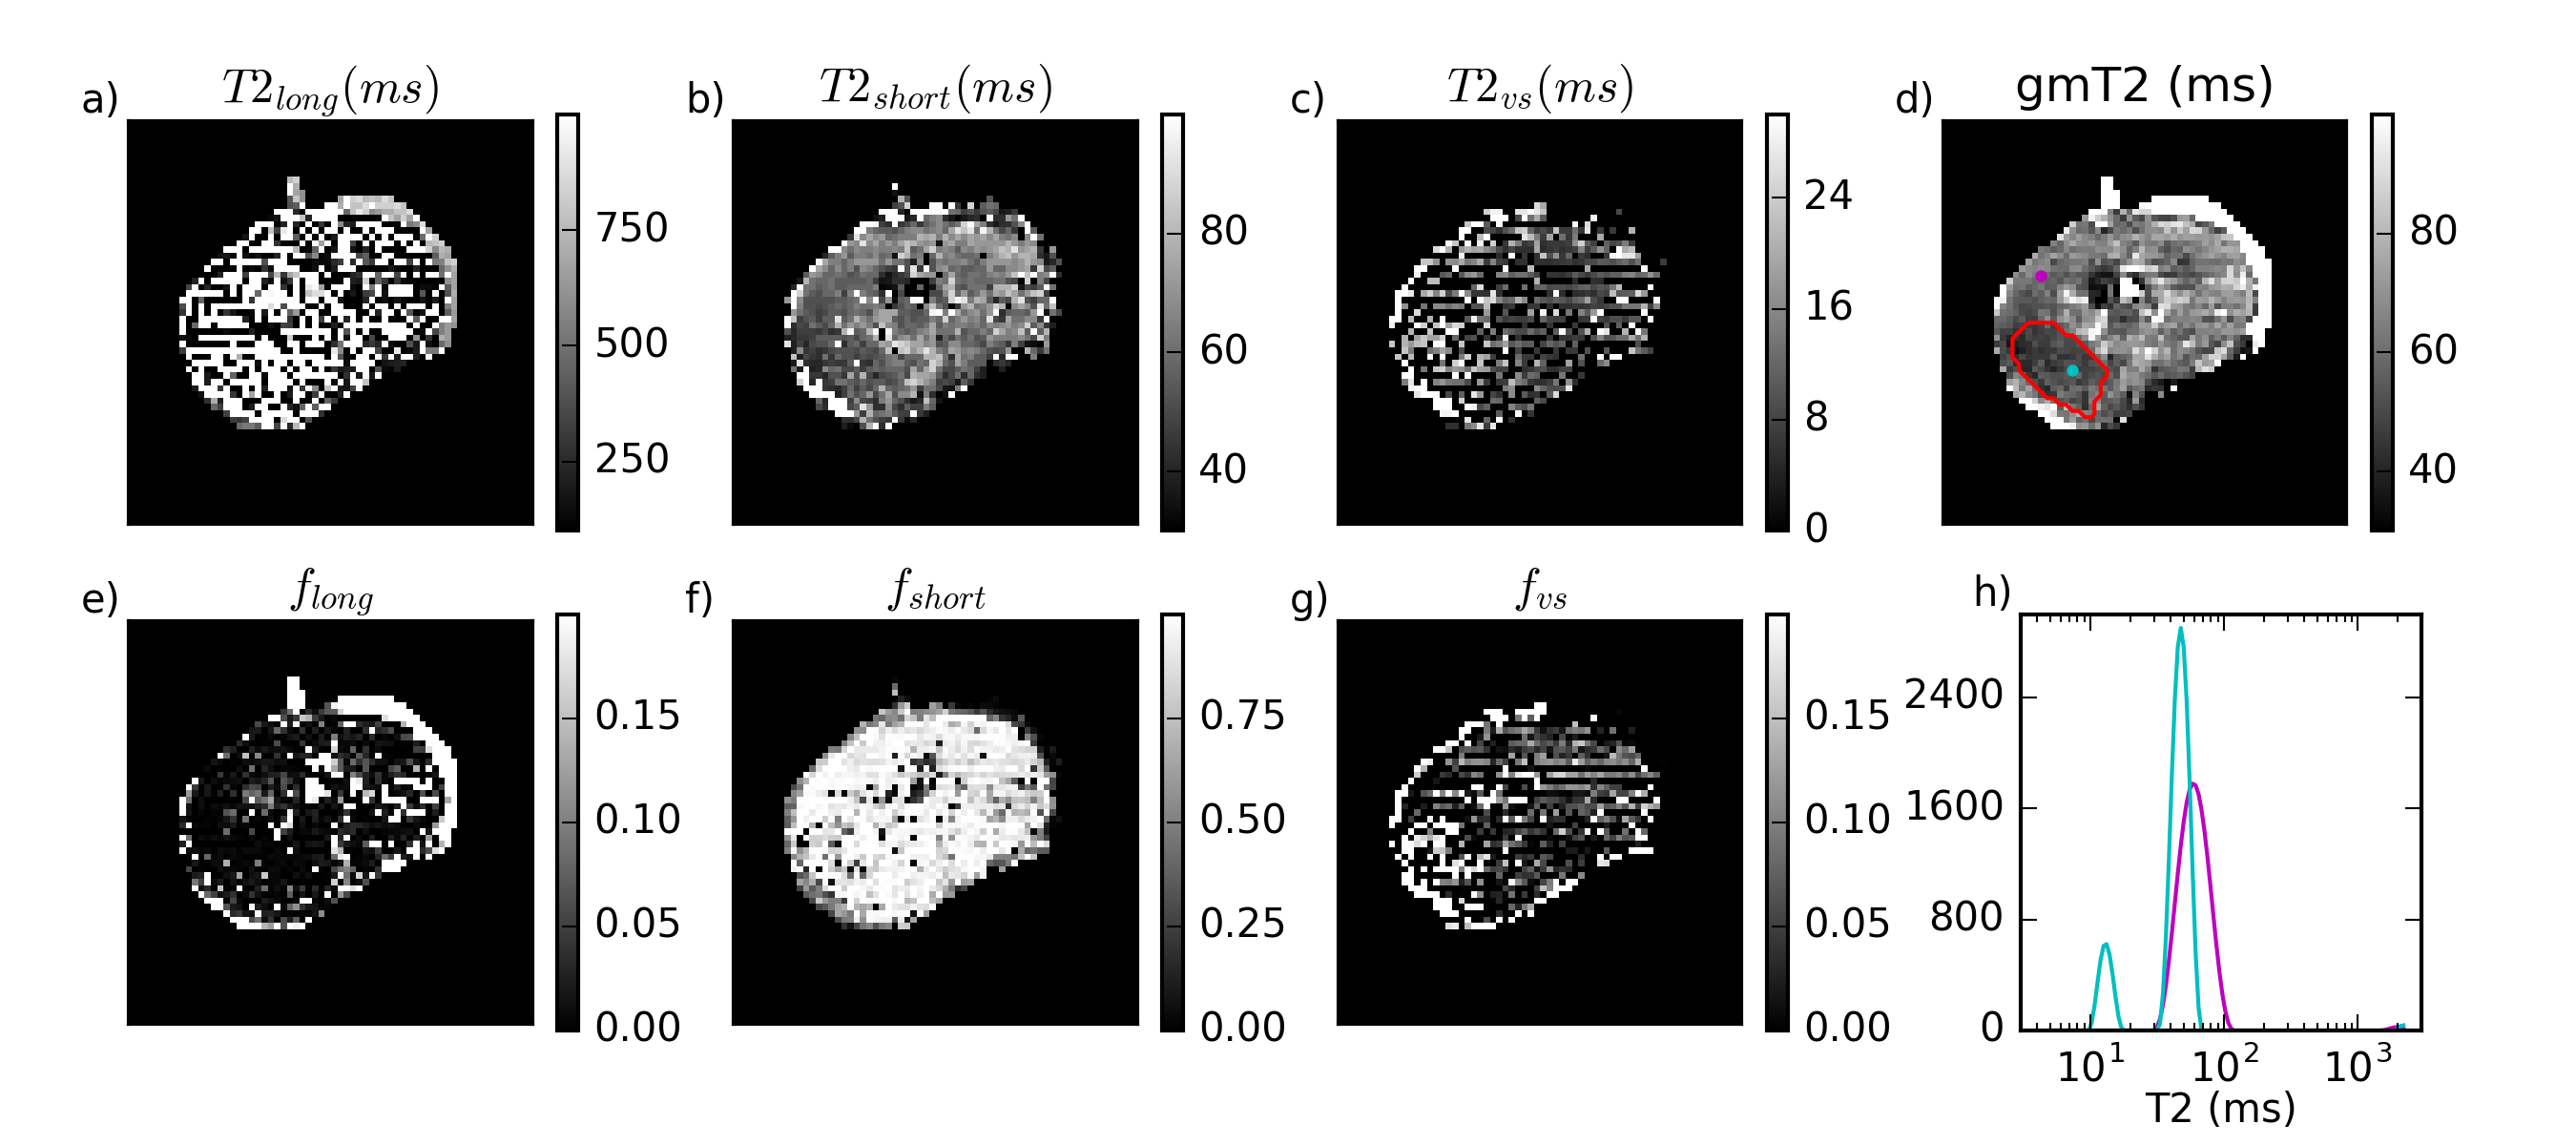
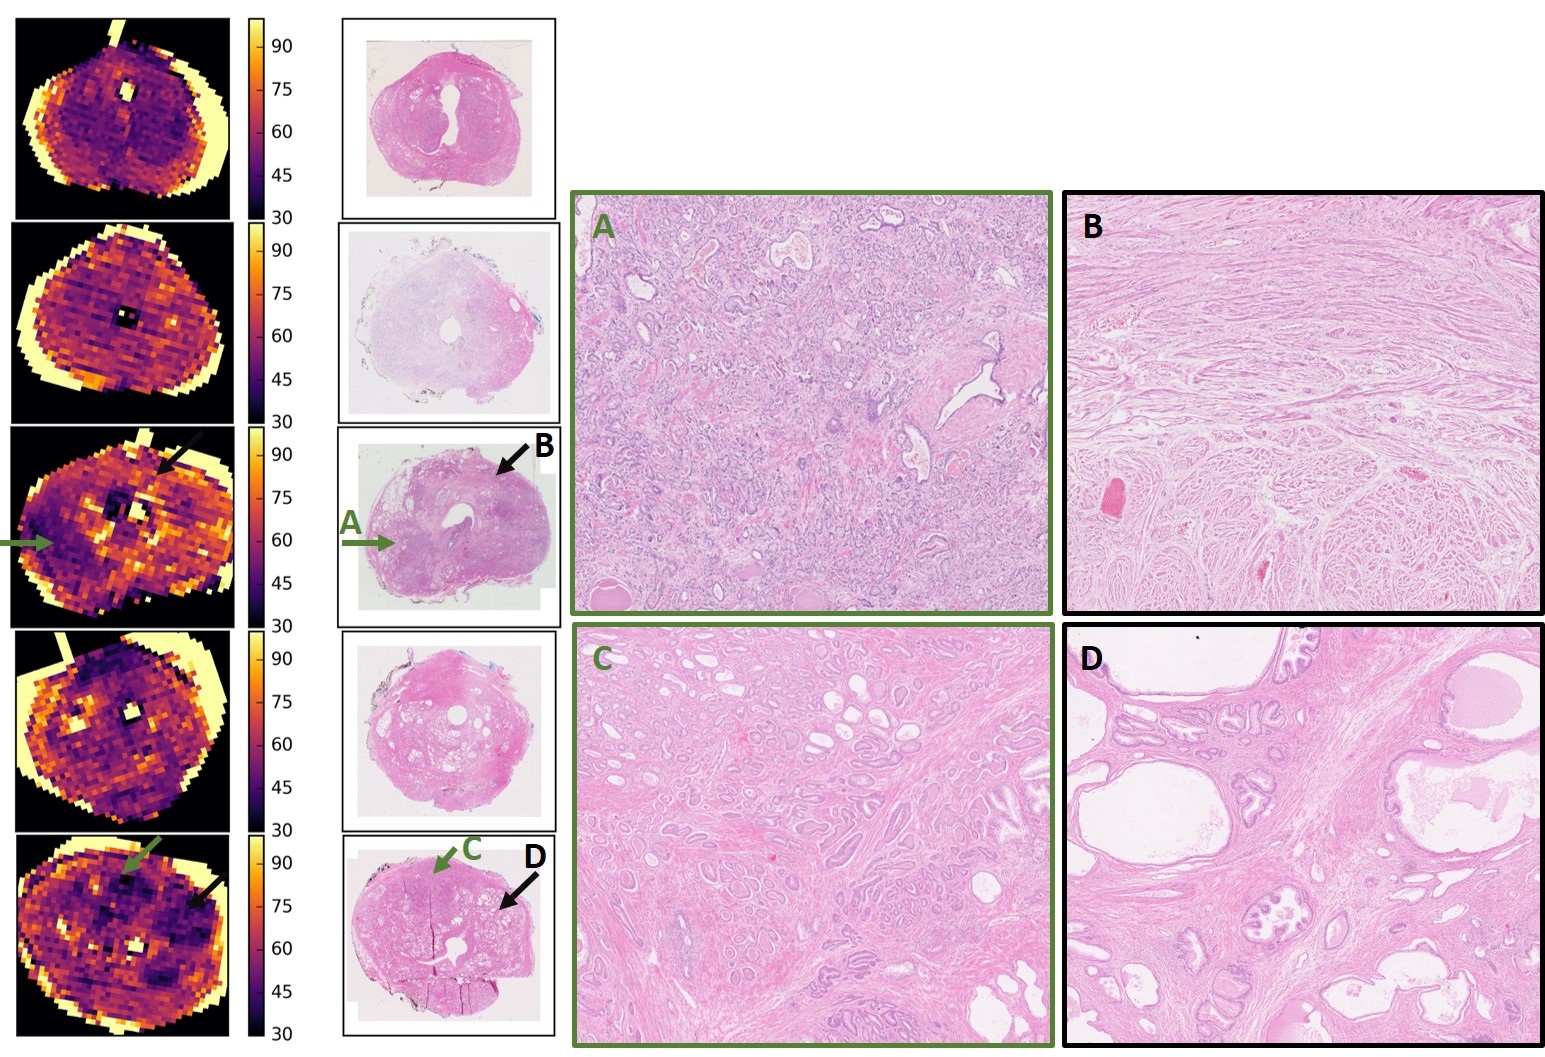
Figure 1 is representative of 4 of 5 specimens, where most voxels have fshort>0.9 and a gmT2 map similar to T2short, suggesting near-monoexponential T2 decay. Figure 2 shows a case with a large cancer that exhibited multiple T2 components, including a very short component, fvs. From histology (Figure 3), this region contains more cells and less lumen space.
These findings differ from in vivo because there was no long-T2 component even in voxels with substantial lumen volume on histology. However, there was longer T2short and gmT2 in these regions. One possible explanation for this is that T2 of lumen water decreased with water loss post-surgery and proteins became more concentrated. Another possibility is that tissue decay allowed faster water exchange between the lumen and surroundings. Either factor could result in the appearance of a single T2 peak with a value dependent on luminal water fraction. This is of note for diffusion models that make assumptions about the nature of the T2 decay when applied in vivo versus ex vivo.
Additionally, there was a component of T2vs~10-20 ms in highly cellular regions, eg. the third specimen. This could be the result of water loss or protein changes in some compartments, possibly intracellular. However, it is also possible that this peak exists in vivo, but is not visible in clinical scans with longer minimum TE (~15 ms versus 3 ms in this study).
Figure 4 demonstrates the correlation between gmT2 and VERDICT parameters. All correlations shown were statistically significant, but Dperp2 was strongest. The correlations are consistent with the parameter interpretations of both LWI and VERDICT. For example, higher fI in VERDICT suggests more space taken up by cells and potentially less luminal space, corresponding to decreased gmT2. Similarly, more luminal water should result in less hindered diffusion and higher Dpar, as well as higher Dperp1 and Dperp2 due to more isotropic diffusion, so these are expected to increase with increased gmT2.
Conclusions
T2 spectra ex vivo were dominated by a single component in most regions, with higher gmT2 in regions with more luminal space. A small component with very short T2 was observed in highly cellular, cancerous regions. The correlation between gmT2 and VERDICT parameters is consistent with a parameter related to the luminal water in cases where cells displace luminal space.Acknowledgements
This project was funded by the EPSRC (EP/M020533/1). EP and CB were supported by the EPSRC (EP/N021967/1). RB received research funding from the Australian National Health and Medical Research Council. The project also received funding from the National Institute for Health Research University College London Hospitals Biomedical Research Centre.References
- Sabouri, S. et al. Luminal Water Imaging: A New MR Imaging T2 Mapping Technique for Prostate Cancer Diagnosis. Radiology 284, 161687 (2017).
- Panagiotaki, E. et al. Microstructural Characterization of Normal and Malignant Human Prostate Tissue With Vascular , Extracellular , and Restricted Diffusion for Cytometry in Tumours Magnetic Resonance Imaging. Invest. Radiol. 50, 218–227 (2015).
- Bailey, C. et al. Validation of VERDICT MRI using fresh and fixed prostate specimens with aligned histological slices. in Proceedings of the 25th ISMRM 868 (2017).
- Bourne, R. M. et al. Apparatus for Histological Validation of In Vivo and Ex Vivo Magnetic Resonance Imaging of the Human Prostate. Front. Oncol. 7, (2017).
- Bjarnason, T. A. & Mitchell, J. R. AnalyzeNNLS: magnetic resonance multiexponential decay image analysis. J. Magn. Reson. 206, 200–4 (2010).
- Panagiotaki, E. et al. Compartment models of the diffusion MR signal in brain white matter: a taxonomy and comparison. Neuroimage 59, 2241–54 (2012).
- Mertzanidou, T. et al. 3D volume reconstruction from serial breast specimen radiographs for mapping between histology and 3D whole specimen imaging. Med. Phys. 44, 935–948 (2017).
- Ourselin, S., Roche, A., Subsol, G., Pennec, X. & Ayache, N. Reconstructing a 3D structure from serial histological sections. Image Vis. Comput. 19, 25–31 (2001).
Figures