4502
MR Fingerprinting and ADC Mapping for Characterization of Lesions in Transitional Zone of ProstateAnanya Panda1, Yun Jiang1, Seunghee Margevicius2, Wei-Ching Lo3, Mark Schluchter2, Chaitra Badve1,4, Mark Griswold1,3,4, Lee Ponsky5, and Vikas Gulani1,3,4
1Radiology, Case Western Reserve University, Cleveland, OH, United States, 2Biostatistics, Case Western Reserve University, Cleveland, OH, United States, 3Biomedical Engineering, Case Western Reserve University, Cleveland, OH, United States, 4Radiology, University Hospitals Cleveland Medical Center, Cleveland, OH, United States, 5Urology, University Hospitals Cleveland Medical Center, Cleveland, OH, United States
Synopsis
This study presents utility of MRF derived relaxometry, and ADC mapping for differentiating transition zone prostate cancers from non-cancerous lesions. Based on targeted biopsy correlation, T1, T2, ADC were compared between cancer, prostatitis and normal transition zone (NTZ). Mean T1, T2 and ADC were significantly different between cancer and NTZ. Mean T1 and ADC were significantly different between prostate cancer and prostatitis. While ADC had an AUC of 0.821 for differentiating cancer and prostatitis, a combination of T1 and T2 mapping had an AUC of 0.875. Thus MRF can add significant value to ADC mapping in characterization of TZ lesions.
Target Audience
Those interested in prostate MR, quantitative MR and relaxometryIntroduction
Transitional zone (TZ) cancers comprise 25-45% of all prostate cancers1. The diagnosis of TZ cancers primarily relies on lesion appearance on T2w images with secondary importance given to diffusion weighted imaging (DWI)2. However, even non-cancerous TZ lesions such as stromal hyperplasia and prostatitis can also look similar to prostate cancer on conventional T2w image2,3 . PI-RADS v2, has high sensitivity but low specificity (~ 55%) and AUC of 0-81-0.84 for TZ4. Thus, it is desirable to develop additional quantitative criteria that may be useful in differentiating TZ cancers from non-cancerous tissue. A combination of MR Fingerprinting (MRF) and ADC mapping has shown promise in differentiating normal peripheral zone (PZ) from prostate cancer and prostatitis and grades of PZ cancers5 but has not been explored in TZ so far. This study evaluates the utility of MRF in characterization of TZ lesions, using targeted biopsy as the pathology gold standard.Methods
In this IRB approved study, we retrospectively analyzed 31 TZ cancer suspicious regions in 31 patients who prospectively underwent MRF, a clinical prostate MRI (high resolution T2w and ADC mapping), and targeted biopsy (cognitive targeting in 14 patients, in-gantry targeting in 17 patients). MRF-FISP acquisition was done through whole gland5. Settings: FOV 400 mm, TR 11-13 ms, flip angle 5-75 degree, resolution 1 x 1 x 5 mm3. ADC mapping was performed using a traditional echo-planar imaging (EPI) acquisition; b-values 50 – 1400 sec/mm2, FOV 240 x 240 mm2, resolution 1.2 x 1.2 x 3 mm3. Based on clinical reads by a radiologist (16 years radiology experience), another radiologist (7 years radiology experience), blinded to final pathology diagnosis, drew regions of interest (ROIs) on the targeted cancer suspicious regions and contralateral NTZ on MRF-based T2 maps. The same ROIs were replicated separately on ADC maps in the same region and in NTZ. The means of T1, T2 and ADC values were compared and logistic regression analysis was used to evaluate MRF and ADC in differentiating cancer from NTZ and prostatitis.Results
Of 31 TZ lesions, prostatitis was seen in 12 lesions; prostate cancer in 14 lesions (3 Low Grade (Gleason score 6), 10 Intermediate Grade (Gleason score 7), 1 High Grade (Gleason score 8 and above) while 5 lesions were negative on biopsy. T1, T2 and ADC in prostate cancer (mean ± SD, 1539 ± 126 ms, 44 ± 13 ms, 0.570 ± 0.146 x 10⁻³ mm2/s) were significantly lower than in NTZ (mean ± SD, 1727 ± 107 ms, 68 ± 26 ms, 1.047 ± 0.265 x 10⁻³ x mm2/s) (p < 0.0001 for T1 and ADC, p = 0.003 for T2) All three tissue properties were independently significant in differentiating the two groups, with ADC having best AUC of 0.948. Adding T2 to ADC enabled further improved separation (AUC: 0.962) (Figure 1). Both T1 and ADC were significantly lower in prostate cancer (mean ± SD, 1539 ± 126 ms, 0.570 ± 0.146 x10⁻³ x mm2/s) than prostatitis (mean ± SD, 1659 ± 103 ms, 0.755 ± 0.142 x 10⁻³ x mm2/s) (p = 0.014 for T1, p = 0.003 for ADC) while T2 was marginally significant (mean ± SD; PCa, 44 ± 13 ms, Prostatitis: 57 ± 20 ms; p =0.046). The AUCs of T1 and ADC alone were 0.774 and 0.821 respectively for differentiation, while the combination of T1 and T2 had AUC of 0.875. (Figure 2). Table 1 summarizes all AUC results. Figure 3 shows representative maps from patient with cancer. Figure 4 shows a scatter plot of ADC vs. T1 in cancer, prostatitis and NTZ.Discussion
This work demonstrates utility of a quantitative MR protocol in characterization of TZ lesions and the additional utility of T1 and T2 relaxometry in separating TZ cancers from prostatitis, with targeted biopsy verification. A quantitative approach may overcome some of the subjectivity associated with analyzing the TZ lesion appearance on conventional T2w images. Improved diagnostic performance with a combination of T1 and T2 mapping versus ADC alone for differentiating cancer from prostatitis may improve decision making and help avoid unnecessary biopsies. The role of T1 mapping in transition zone in prostate has not been described previously and this represents a new finding. The chief limitation of this study is the small sample size, limiting robust multivariate analysis. However, this is an ongoing study with active patient recruitment, to add to this work on MRF evaluation of TZ lesions with targeted biopsy verification.Conclusion
The first description of the role of quantitative T1 and T2 mapping in characterizing TZ lesions is described, showing that MRF derived relaxometry could be important in the characterization of TZ lesions.Acknowledgements
Research Support: NIH grants 1R01EB016728, 1R01DK098503, 1R01CA208236 and Siemens HealthineersReferences
1. Patel V, et al. The incidence of transition zone prostate cancer diagnosed by transperineal template-guided mapping biopsy: implications for treatment planning. Urology. 2011; 77:1148-1152. 2. Barentsz JO, et al. Synopsis of the PI-RADS v2 Guidelines for Multiparametric Prostate Magnetic Resonance Imaging and Recommendations for Use. Eur Urol.2016;69: 41-49. 3. Oto A, et al, Prostate Cancer: Differentiation of Central Gland Cancer from Benign Prostatic Hyperplasia by Using Diffusion-weighted and Dynamic Contrast-enhanced MR Imaging.Radiology.2010;257:715-723 4. Polanec S, et al. Head-head comparison of PI-RADS v1 and PI-RADS v2. Eur J Radiol. 2016;85:1125-31.5. Yu A, et al. Development of a Combined MR Fingerprinting and Diffusion Examination for Prostate Cancer. Radiology.2017;283:729-738.Figures
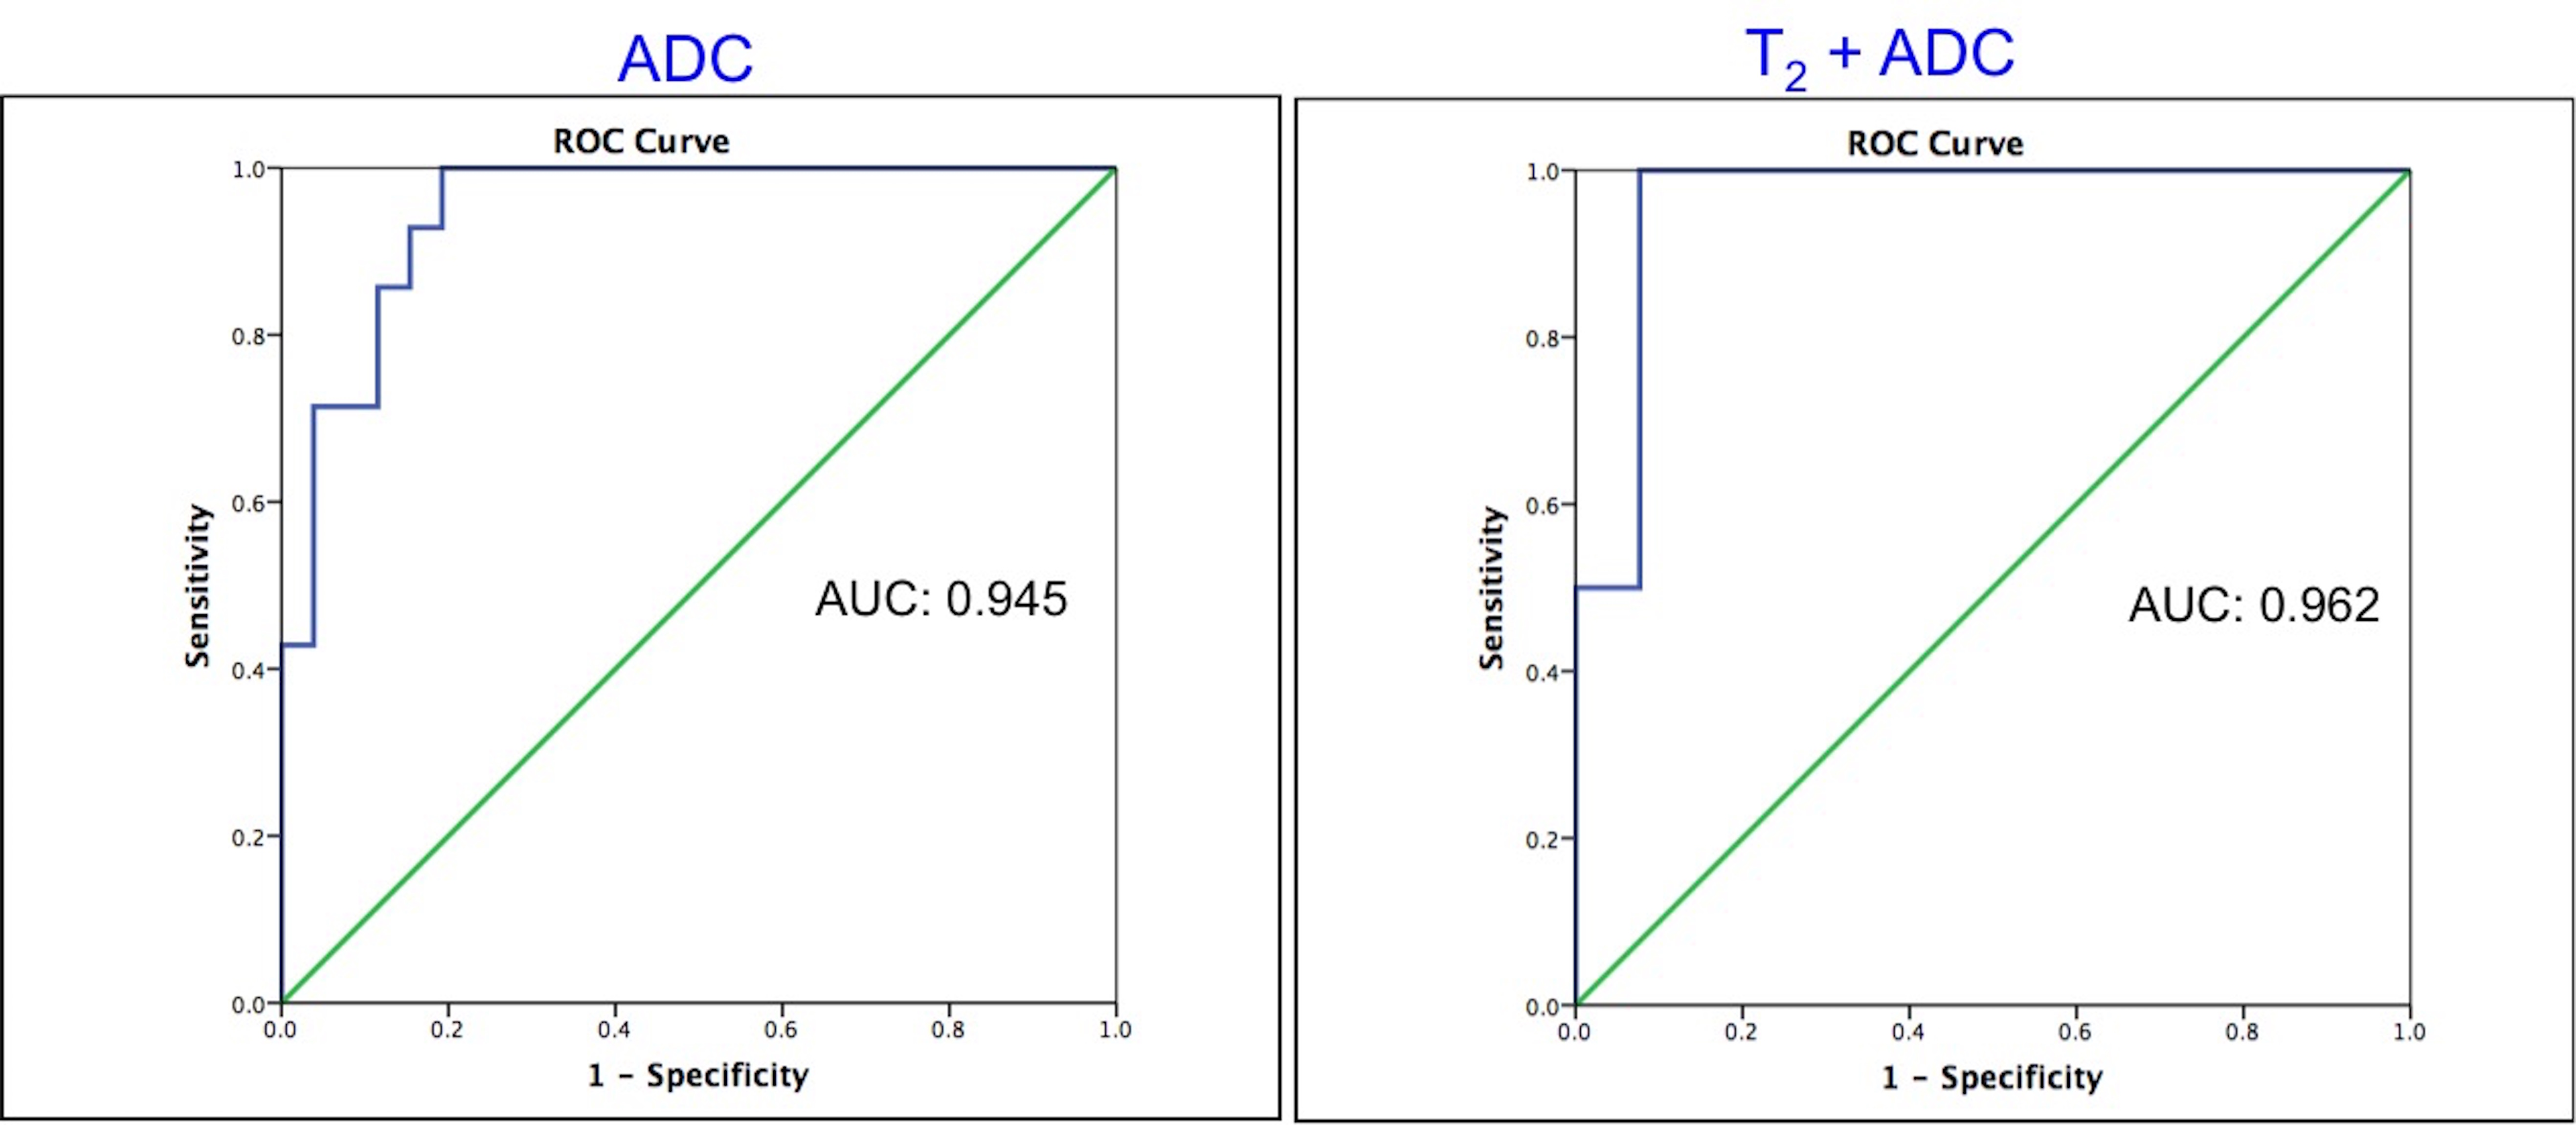
Figure 1:
Receiver Operating Characteristics (ROC) curves for ADC and for T2 + ADC for separating normal transition zone (NTZ) from TZ prostate cancer.
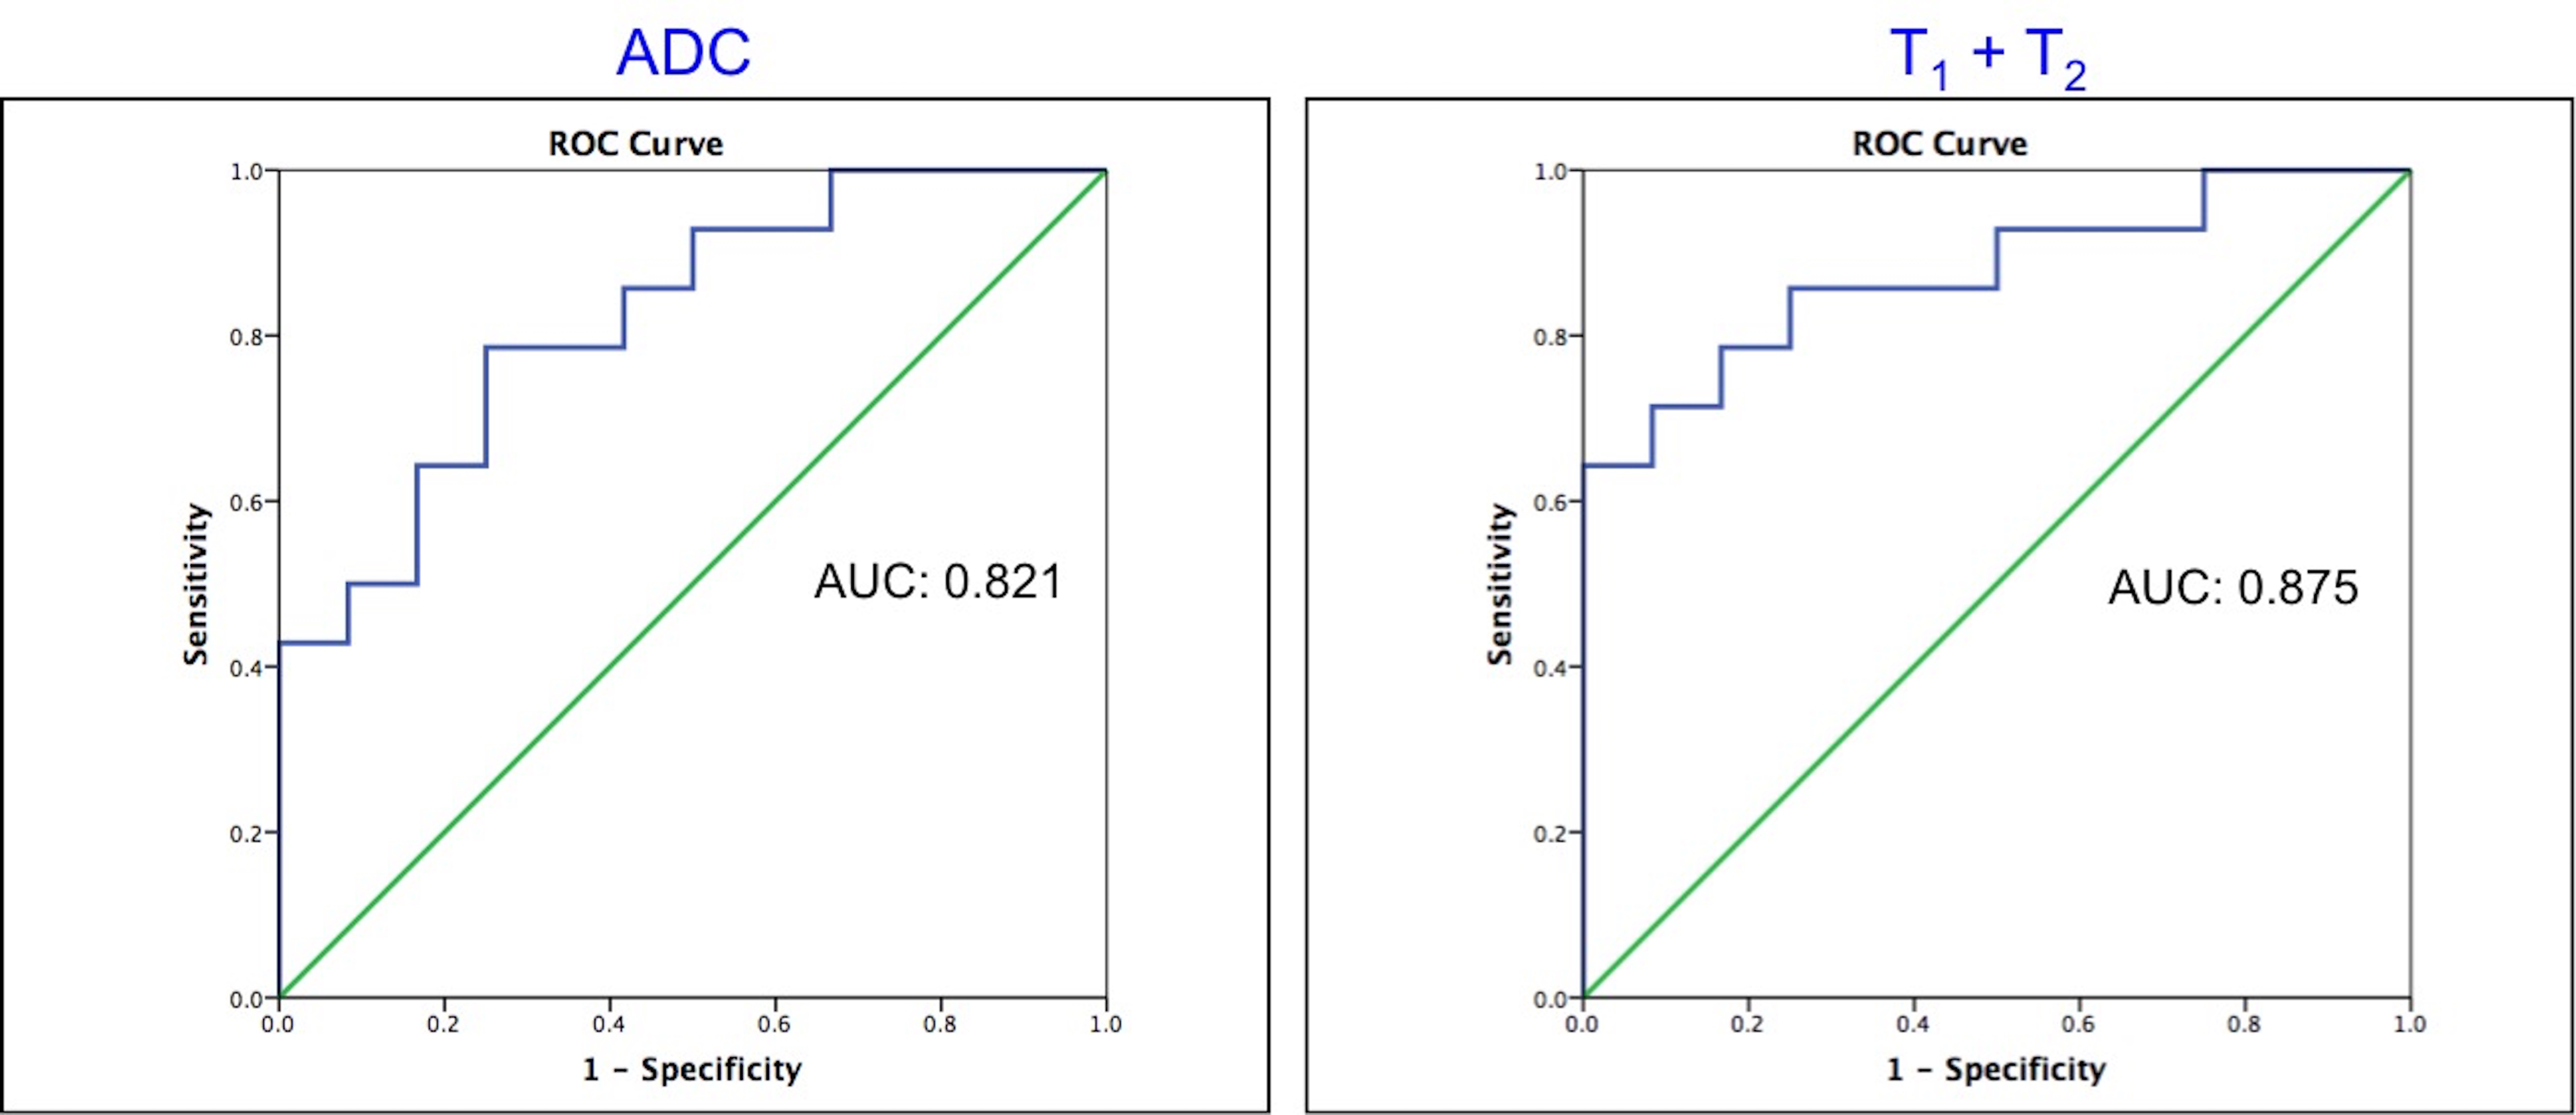
Figure 2: Receiver Operating Characteristics (ROC) curves for ADC and for T1 + T2 for separation of TZ prostate cancer from prostatitis.
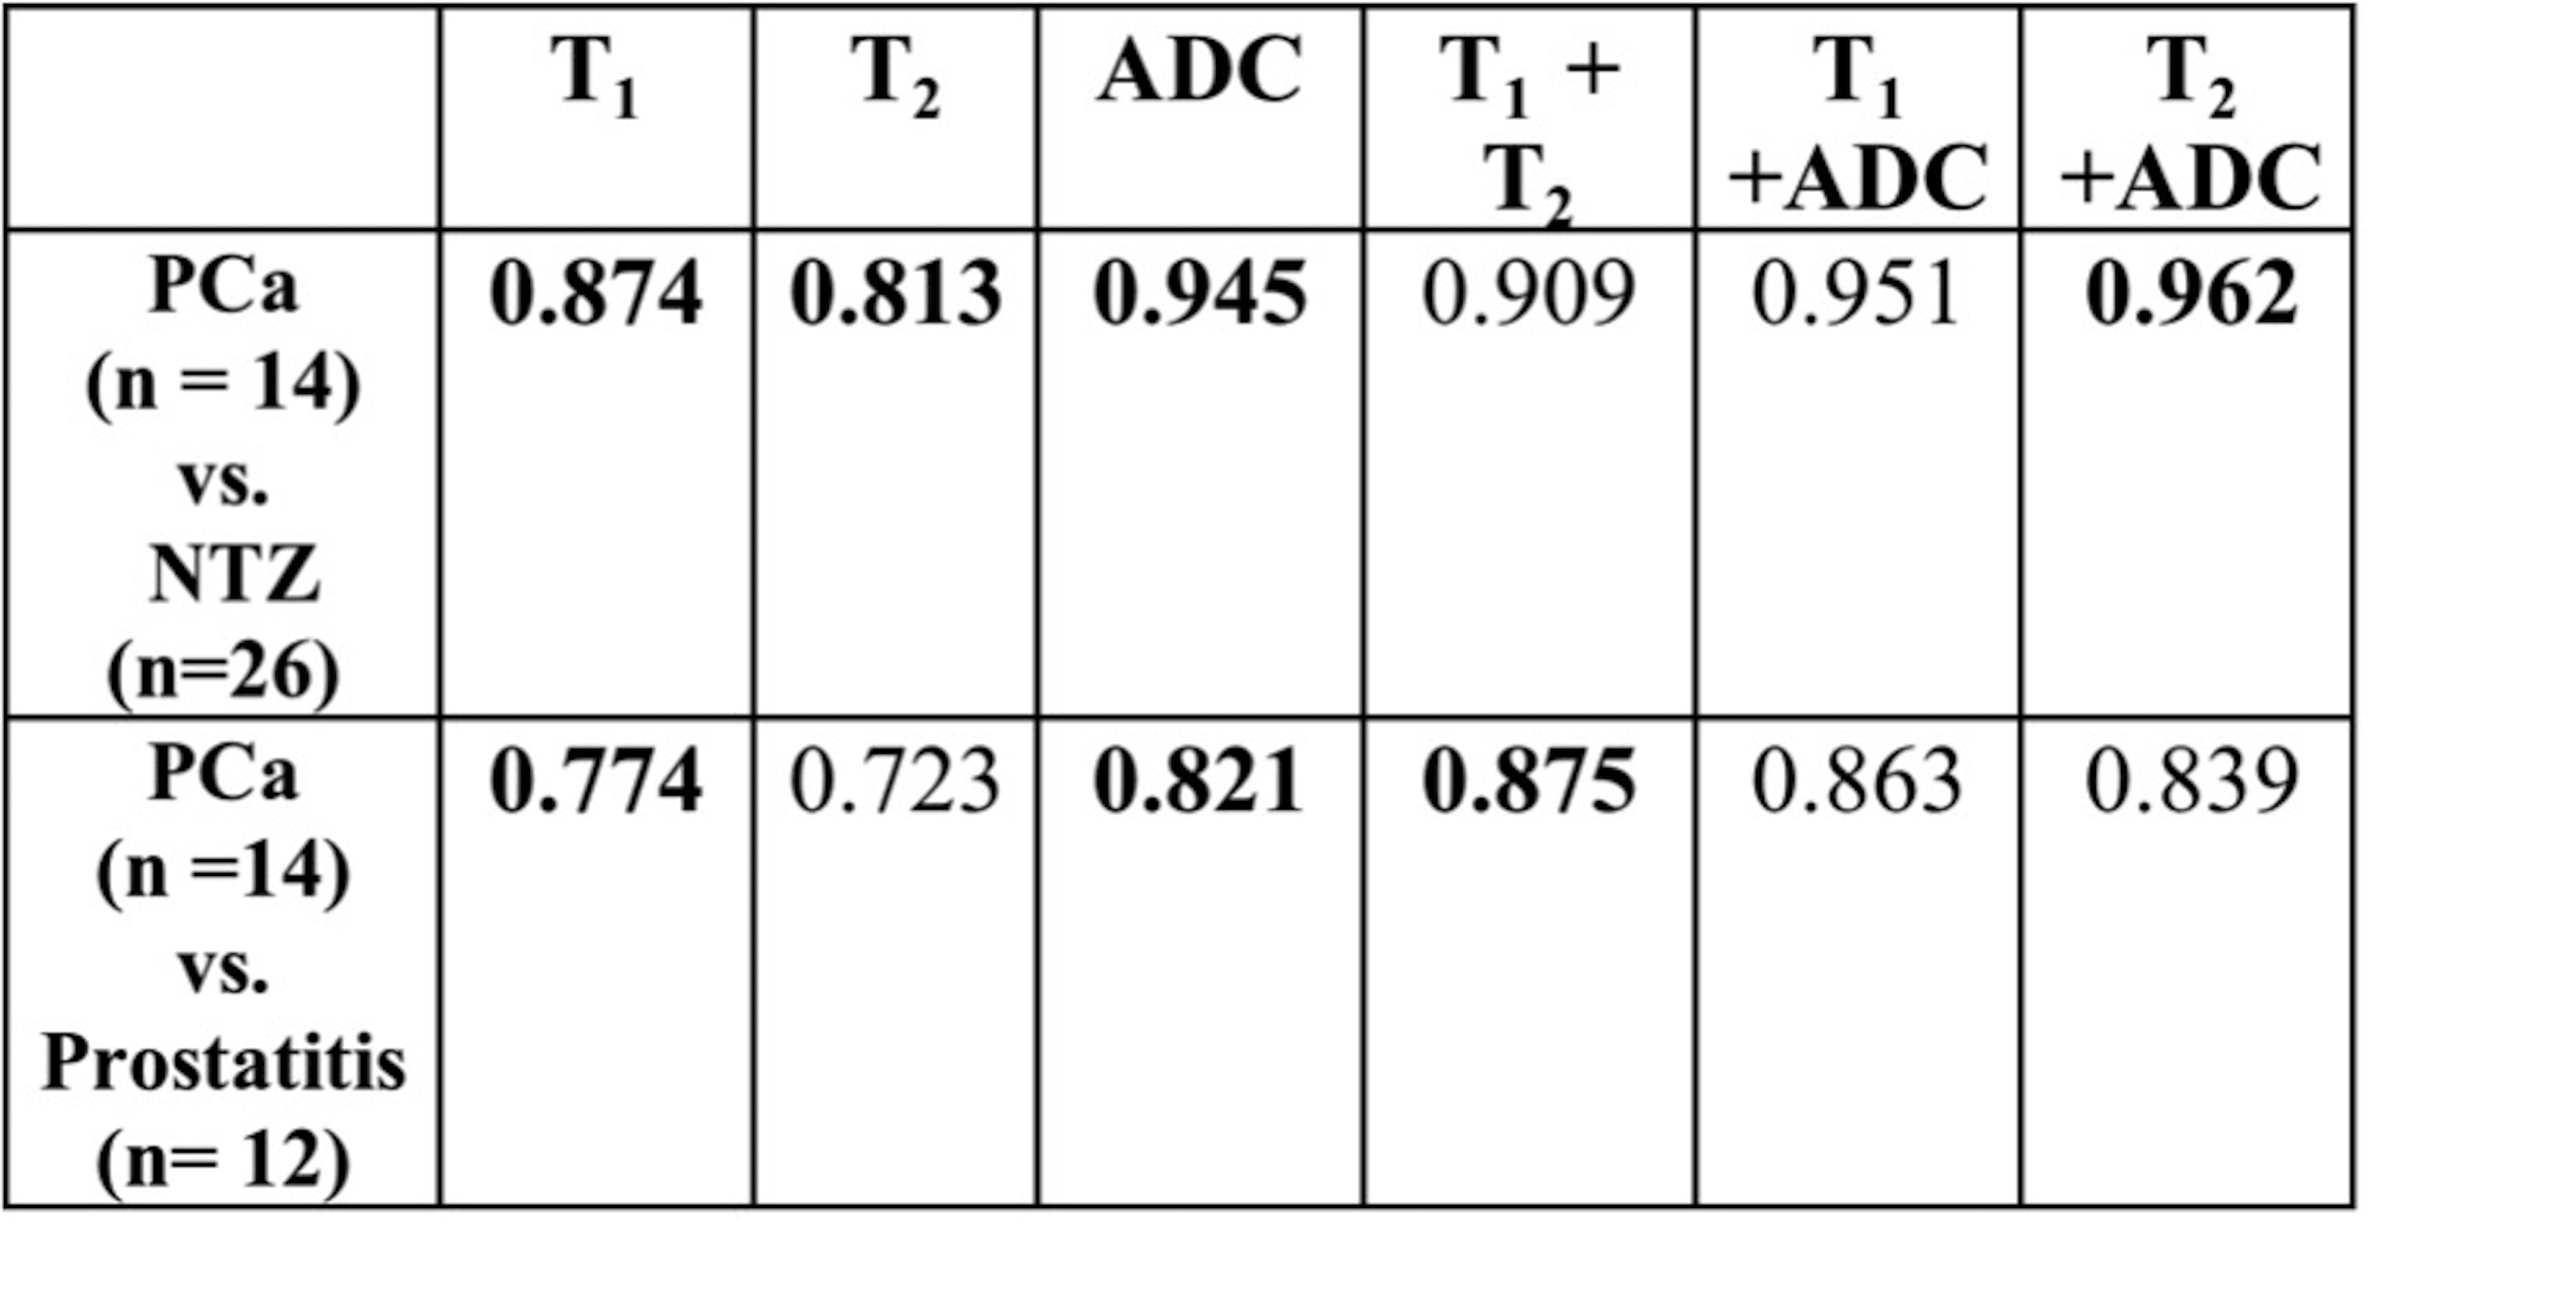
Table 1: Summary of AUCs for univariate (T1, T2,
ADC) and bivariate models.
The figures in bold represent LR models with significant
contributions from variables in those models.
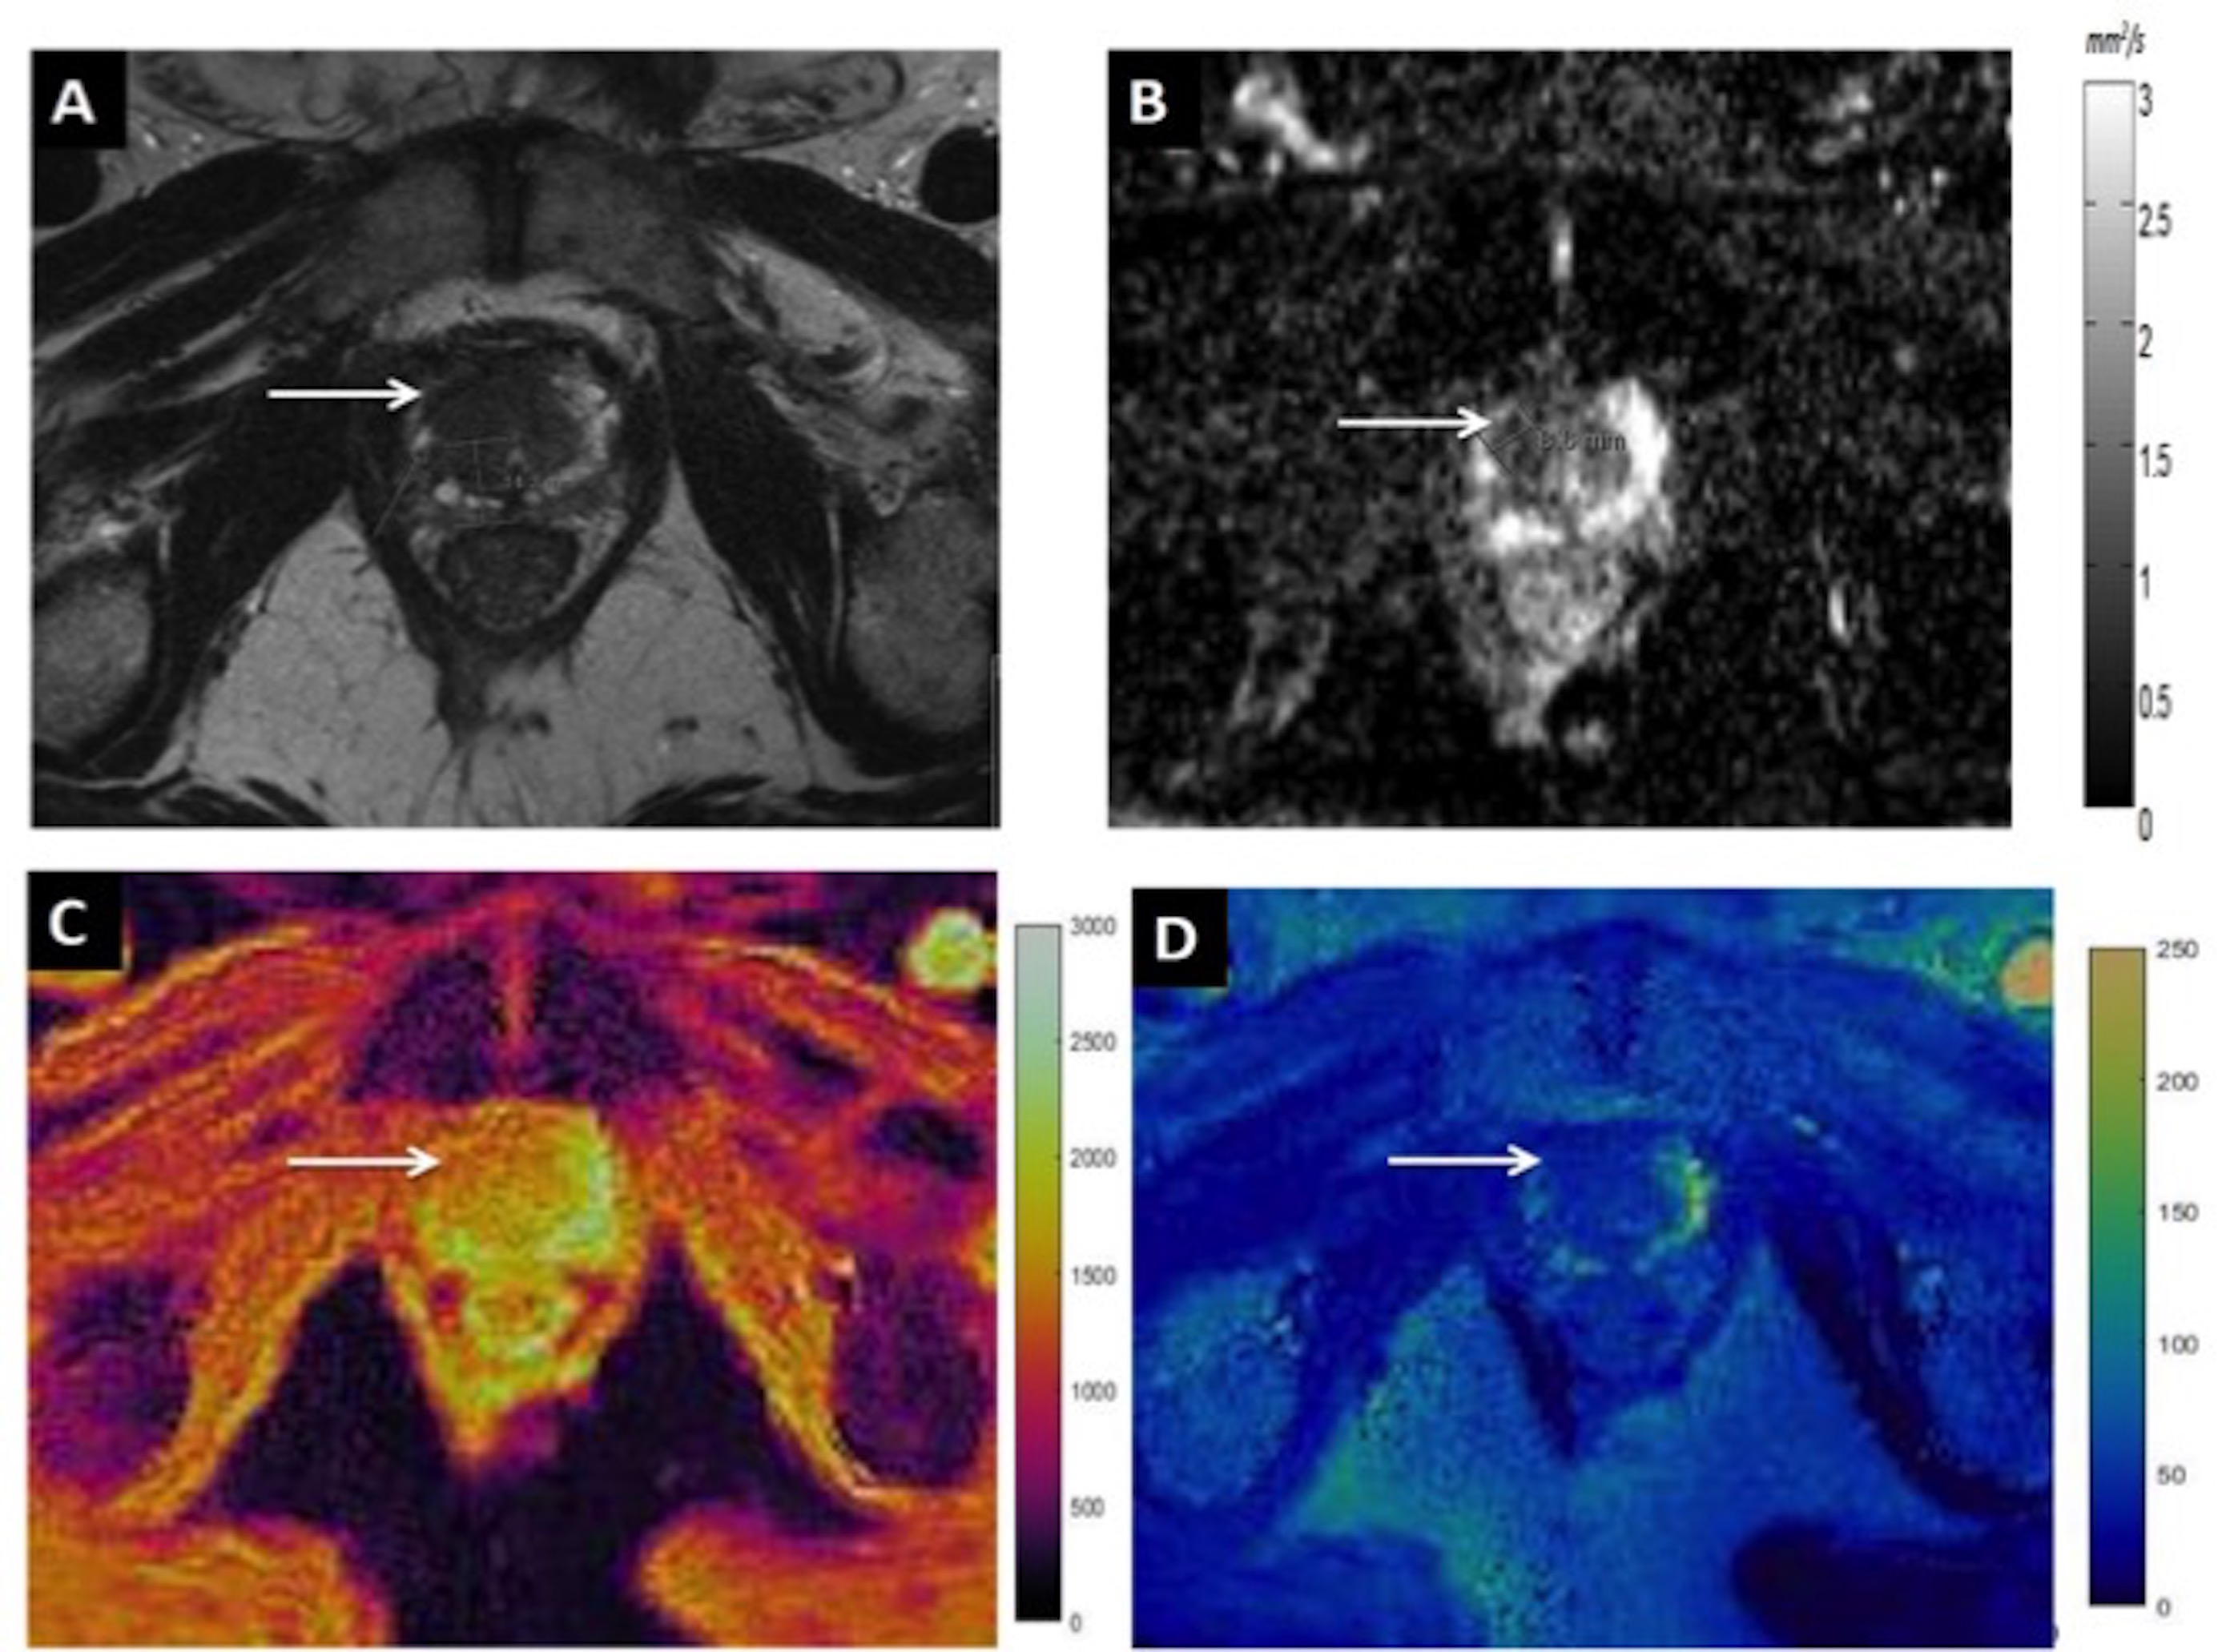
Figure 3: T2 w image (A), ADC map (B), T1 (C)
and T2 (D) MRF colormaps of a patient with biopsy proven Gleason
grade 4 + 3 prostate cancer in right apical anterior transition zone (white
arrow). Note the dark appearance of the lesion on T2 w image with obscured
margins (erased charcoal sign).

Figure 4: Scatter plot of ADC vs. T1 in Normal
Transition Zone (green), Prostatitis (blue) and Prostate cancer (red).