4501
Synthetic MRI of the Prostate using MAGiC: Clinical Feasibility and Preliminary Results1Medical Physics, Memorial Sloan Kettering Cancer Center, New York, NY, United States, 2Application & Workflow Team, GE Healthcare, New York, NY, United States, 3Radiology, Memorial Sloan Kettering Cancer Center, New York, NY, United States
Synopsis
In this study, we evaluated a 2D combined simultaneous multi-contrast acquisition sequence, referred to MAGiC, which allows simultaneously obtaining images to generate, T1, T2, PD, STIR map with acceptable scan duration within a single acquisition. High quality T1- and T2-w images were synthetically generated using mathematical signal models. Prostate images obtained from patients and volunteers showed that T1 and T2 measured by MAGiC were within 16% of the values measured using conventional mapping techniques with reasonable spatial resolution.
PURPOSE
The aims of this study were to investigate the clinical feasibility and to report a 2D simultaneous multi-contrast sequence – MAGnetic resonance image Compilation (MAGiC, GE Healthcare, Milwaukee, Wisconsin) in prostate cancer patients and volunteers. T1- and T2-maps generated with the MAGiC acquisition and reconstruction software were compared with maps generated separately using convention T1- and T2-mapping techniques.INTRODUCTION
The MAGiC acquisition and post-processing platform was developed for brain imaging to enable the following features; first it allows multiple image contrast including T1 and T2 (as well as T1 FLAIR, T2 FLAIR, STIR, PSIR DIR, and PD) at a speed of up to 2X that of conventional imaging within a single acquisition. Second, it enables images to be ‘synthesized’ with contrasts of choice (based on mathematical signal models), potentially providing additional detail from images generated with a predetermined acquisition parameters (1-3). Third, quantitative parametric maps (such as T1- and T2-maps) are of research interest, can be evaluated clinically, and if acquired in an efficient manner, could help improve throughput and reduce rescanning and total examination time. Here we have evaluated the clinical feasibly of using MAGiC to image the prostate and to measure the accuracy of the parametric maps.METHODS
All MRI studies were performed on a 3T unit (GE DV25 platform). A body coil was used for excitation. For signal reception, a pelvic eight-channel phased-array coil was used. For all experiments, the following MRI scans were obtained: 1) Conventional 2D axial plane T1- and T2-w images, sagittal and coronal T2-w images and axial diffusion weighted images. 2) As a result of human scans, optimized MAGiC sequence parameters include: A 5:30 minute sequence composed of 24cm FOV, 4mm thickness; matrix, 256×256; 3) T2 maps were generated using data obtained from a dual echo fast spin echo sequence and the same resolution & coverage as MAGiC. TE values were: 44.6ms and 148.8ms; TR=3829ms; echo train length, 24. 4) T1-map were generated using data obtained with a series of T1-weighted images at different flip angles (30°, 20°, 10°, and 5°), TR/TE=4.5/1.5ms and same resolution & coverage as MAGiC. Human Studies: Our study was compliant with HIPAA and was approved by our institutional review board. It included six men (3 patients and 3 volunteers) who gave informed consent to be enrolled in this study to assess the value of 3T MAGiC of the prostate. Data Analysis: Regions of interest (ROI) were drawn over regions of suspected healthy peripheral zone prostate (PZ), suspected healthy transition zone (TZ), and regions suspicious for cancer (PCa). Mean T1 and T2 value in the ROI were calculated using MAGiC and conventional mapping techniques and used for comparison.RESULTS
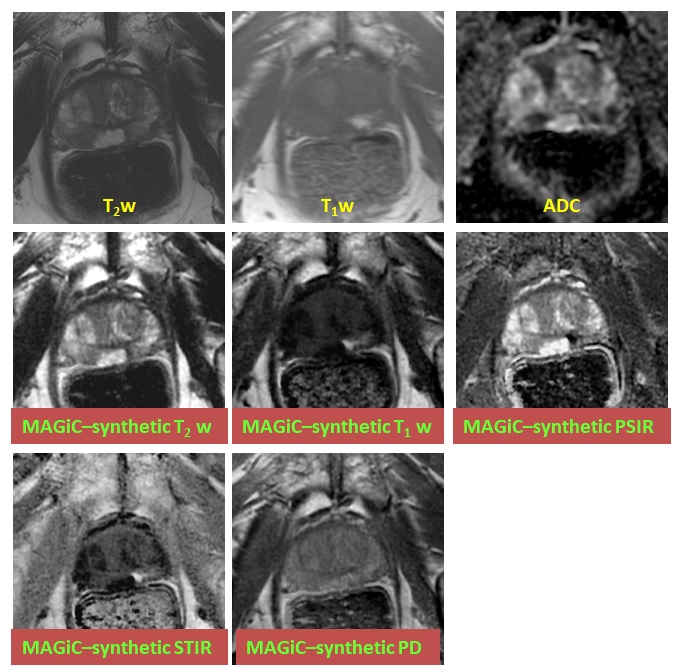
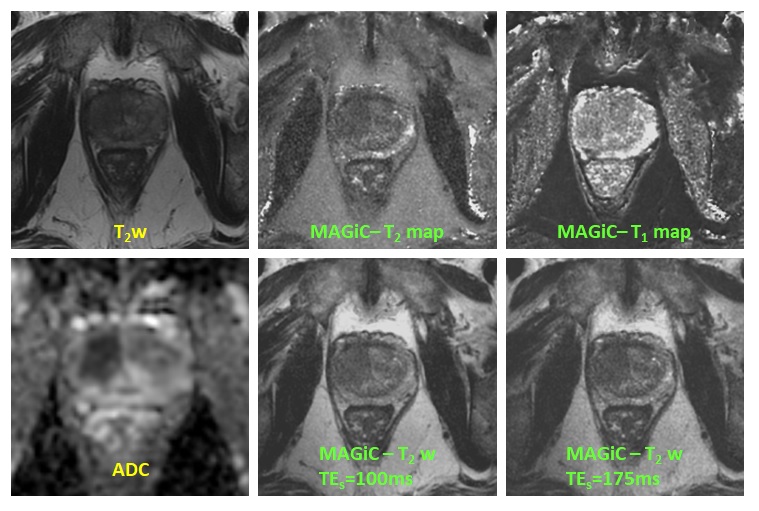
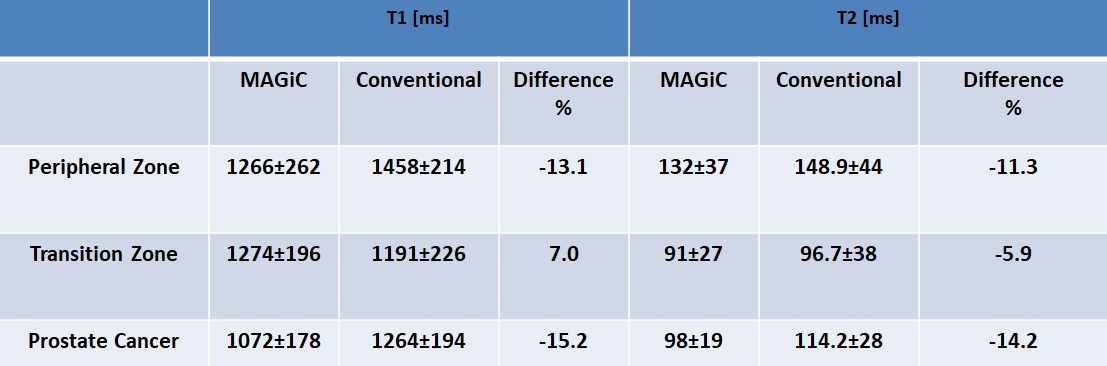
In all patients, T1- and T2-maps could successfully be obtained. The average T2 in PZ, TZ, and PCa regions measured with MAGiC were 132±37ms, 91±27ms, and 98±19ms respectively, while in T2 values measured using conventional mapping in PZ, TZ, and PCa regions were 148.9±44ms, 96.7±38ms, and 114.2±28ms respectively (Table 1, Fig. 1).Synthetic T2-w images, T1-w images, PSIR images, STIR images, and PD images were generated as shown in the example in Fig. 2.DISCUSSION
Absolute T2 and T1 measurement are useful in clinical practice as they provide a objective discrimination of prostate cancer and other pathology (such post biopsy hemorrhage). Studies have also shown that distinguish aggressive from less aggressive tumors (4). Here we have presented preliminary results of an acquisition sequence and analysis software which permits simultaneous acquisition of relaxation parameters as well as other MR imaging parameters in less than 6 minutes of acquisition with good spatial resolution. The main limitation of MAGiC is its sensitivity to motion. Motion at any point during the acquisition could result in artifacts in the parametric maps. Also, MAGiC will be useful in clinical practice only if it is possible to obtain higher signal-to-noise ratio images, resulting in more reliable estimated parameters.CONCLUSION
Based on our preliminary results, we conclude that the MAGiC platform enables T1- and T2-mapping at 3T of the prostate within clinically acceptable scan time. Additional studies are needed to evaluate its clinical utility in detection and staging of cancer. The ability to generate synthetic images at arbitrary T1 and T2 could potentially be useful in detection of lesions and requires further evaluation. In addition, this technique might be well-suited for longitudinal studies for measuring changes due to therapy.Acknowledgements
No acknowledgement found.References
1. Riederer SJ, Suddarth SA, Bobman SA, Lee JN, Wang HZ, MacFall JR. Automated MR image synthesis: feasibility studies. Radiology 1984;153(1):203-206.
2. Warntjes JB, Dahlqvist O, Lundberg P. Novel method for rapid, simultaneous T1, T2*, and proton density quantification. Magnetic resonance in medicine 2007;57(3):528-537.
3. Krauss W, Gunnarsson M, Andersson T, Thunberg P. Accuracy and reproducibility of a quantitative magnetic resonance imaging method for concurrent measurements of tissue relaxation times and proton density. Magnetic resonance imaging 2015;33(5):584-591.
4. Hoang Dinh A, Souchon R, Melodelima C, et al. Characterization of prostate cancer using T2 mapping at 3T: a multi-scanner study. Diagnostic and interventional imaging 2015;96(4):365-372.
Figures