4499
The Medical College of Wisconsin 39 (MCW39): A Magnetic Resonance Image Template of the Prostate to Facilitate Group Analysis1Biophysics, Medical College of Wisconsin, Wawautosa, WI, United States, 2Neurosurgery, Medical College of Wisconsin, Wawautosa, WI, United States, 3Radiology, Medical College of Wisconsin, Wawautosa, WI, United States, 4Pathology, Medical College of Wisconsin, Wawautosa, WI, United States, 5Urologic Surgery, Medical College of Wisconsin, Wawautosa, WI, United States, 6Radiation Oncology, Medical College of Wisconsin, Wawautosa, WI, United States
Synopsis
The Medical College of Wisconsin 39 (MCW39) template provides a common space for the analysis of prostate cancer images. The template was generated through iterative spatial registration of T2-weighted images starting with manually drawn contours as a reference point. Expert annotations of Gleason Grade were transformed into the template space, and maps of tumor probabilities reveal the spatial localization of cancer across the cohort for each grade.
Purpose
Spatial registration to a common coordinate frame for group-based analysis of MR images is nearly ubiquitous for some organs such as the brain. However, no such template exists for MRI analysis of prostate cancer. This study aims to spatially register prostate images across a cohort of subjects, resulting in both a method for cross-subject comparisons and generation of a common template for the analysis of prostate cancer imaging.Methods
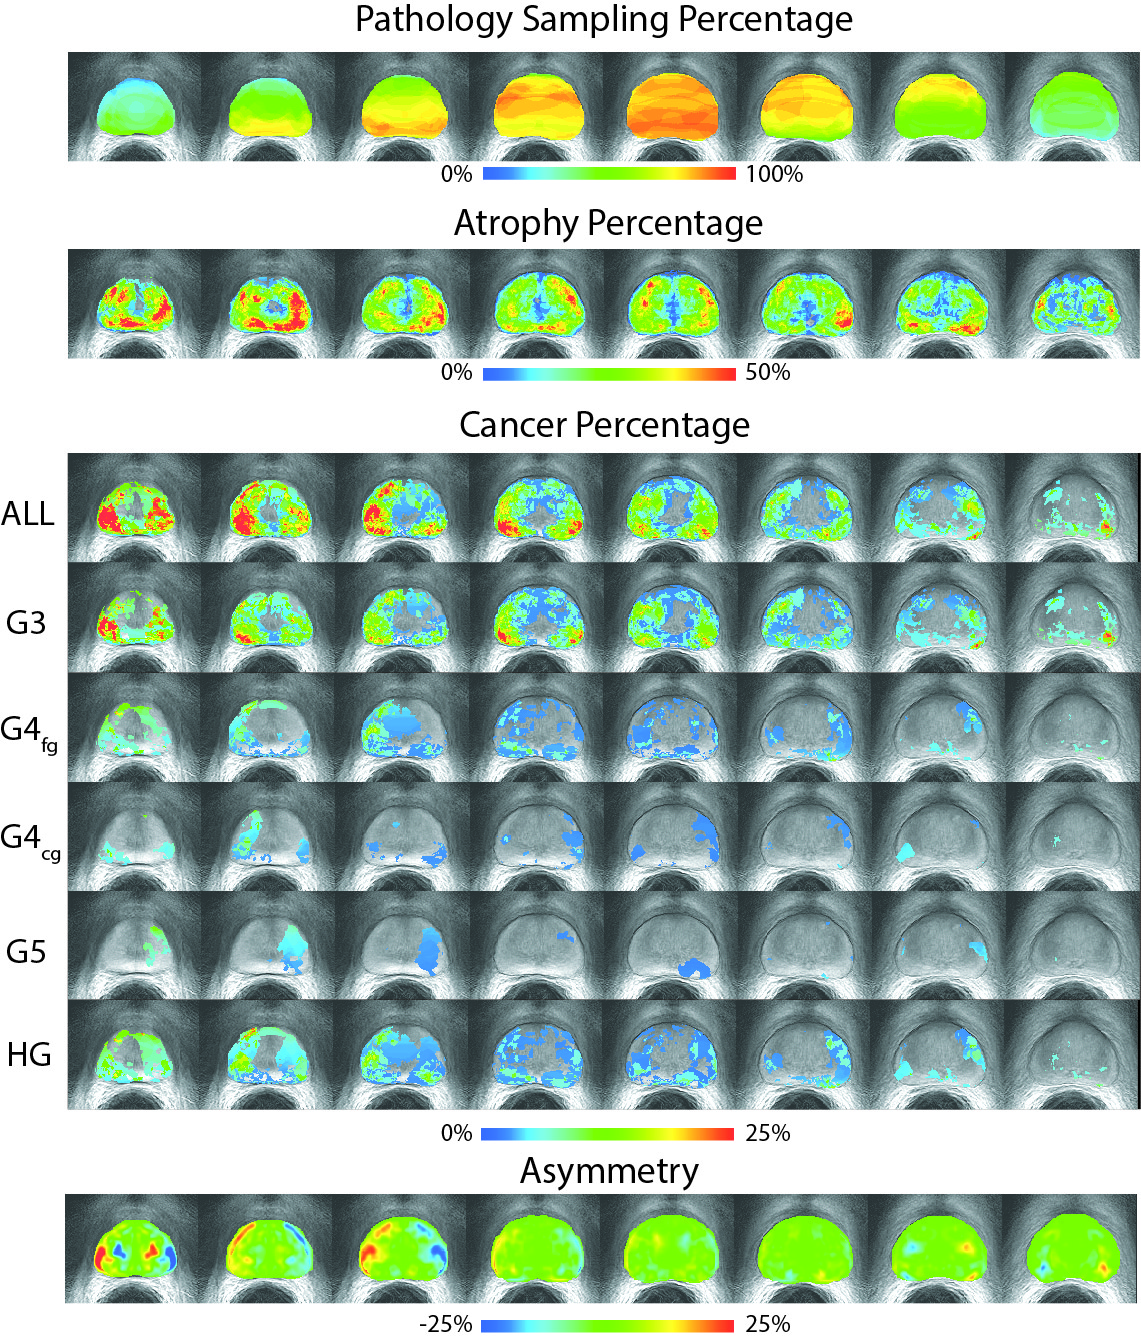
39 Patients underwent MP-MRI prior to prostatectomy on a 3T field strength MRI scanner (General Electric, Waukesha, WI) using an endorectal coil. T2-weighted acquisition parameters were: 3370 ms TR, 120 mm FOV, with voxel dimensions 0.23x0.23x3 mm, 512 acquisition matrix, and 26 slices. Two weeks after imaging patients underwent a radical prostatectomy. A custom 3D printed slicing jig was created from each subject’s T2-weighted image in order to slice the tissue in the same orientation as the MRI[1-4]. Whole mount tissue samples were hematoxylin and eosin stained, digitized, and sent to a urologic pathologist for annotation. Digitized slides were then aligned to the T2-weighted MRI using a non-linear control point warping technique, and the expert annotation was likewise transformed into MRI space. The prostate template was generated using ANTs[5,6]. First, the prostate was manually outlined on T2-weighted images, and the centroid of the masks were rigidly aligned. An iterative process subsequently aligned the contours of the masks using translation, rigid body, and non-linear (symmetric normalization: SyN), with each step incorporating 6 iterations and the mean updated with each iteration. The resulting deformation field was applied to the T2-weighted images. The template was further refined by registering the T2-weighted images within the mask, thus aligning the interior anatomy of the prostate. The transform for each image to template space was then applied to the pathologist annotations of Gleason grades 3-5 prostate cancer, as well as pathologist annotated atrophy. Binary masks of individual lesions stratified by Gleason grade were then combined to generate a probability map for each grade. Since not all MRI slices had a corresponding histological images, a map of the pathology sampling percentage was also created. Additionally, a map of tumor asymmetry was generated by mirroring the warped images about the left-right center and subtracting the overlap percentage.Results
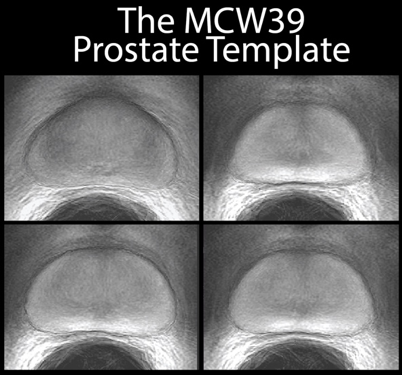
Simple registration of T2-weighted image intensity was unable to converge to a solution; the presence of high-contrast regions outside of the prostate dominated, such as the endorectal coil void. Utilization of the prostate contours derived from manual segmenting enabled a rapid convergence in alignment of the prostate borders. Subsequent registration of image intensities within the prostate refined the template, and the different anatomical zones are clearly delineated in the mean T2-weighted image from all 39 subjects (MCW39). The correspondence between MRI and pathology emerged after alignment to the template. Tissue was sampled densely in the central area of the organ, with progressively fewer samples taken towards the periphery due to difficulty in rad-path alignment. Atrophy occurred most frequently in the peripheral zone, concentrated highest in the left peripheral zone in this selected sample. Tumors were most likely to occur in the peripheral zone, most concentrated in the right peripheral zone. High-grade cancer was most likely to occur along the boundaries of the organ in both the peripheral and transition zone, and some asymmetry was noted where tumors more prominently occurred in the right peripheral zone versus the left.Discussion
Our findings show tumors are most likely to occur in the peripheral zone, as anticipated from previous studies. Interestingly, atrophy is most likely to occur in the peripheral zone on the contralateral side from the cancer. Prominent asymmetry was observed, but this is likely to be an artifact of small sampling of histological sections in these regions. The inclusion of additional images with different contrasts (DWI, DCE) would further enhance the utility of the template for group studies. Likewise, greater numbers of subjects and higher histological sampling density would permit more refined conclusions regarding the propensity of tumors to be localized to different regions. These findings may have implications in the detection and biopsy sampling of prostate cancer.Conclusion
The MCW39 template provides a standard space for the group and populations based-analysis of prostate cancer. We provide both the template image and a proof of concept study looking at the statistical overlap of pathologist annotated prostate cancer. This study confirms that tumors are most likely to occur in the peripheral zone, and atrophy is most likely to occur on the contralateral side within the peripheral zone.Acknowledgements
Advancing a Healthier Wisconsin and the State of Wisconsin Tax Check off Program for Prostate Cancer Research. National Center for Advancing Translational Sciences, NIH UL1TR001436 and TL1TR001437, and RO1CA218144.References
1. Shah V, Pohida T, Turkbey B, et al. A method for correlating in vivo prostate magnetic resonance imaging and histopathology using individualized magnetic resonance-based molds. Rev Sci Instrum. 2009;80(10):104301
2. Nguyen HS, Milbach N, Hurrell SL, et al. Progressing Bevacizumab-Induced Diffusion Restriction Is Associated with Coagulative Necrosis Surrounded by Viable Tumor and Decreased Overall Survival in Patients with Recurrent Glioblastoma. AJNR Am J Neuroradiol. 2016.
3. Hurrell SL, McGarry SD, Kaczmarowski AL, et al. Optimized b-value selection for the discrimination of prostate cancer grades, including the cribriform pattern, using diffusion weighted imaging. 2017.
4. LaViolette PS, Mickevicius NJ, Cochran EJ, et al. Precise ex vivo histological validation of heightened cellularity and diffusion-restricted necrosis in regions of dark apparent diffusion coefficient in 7 cases of high-grade glioma. Neuro Oncol. 2014;16(12):1599-1606.
5. Avants, B. B., et al. (2011). "A reproducible evaluation of ANTs similarity metric performance in brain image registration." Neuroimage 54(3): 2033-2044.
6. Avants, B. B., et al. (2010). "The optimal template effect in hippocampus studies of diseased populations." Neuroimage 49(3): 2457-2466.
Figures