4495
Multi-echo T2 modelling to predict PIRADS 2.0 score1Centre for Medical Imaging, University College London, London, United Kingdom, 2Department of Radiology, University College London Hospital NHS Foundation Trust, London, United Kingdom, 3Centre for Medical Image Computing, University College London, London, United Kingdom
Synopsis
To investigate if Luminal Water Imaging (LWI), which models multi-compartment T2 decay, can predict the PIRADS 2.0 score of a region of interest (ROI). 52 patients were scanned using both standard mp-MRI and a 32-echo T2 sequence, ROIs were placed in areas of suspected lesion and suspected benign tissue and then these ROIs were each given a PIRADS 2.0 score. The results show that LWI can predict PIRADS 2.0 score as well as the Apparent Diffusion Coefficient (ADC).
Introduction
Luminal Water Imaging (LWI) is a method for calculating the percentage volume of lumen within a voxel using a multi-echo T2 sequence. LWI is strongly related to the fractional amount of luminal space in prostatic tissue1 and a recent study showed LWI to be feasible for the detection and grading of Prostate Cancer (PCa)2. Multi-echo T2 sequences do not suffer from the distortion and signal pile-up often observed in EPI-based diffusion imaging. The PIRADS 2.0 method of PCa detection and grading uses multi-parametric MRI. Not only does this method use diffusion images, which are prone to distortion due to magnetic susceptibility differences, but PIRADS also classifies a significant proportion of lesions as indeterminate3-5. The aim of this work was to examine the ability of LWI alone to predict PIRADS scores.Methods
Model The LWI model proposed in this work imposes constraints on the original proposed by Sabouri et al1. The model relating the Signal $$$S$$$ to the distribution $$$p$$$ of T2 values is: $$S = M_0 \int_{0}^{\infty}p(T2)exp(-\frac{TE}{T2})dT2$$ where $$$M_0$$$ is the overall magnitude of the signal and $$$TE$$$ is the echo time. LWI previously used a smoothed non-negative least squares (NNLS) fitting over a large number of variables to produce the distribution $$$p$$$6. Most voxels have previously shown signal components from two main tissue compartments1,2 so constraining the voxels to have no more than two compartments could provide a more robust fitting. Due to their ubiquity and simplicity, in this work $$$p$$$ is constrained to be composed of two Gaussian distributions. Six parameters were estimated voxel-wise: overall scaling ($$$M_0$$$), relative fraction between the two compartments (α), mean and standard deviation of the short T2 peak (μ1 and σ1) and mean and standard deviation of the long T2 peak (μ2 and σ2). The Luminal Water Fraction (LWF) was calculated as the area under the long T2 component divided by the area under both components.
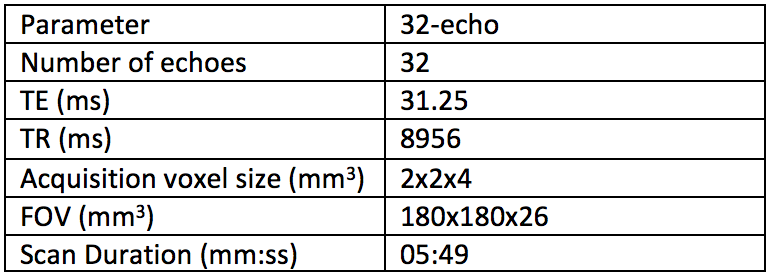
Data 52 patients were imaged using axial T2, diffusion and multi-echo T2 sequences. The scan parameters are included in Table 1. A board-certified radiologist contoured 51 lesions in 52 patients on all modalities, which were confirmed as cancers following targeted biopsy. Regions of interest (ROIs) were also placed in 34 areas of normal tissue in each of the subjects, all of which were histologically confirmed as benign. Then using the traditional multi-parametric MRI (mp-MRI) images a PIRADS score was attributed to each ROI. This PIRADS score is between 1-5 where 1-2 is unlikely clinically significant, 3 is indeterminate and 4-5 is likely clinically significant.
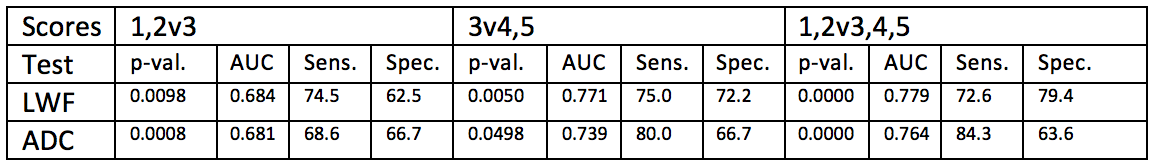
Comparisons The ability of LWI to differentiate between PIRADS scores was compared to that of the Apparent Diffusion Coefficient (ADC) using a linear mixed effects model and its ability to predict PIRADS score was assessed using a Receiver Operating Characteristic (ROC) analysis. Sensitivity and specificity values were calculated for the optimal threshold but the threshold value can be changed to trade off sensitivity for specificity and vice versa. Three comparisons were made:
- PIRADS 1&2 v PIRADS 3 – assesses how well LWF can tell a score of unlikely clinical significance from an indeterminate score
- PIRADS 3 v PIRADS 4&5 – assesses how well LWF can tell an indeterminate score from a clinically significant score
- PIRADS 1&2 v PIRADS 3,4&5 – assess how well LWF can tell a score that does not require further action from one that does
Results
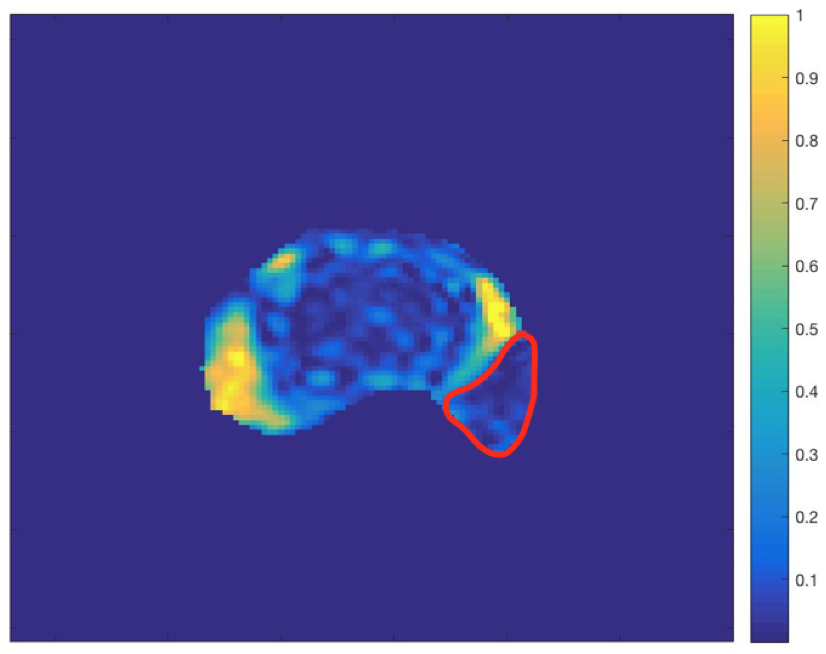
Figure 1 shows scan parameters for the 32-echo acquisition. Figure 2 shows the results of the statistical tests. The p-values show that there is a significant difference between all of the categories compared. The Area Under the Curve (AUC) values show that the LWF predicts PIRADS score as well as ADC. Figure 3 shows an example LWF map of the prostate. Highlighted in red is a PZ 3+4 tumour.Discussion
Despite the bias of this experiment towards ADC, given that the PIRADS scoring is based upon ADC images, the AUC results show that LWF is as good as and in some cases better than ADC at predicting PIRADS scores. Using these particular classifiers, the LWF offers more specificity than ADC for the 3v4,5 and 1,2v3,4,5 tests but sacrifices some sensitivity as a result. However, the sensitivity and specificity values were calculated for the optimal threshold and the AUC suggests that the threshold value could be changed to trade off less specificity for more sensitivity.Conclusion
The ability of LWI to predict PIRADS score combined with the fact that T2 imaging suffers far less from artefacts means that LWI is a promising new technique for detecting and grading PCa.Acknowledgements
Cancer Research UK through the Comprehensive Cancer Imaging Centre, Prostate Cancer UK and the NIHR funded biomedical research centre at UCLH.References
- Sabouri S., et al. “MR Measurement of Luminal Water in Prostate Gland: Quantitative Correlation Between MRI and Histology.” Journal of Magnetic Resonance Imaging 46, no. 3 (2017): 861-869
- Sabouri S., et al. “Luminal Water Imaging: A New MR Imaging T2 Mapping Technique for Prostate Cancer Diagnosis” Radiology 284, no. 2 (2017): 451-459
- Hansen N., et al. “Multicentre evaluation of targeted and systematic biopsies using magnetic resonance and ultrasound image-fusion guided transperineal prostate biopsy in patients with a previous negative biopsy.” BJU Int. 120, no. 5 (2017): 631-638
- Hansen N., et al. “Multicentre evaluation of Magnetic Resonance Imaging supported transperineal prostate biopsy in biopsy-naïve men with suspicion of prostate cancer.” BJU Int. Accepted Author Manuscript. doi:10.1111/bju.14049
- Grey A., et al. “Diagnostic accuracy of magnetic resonance imaging (MRI) prostate imaging reporting and data system (PI-RADS) scoring in a transperineal prostate biopsy setting.” BJU Int. 155, no. 5 (2015): 728-35
- Bjarnason T., et al. “AnalyzeNNLS: Magnetic resonance multiexponential decay image analysis” Journal of Magnetic Resonance 206, (2010): 200–204
Figures