4494
The repeatability of fully automated atlas-based prostate segmentation on T2-weighted MR images1Department of Circulation and Medical Imaging, NTNU, Norwegian University of Science and Technolog, Trondheim, Norway, 2St. Olavs Hospital, Trondheim University Hospital, Trondheim, Norway
Synopsis
Computer-aided diagnosis (CADx) systems have been proposed to overcome the limitations of the radiological reading of multiparametric MRI. Fully automated segmentation of the prostate is a crucial step of CADx systems, which can be successfully performed by atlas-based segmentation of T2-weighted (T2W) MR images. For applications like treatment monitoring and active surveillance, the repeatability of automated segmentation method is highly important. In this work, we investigated the repeatability of several fully automated atlas-based prostate segmentation methods. We found that the repeatability of the investigated methods is excellent, which is promising for the further development of CADx systems following patients with multiple measurements over time.
Purpose
Multiparametric MRI is a valuable tool for diagnosis of prostate cancer.1 However, radiological reading requires expertise, is time-consuming, and prone to inter-observer variability. To overcome these limitations, computer-aided diagnosis (CADx) systems have been proposed.2 Fully automated segmentation of the prostate is a crucial step in CADx, which relies on large datasets. Atlas-based segmentation of T2-weighted (T2W) MR images has been successfully applied for this purpose. For CADx applications based on multiple scans in time, such as active surveillance and response monitoring, repeatability is of paramount importance.2 Our aim was therefore to investigate the repeatability of fully automated atlas-based prostate segmentation.Methods
Datasets: In this study, we used three datasets of prostate T2W images. Two previously reported clinical datasets3,4 were used to confirm the performance of the automatic segmentation methods, while a healthy volunteer (HV) dataset was acquired for assessing their repeatability.
The clinical datasets included the training dataset from the PROMISE12 grand challenge (n=50), which is a multi-centre and multi-vendor dataset with different acquisition protocols,3 and a single centre dataset from a PET/MRI study in our own institute (n=28).4
The HV dataset (n=10) included healthy, asymptomatic, volunteers (median (range) age 31 (24-43) years) scanned with the same acquisition protocol on 3 different days using a 3T Skyra MRI scanner (Siemens, Erlangen, Germany). The median interval between scans 1 and 2, and 2 and 3, was 12 and 15 days, respectively. Transverse T2W images were acquired with TR/TE 7740/104 ms, matrix size 384x384, no. slices 26, slice thickness 3.0 mm, and in plane resolution 0.5x0.5 mm2.
Segmentation:
Manual segmentation of the HV dataset was separately performed by two different non-expert readers using ITK-SNAP.5 The results of Reader 1 were regarded the reference in this study, while those of Reader 2 were used for comparison. Expert segmentations were available for the clinical datasets.3,4
Automatic segmentation was performed with the following 4 atlas-based segmentation methods:
METHOD A: Multi-atlas segmentation with majority voting for label fusion.6
METHOD B: Similar to METHOD A, but with selective and iterative method for performance level estimation (SIMPLE) for label fusion.7
METHOD C: The two-stage multi-atlas segmentation method proposed by Tian et al.,8 with a first stage to detect the prostate location and a second stage to do the final segmentation. Majority voting and an adaptive threshold method based on mutual information were used for label fusion at stage 1 and 2, respectively.
METHOD D: Similar to METHOD C, but with SIMPLE for label fusion at both stages.7, 8
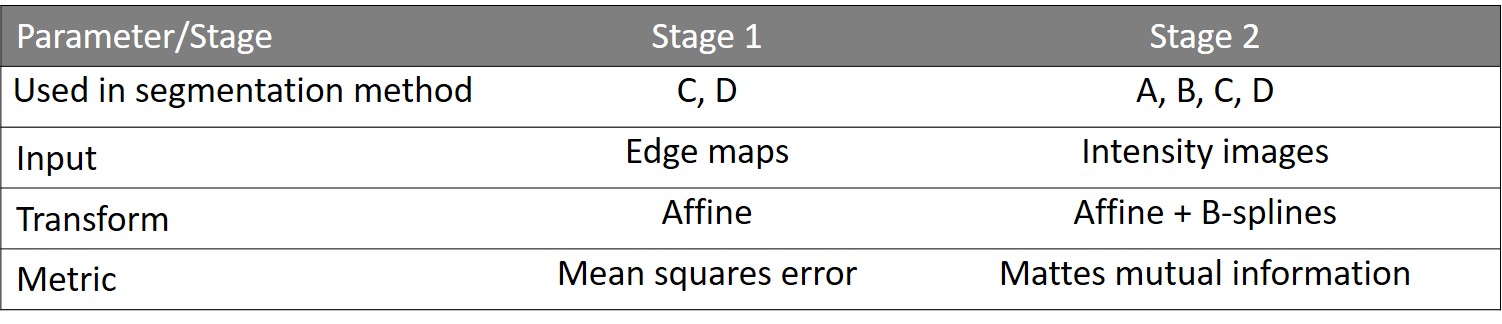
All methods were implemented in MATLAB (Mathworks, Natick, MA, USA). N4 bias field correction9 was applied before registration with elastix10 using the registration parameters specified in Table 1. The segmentation methods were trained and tested using leave-one-patient-out cross-validation, which was performed separately for each clinical cohort and each scan day of the HV cohort.
Statistical Analysis:
The dice similarity coefficient (DSC) was calculated as a metric of performance, according to
$$$DSC=\frac{2\mid R\cap E\mid}{\mid R\mid + \mid E\mid}$$$ (1),
where R is the reference segmentation and E is the estimated segmentation.11
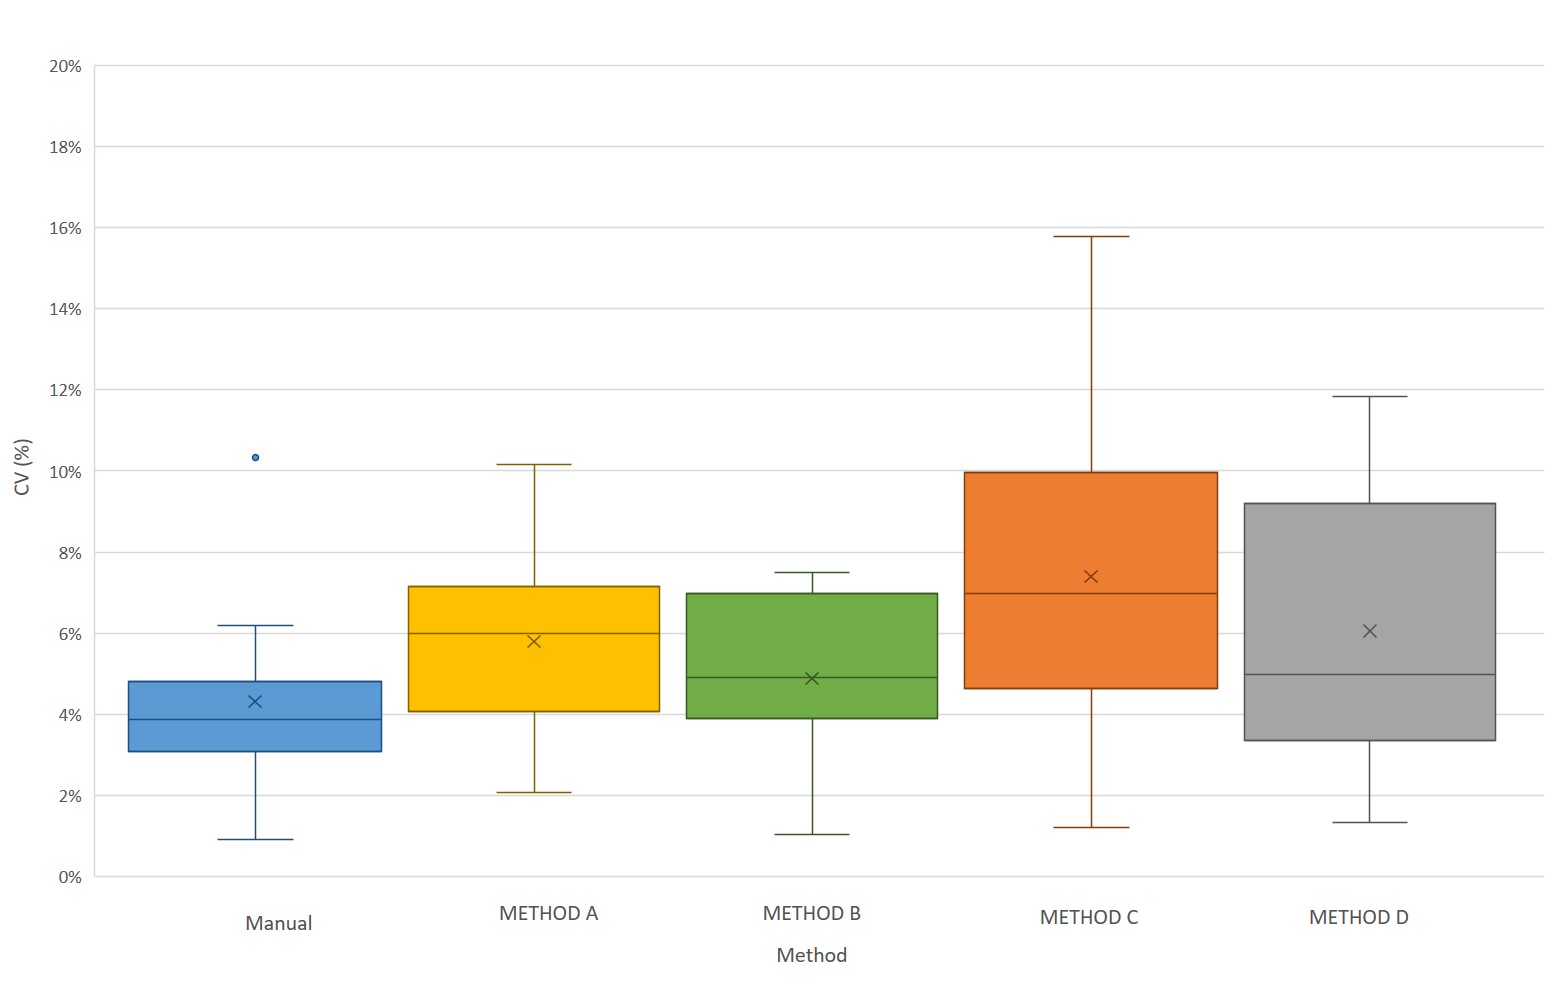
The volumes of the manual and automated segmentations were determined and the coefficient of variation (CV) was used to measure the repeatability of the segmentation methods, which was defined excellent when ≤0.1.12
The significance of differences in DSC, volume, and CV between methods was assessed with paired two-sample t-tests, followed by Benjamini-Hochberg correction for multiple testing.13
Results
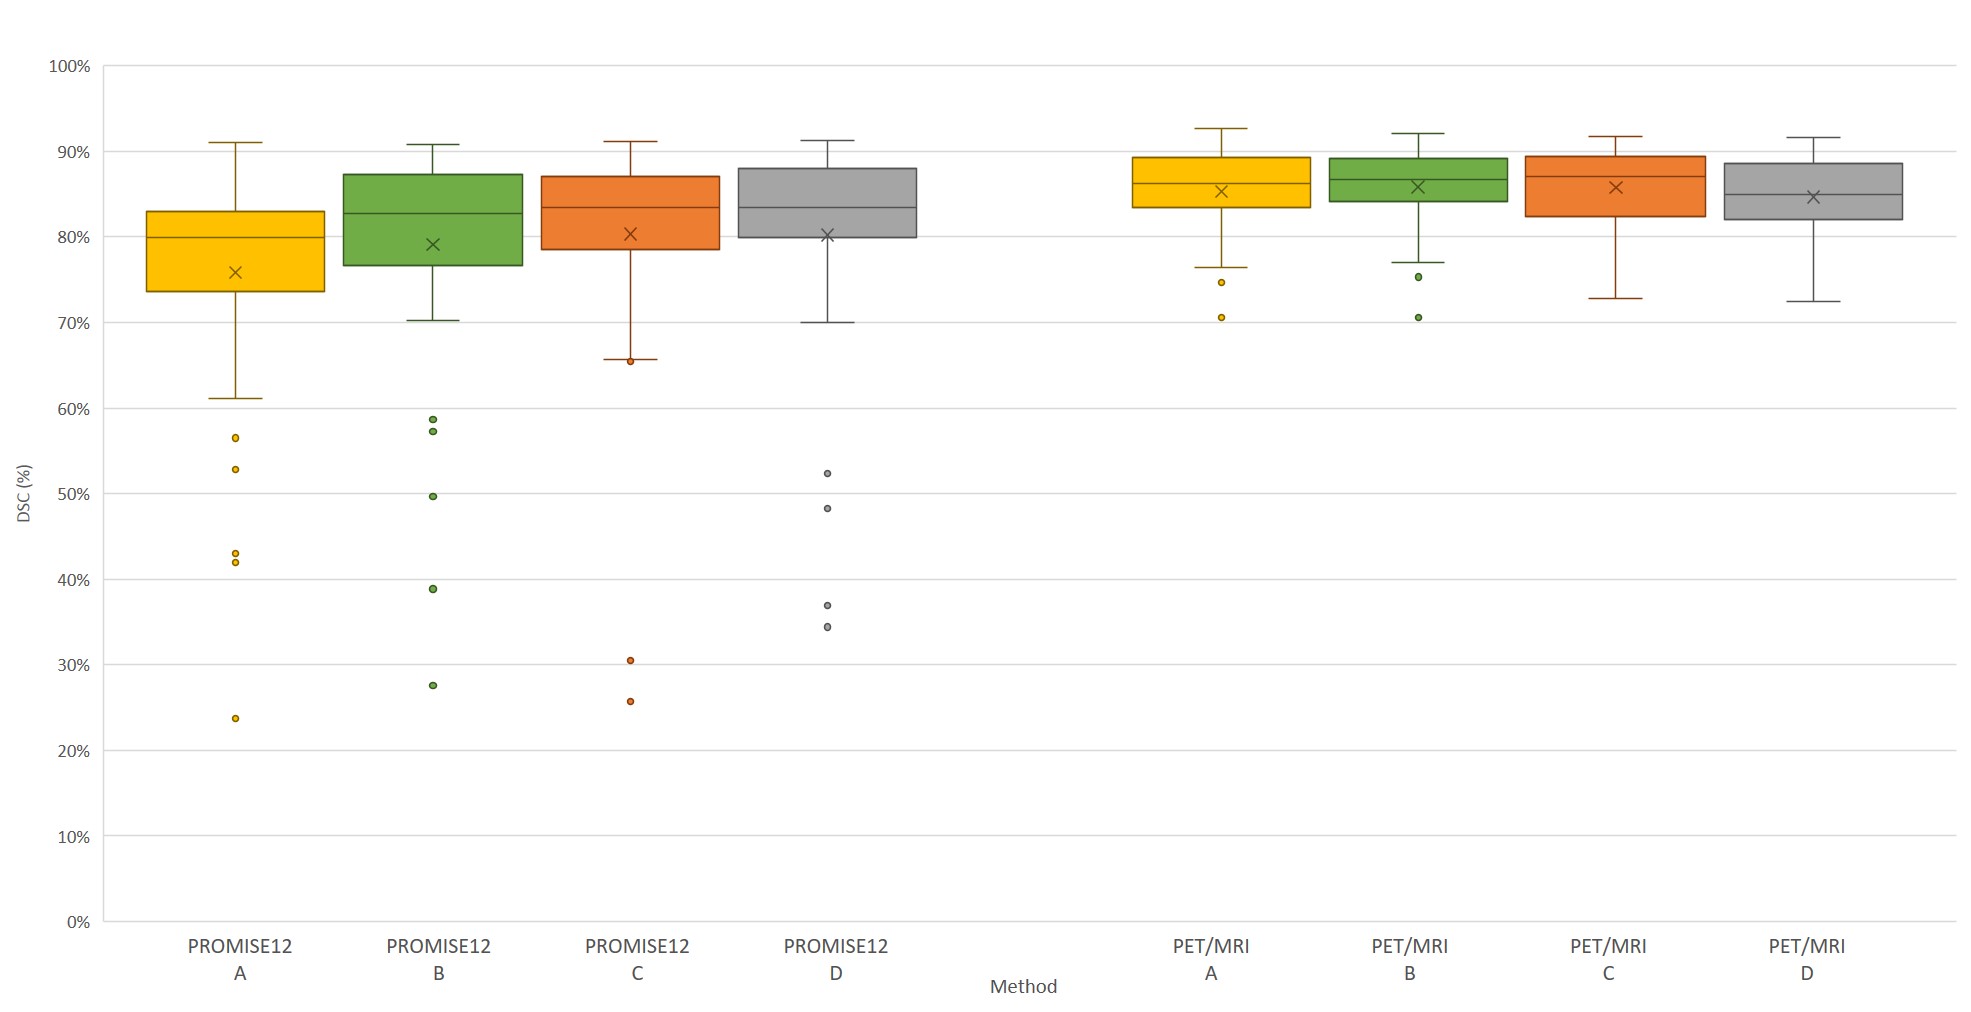
Clinical datasets: Figure 1 shows the performance of the segmentation methods. No significant differences in DSC were observed between them, except for METHOD A, which performed significantly worse than the others on the PROMSE12 cohort.
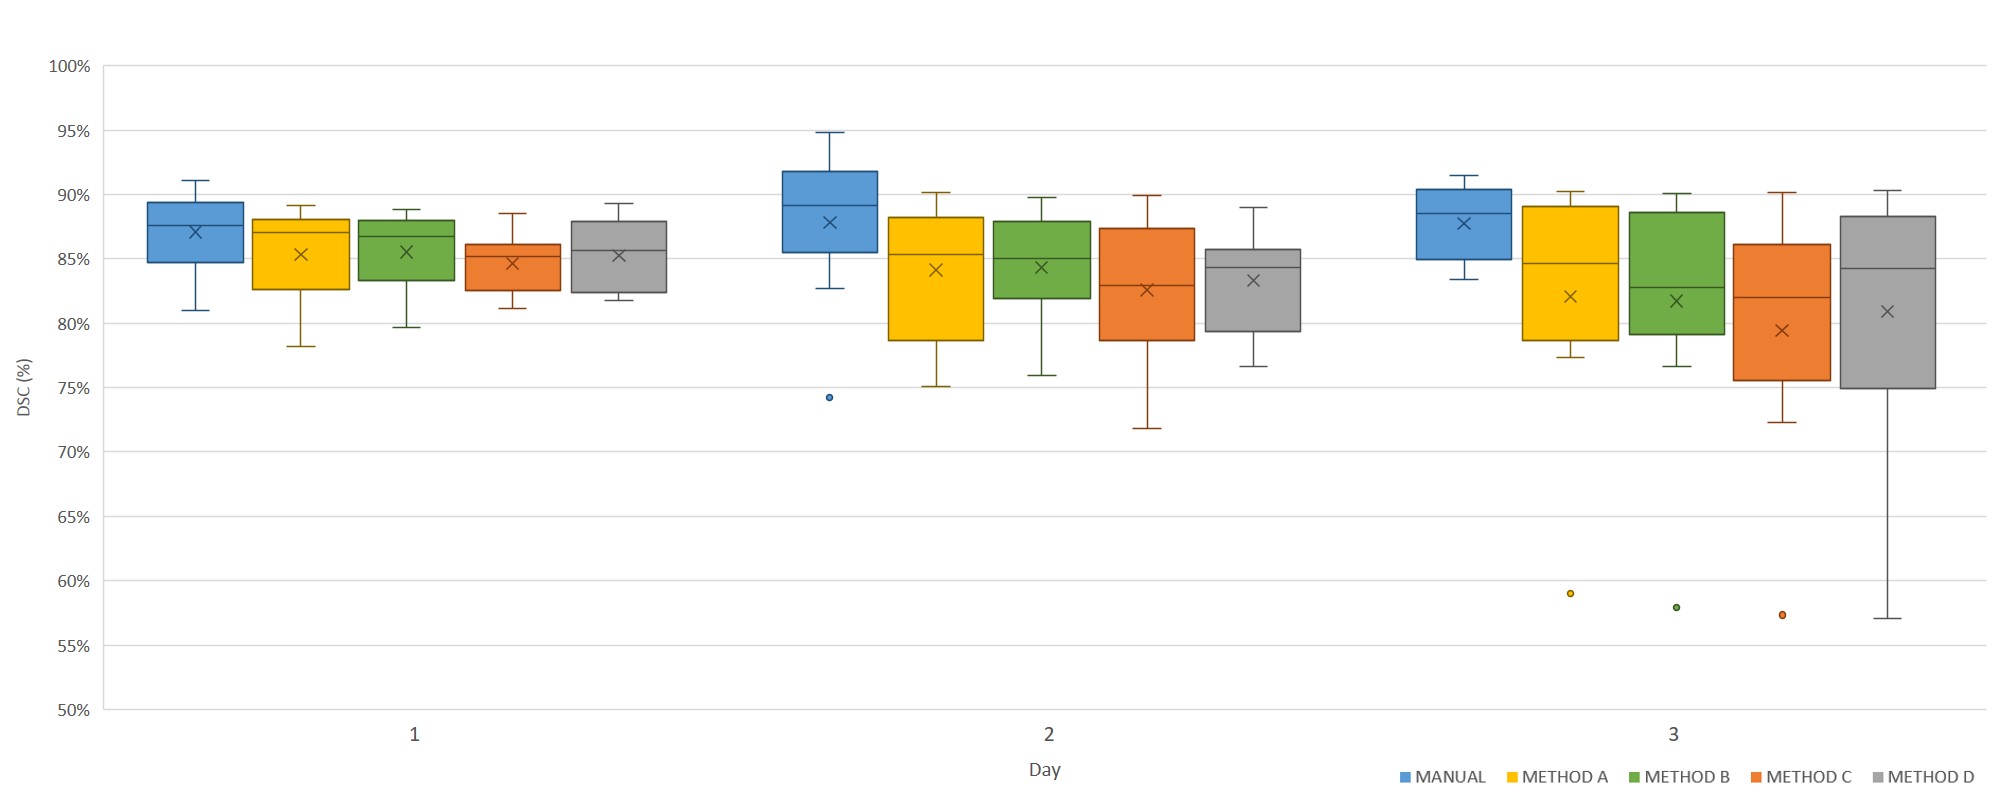
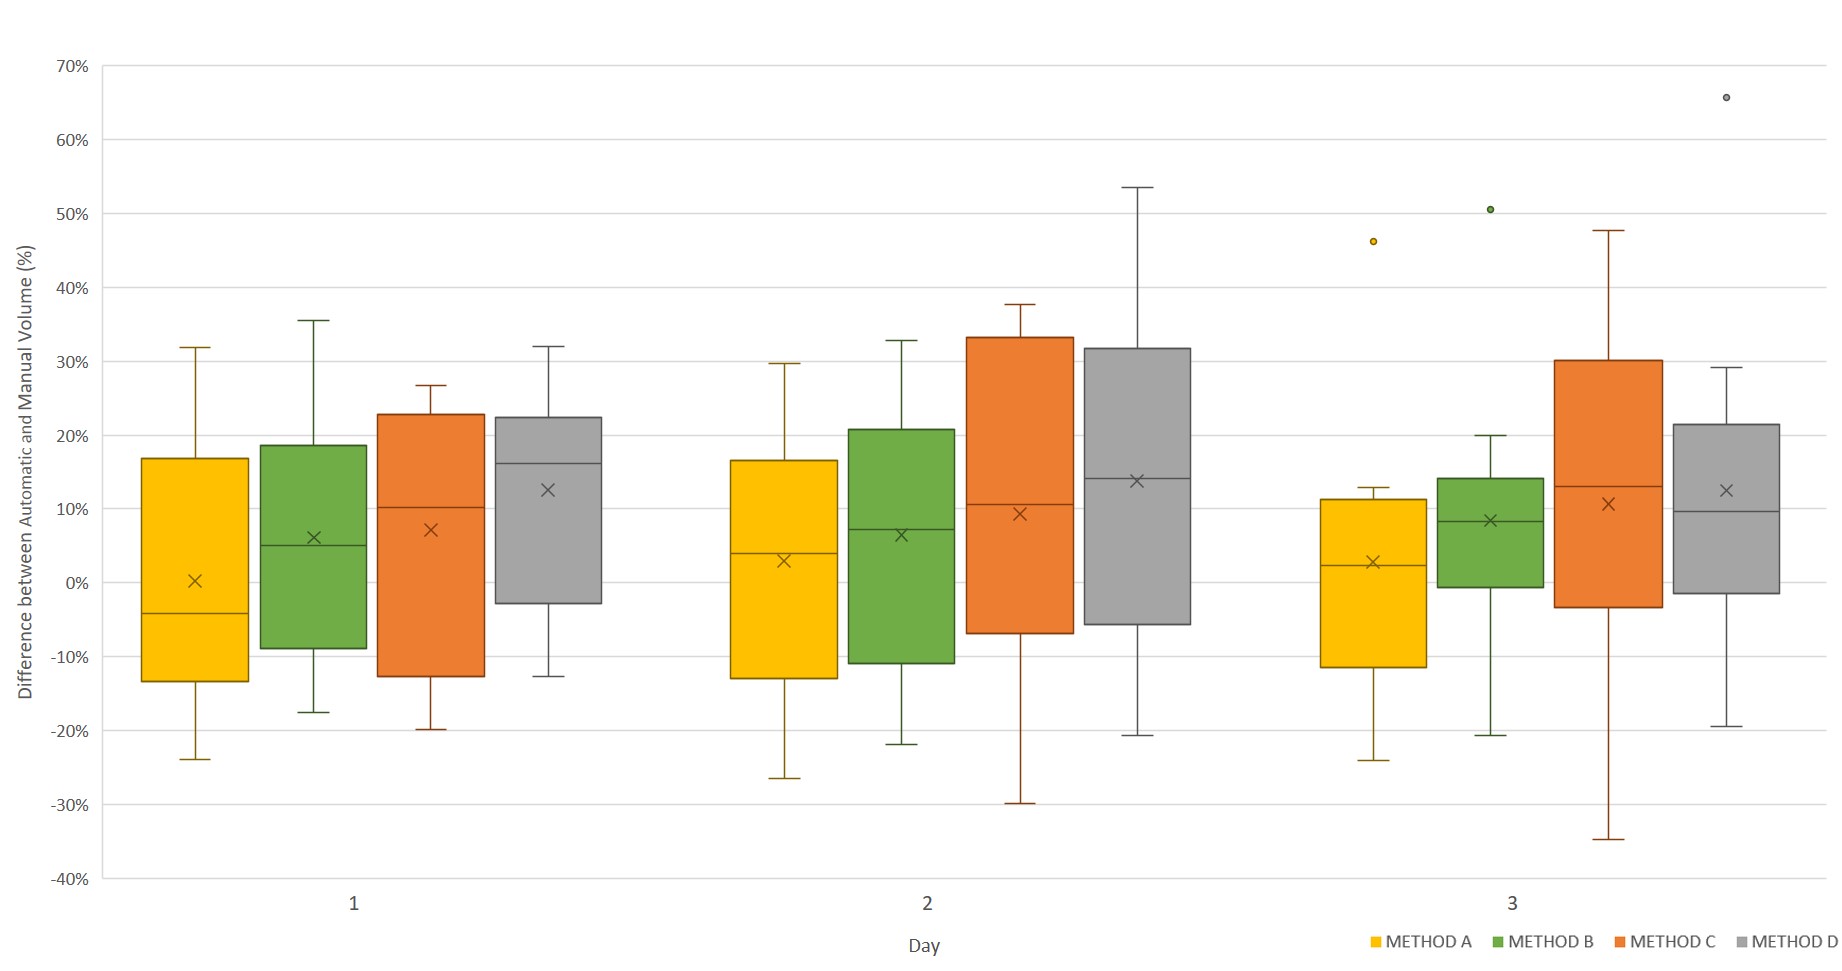
HV datasets: No significant differences in DSC were observed between segmentation methods on any day (Figure 2). Figure 3 shows that the atlas-based methods tended to over-estimate the volume of the prostate. The volumes of the segmented masks showed excellent average repeatability for both Reader 1 and the automated methods (Figure 4). Although no significant differences in CV were observed, METHOD B seemed to be the most stable for all patients.
Discussion
Our results indicate that the investigated fully automated atlas-based segmentation methods combine acceptable performance with excellent repeatability. The DSC values were in line with those expected from the literature.3,7,8 The methods performed surprisingly similar in the HV and PET/MRI cohorts, which may be due to the relative homogeneity of these single centre cohorts. For the large and more varied PROMISE12 dataset, the method without label selection (METHOD A) performed significantly worse than the others. Overall, METHOD B may be a good approach to incorporate in CADx systems that aim to assess changes in quantitative MRI parameters over time.Conclusion
The repeatability of fully automated atlas-based prostate segmentation is excellent.Acknowledgements
No acknowledgement found.References
- Hassanzadeh E, Glazer DI, Dunne RM, et al. Prostate Imaging Reporting and Data System Version 2 (PI-RADS v2): A pictorial review. Abdominal radiology (New York). 2017;42(1):278-289.
- Lemaître G, Martí R, Freixenet J, et al. Computer-Aided Detection and diagnosis for prostate cancer based on mono and multi-parametric MRI- A review. Computers in Biology and Medicine. 2015;60(C):8–31.
- Litjens G, Toth R, van de Ven W, et al. Evaluation of prostate segmentation algorithms for MRI: the PROMISE12 challenge. Medical image analysis. 2014;18(2):359-373.
- Elschot M, Selnæs KM, Sandsmark E, et al. A PET/MRI study towards finding the optimal [18F]Fluciclovine PET protocol for detection and characterisation of primary prostate cancer. European Journal of Nuclear Medicine and Molecular Imaging. 2017;44(4):695-703.
- Yushkevich PA, Piven J, Hazlett HC, el al. User-guided 3D active contour segmentation of anatomical structures: Significantly improved efficiency and reliability. Neuroimage. 2006;31(3):1116-28.
- Kittler J. Combining classifiers: A theoretical framework. Pattern Analysis and Application. 1998;1(1):18–27.
- Langerak TR, Van der Heide UA, Kotte AN, et al. Label Fusion in Atlas-Based Segmentation Using a Selective and Iterative Method for Performance Level Estimation (SIMPLE). IEEE Transactions on Medical Imaging. 2010;29(12):2000-2008.
- Tian Z, Liu L, Fei B. A fully automatic multi-atlas based segmentation method for prostate MR images. Proceedings of SPIE--the International Society for Optical Engineering. 2015;9413:941340.
- Tustison NJ, Avants BB, Cook PA, et al. N4ITK: Improved N3 Bias Correction. IEEE transactions on medical imaging. 2010;29(6):1310-1320.
- Klein S, Staring M, Murphy K, et al. elastix: a toolbox for intensity-based medical image registration. IEEE Trans Med Imaging. 2010;29(1):196-205.
- Klein S, van der Heide UA, Lips IM, et al. Automatic segmentation of the prostate in 3D MR images by atlas matching using localized mutual information. Medical Physics. 2008;35(4):1407–1417.
- Kakite S, Dyvorne H, Besa C, et al. Hepatocellular carcinoma: short-term reproducibility of apparent diffusion coefficient and intravoxel incoherent motion parameters at 3.0T. Journal of Magnetic Resonance Imaging. 2015;41(1):149-156.
- Benjamini Y, Hochberg Y. Controlling the false discovery rate: a practical and powerful approach to multiple testing. Journal of the Royal Statistical Society, Series B. 1995;57(1):289–300.
Figures