4493
Dynamic Contrast-Enhanced MRI of the Prostate with Single-Echo Dixon Fat Suppression1Radiology, Mayo Clinic, Rochester, MN, United States, 2Radiology, Mayo Clinic, Scottsdale, AZ, United States
Synopsis
The purpose of this work was to adapt our current clinical DCE-MRI protocol to allow for single-echo Dixon fat suppression and maintain image update times <10s. Single-echo Dixon imaging with spatial resolution that matched our current clinical protocol was performed with sub-10s update times and near-optimal Dixon SNR by increasing the readout bandwidth from ±62.5 to ±83.3 kHz. Additionally, pharmacokinetic modelling results look similar to those produced from the standard DCE-MRI protocol. DCE-MRI of the prostate with single-echo Dixon fat suppression provides high spatial and temporal resolution dynamic imaging of contrast uptake without the presence of confounding fat signal.
Introduction
Prostate cancer (pCa) is the most common non-cutaneous cancer in men in the United States (1), but despite its high occurrence is treatable if detected early. Multi-parametric MRI has been shown to have both high sensitivity and specificity for pCa diagnosis (2–4). DCE-MRI with quantitative pharmacokinetic modeling is an important component of the exam, providing guidance for equivocal peripheral zone lesions and for localizing biochemically recurrent lesions. Background suppression for DCE-MRI, either through time subtraction or other means, improves the conspicuity of enhancing lesions. However, time-subtraction reduces signal-to-noise ratio (SNR) and can result in motion-induced misregistration artifacts.
Single-echo Dixon imaging retains SNR while suppressing the lipid background signal (5). Additionally, more robustness to motion is expected due to the spatially smooth nature of the quantities estimated from pre- or post-contrast calibration data. Single-echo Dixon imaging has been previously used for breast DCE-MRI with temporal resolution on the order of 30 sec (6). However, the Prostate Imaging – Reporting and Data System version 2 (PI-RADS v2) suggests a temporal resolution of <10 sec (4). Recently, single-echo Dixon techniques have achieved image update times of <5 sec for contrast-enhanced MR angiography (CE-MRA) (7). The protocols used for CE-MRA and DCE-MRI are similar, both using T1-weighted gradient echo sequences, but differ in pulse sequence spatiotemporal resolution, the use of background subtraction during reconstruction, and the typical axial format for DCE-MRI vs. sagittal or coronal format for CE-MRA. The purpose of this work was to adapt our current clinical DCE-MRI protocol to allow for single-echo Dixon fat suppression while maintaining an image update time of <10s.
Methods
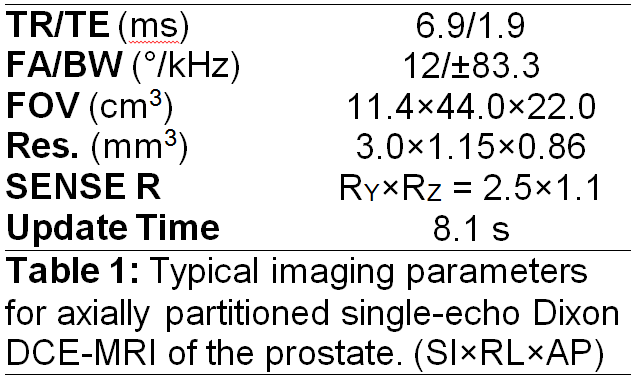
The single-echo Dixon DCE-MRI protocol was modeled after the conventional (non-Dixon) DCE-MRI protocol currently in clinical use for prostate imaging at our institution (8); however, to maintain the spatial resolution in the frequency encode direction and achieve an echo time near the SNR optimum for single-echo Dixon (nπ/2 phase shift between water and fat, for odd n), the readout bandwidth was increased from ±62.5kHz to ±83.3kHz. This change allowed for an echo time of 1.9msec, which is within 80% of the peak SNR (TE~1.7msec) given the other scan parameters (5). Typical imaging parameters are shown in Table 1. A single dose of macrocyclic gadolinium-based contrast agent gadoterate meglumine (Dotarem; Guerbet LLC, Villepinte, France) was used in accordance with our clinical protocol.
To facilitate single-echo Dixon reconstruction, estimates of static background B0 inhomogeneity and initial phase (e.g., from RF phase or eddy currents) were obtained from a dual-echo Dixon calibration scan using a constrained-phase reconstruction with graph-cuts optimization (9). These parameter estimates were used to perform water/fat separation for all frames of the contrast-enhanced single-echo Dixon exam and provide a time-series of fat-suppressed images.
Pharmacokinetic modeling with the Tofts model (10,11) was performed on the DCE-MRI time series to determine if both sequences provide consistent estimates of the quantitative perfusion parameters Ktrans and kep.
Results
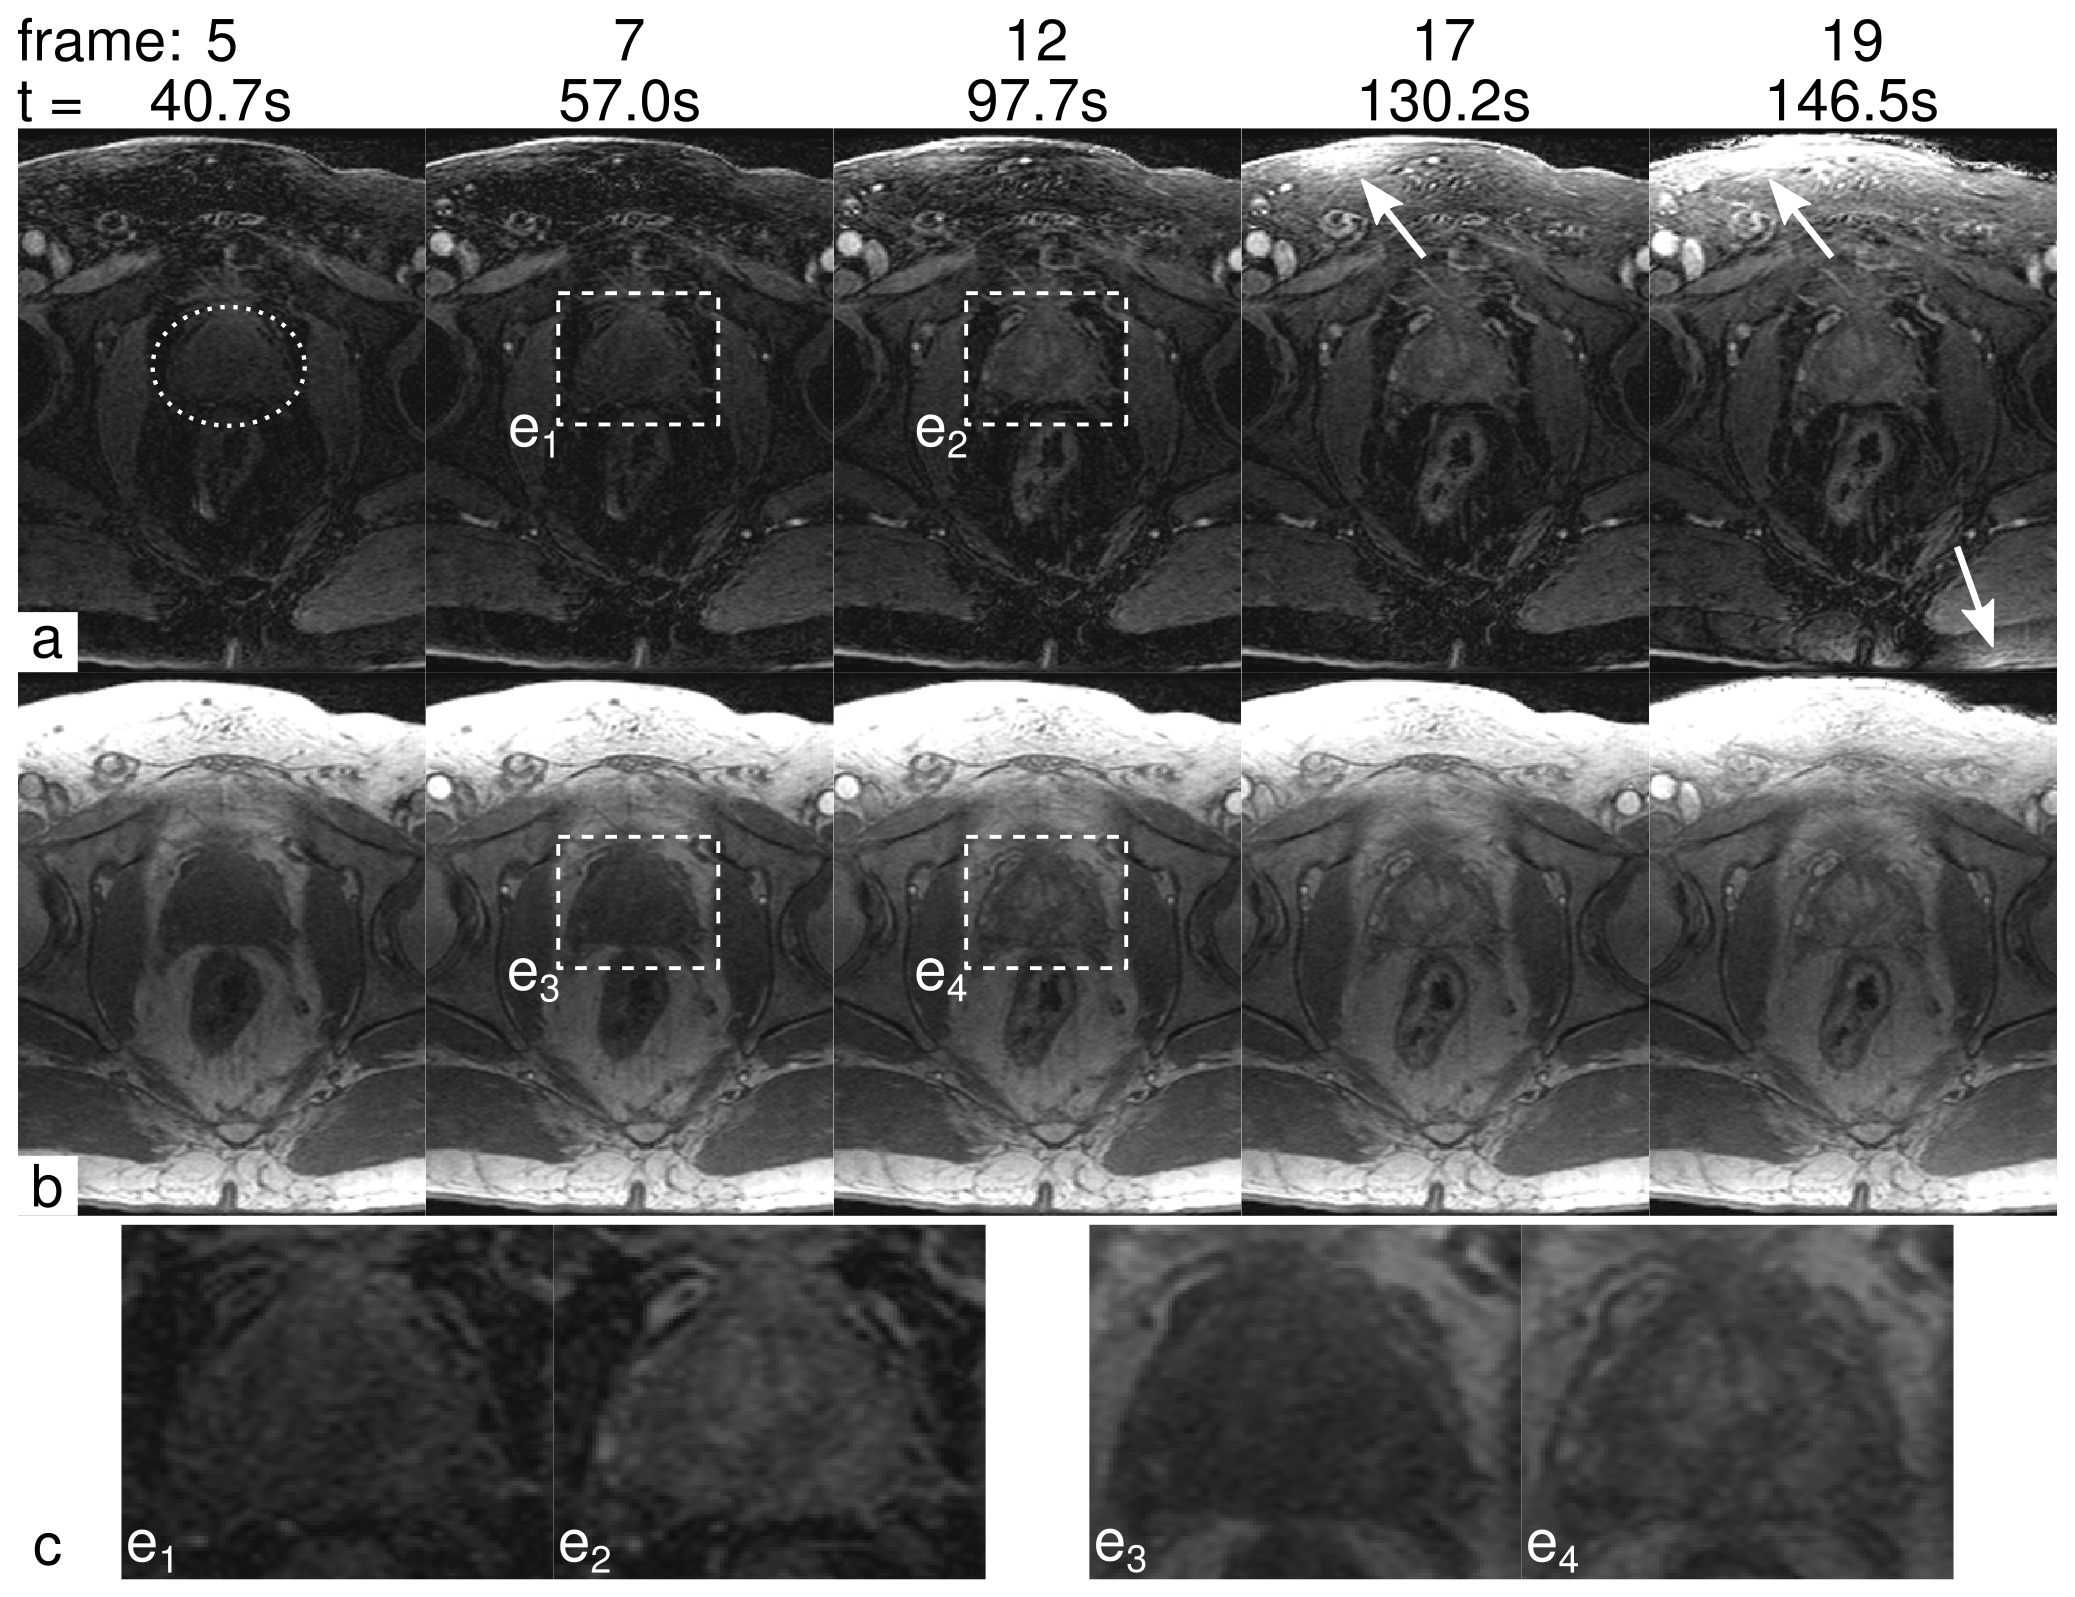
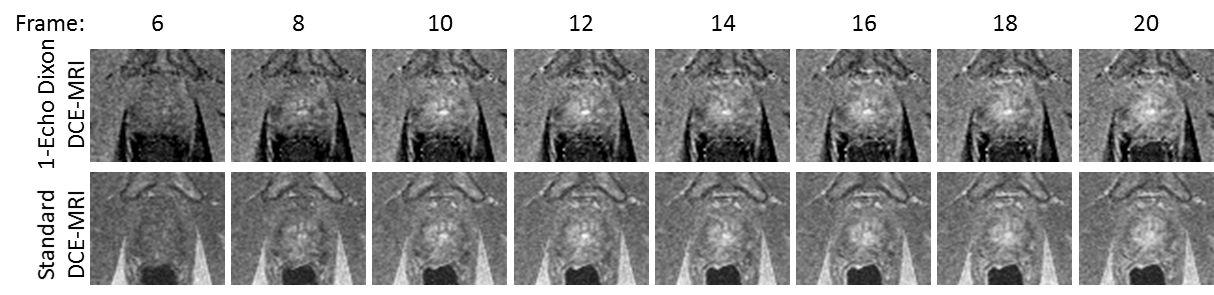
Figure 1 depicts selected frames from a time-resolved DCE-MRI prostate exam using the proposed single-echo Dixon sequence (a) and the standard, non-Dixon, non-subtractive technique (b). Observe that the fat suppression in the single-echo Dixon images is excellent, and that the vasculature within the fat is better depicted. Some fat signal leakage occurred as a result of major respiratory motion during the scan (Frames 17 and 19, arrows). The region near the prostate was unaffected. Figure 2 shows another time-resolved prostate exam, again showing excellent fat suppression while depicting the uptake of contrast in the prostate.
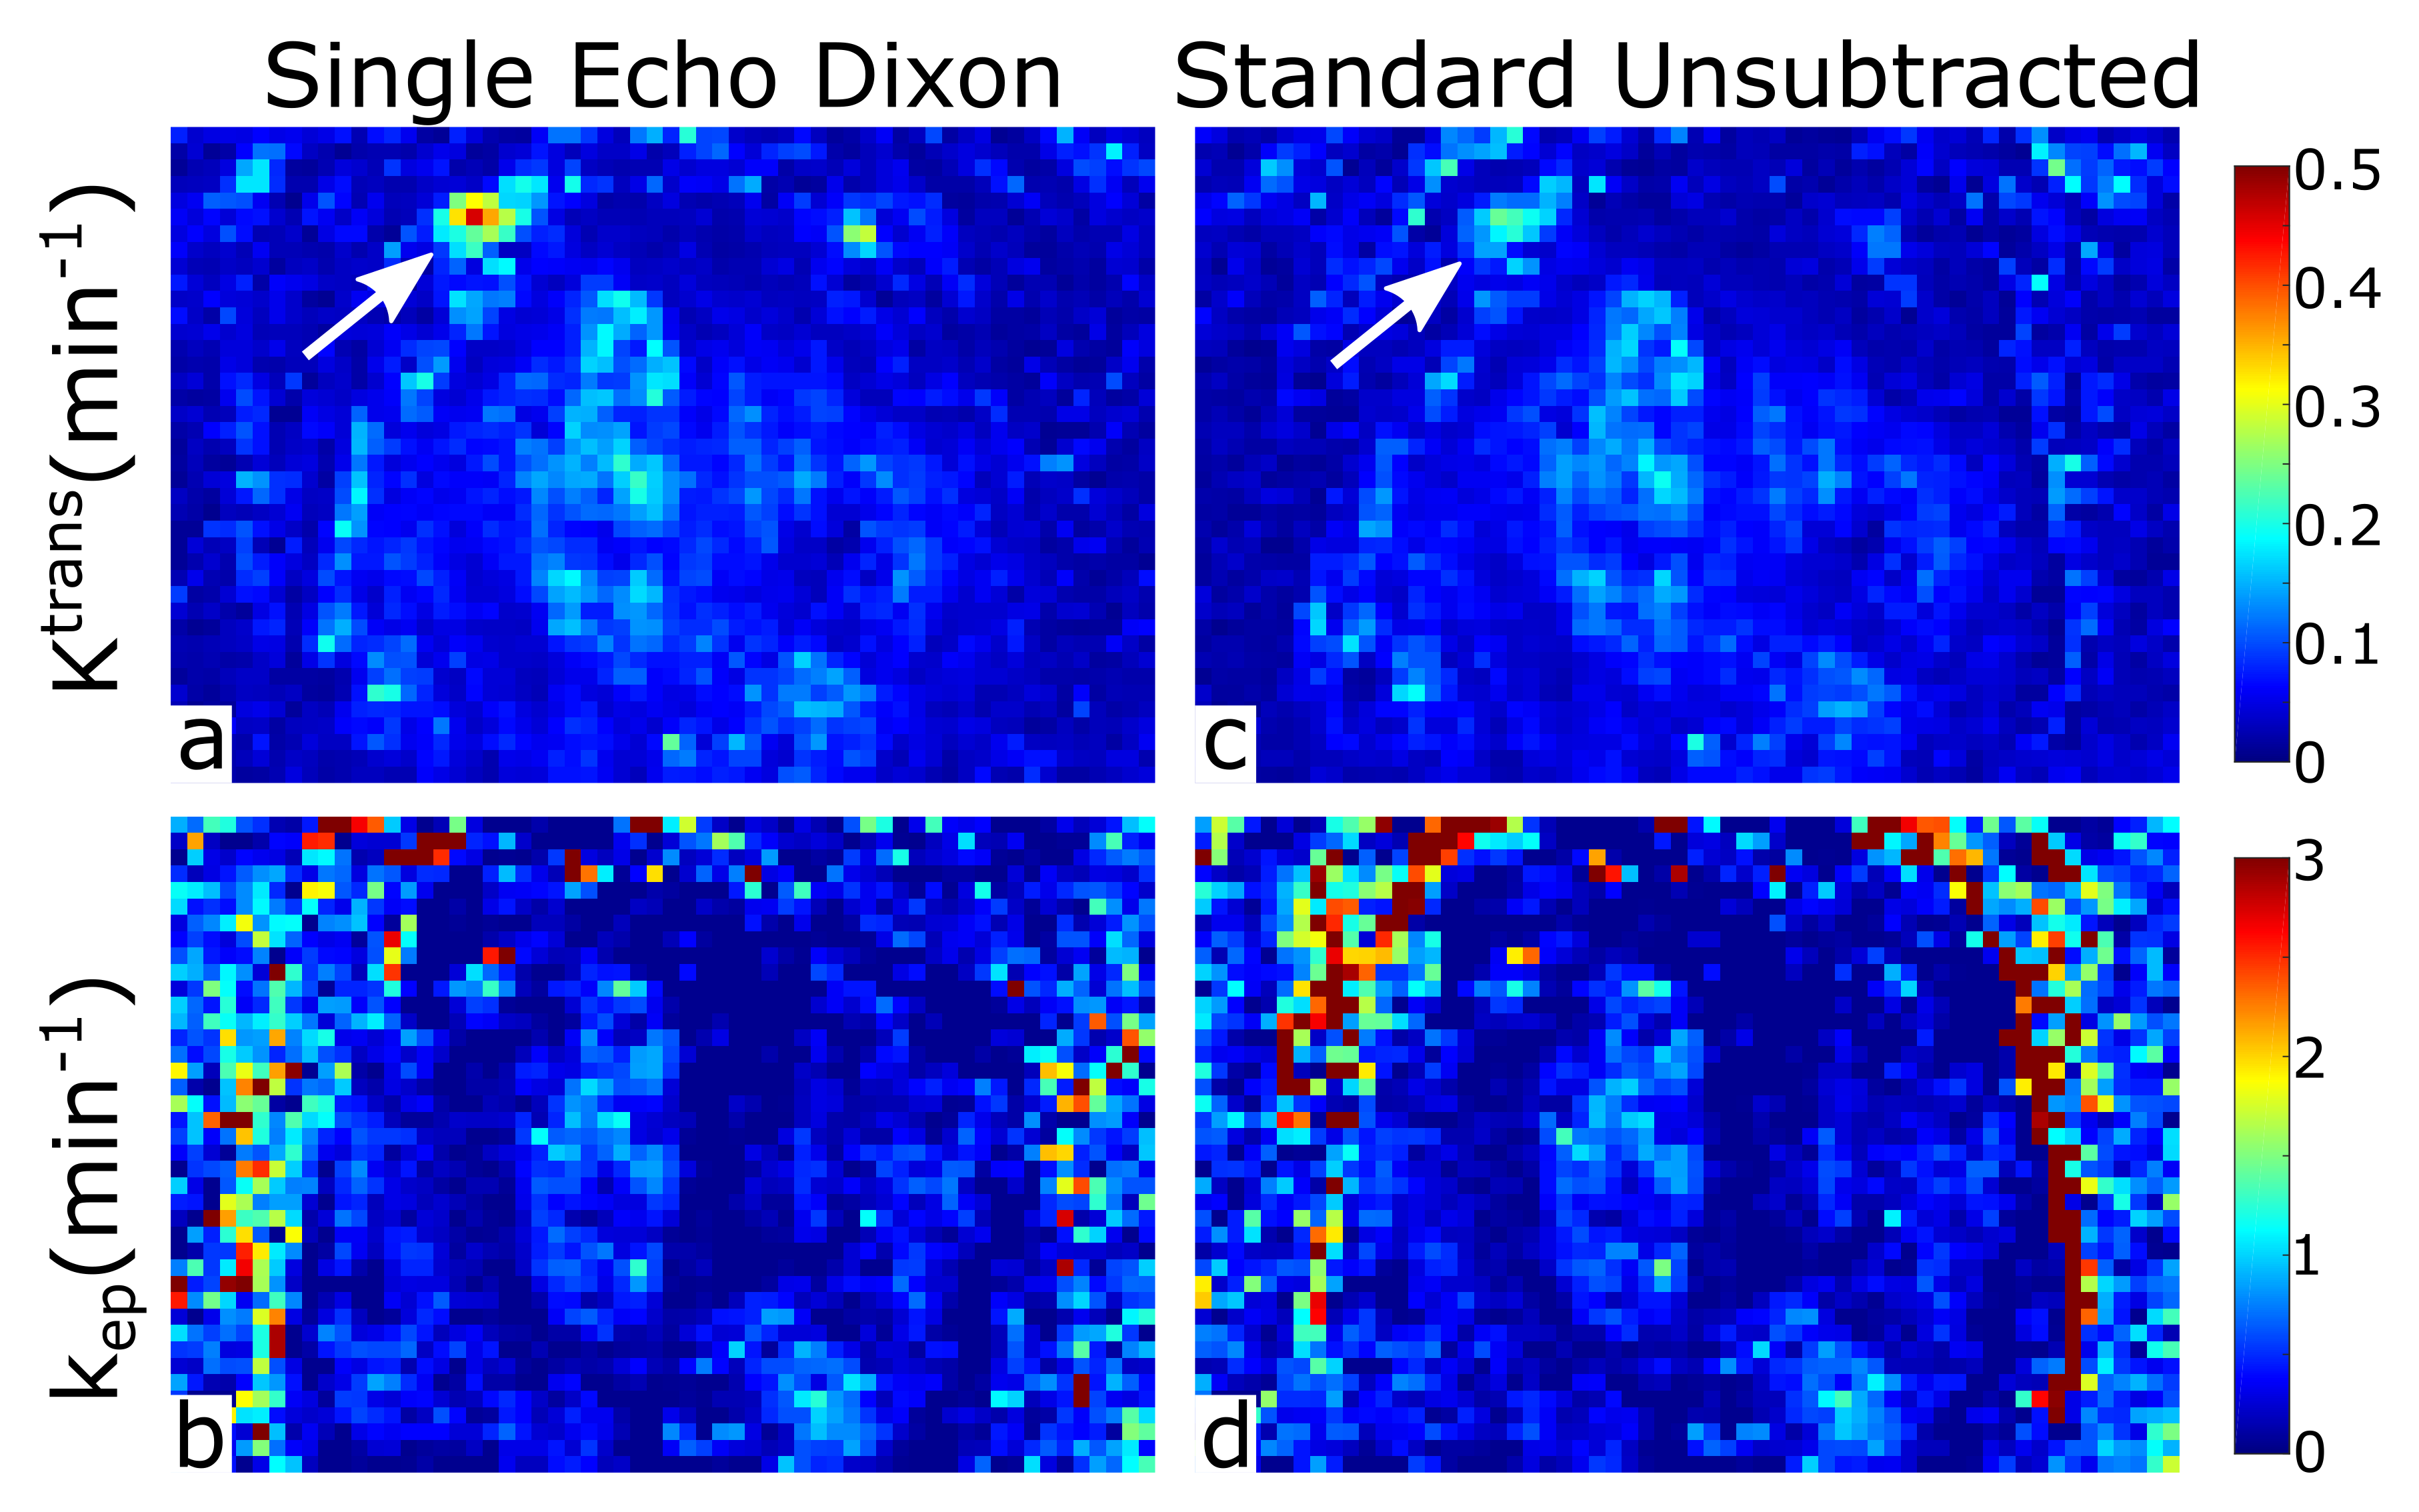
Maps of the Tofts model parameters Ktrans and kep are shown in Figure 3. The model parameters are similar when estimated from the single-echo Dixon dataset and the standard non-subtractive, non-Dixon dataset, showing that pharmacokinetic modeling can be performed on the single-echo Dixon images that feature improved lesion conspicuity.
Discussion
We have successfully demonstrated time-resolved single-echo Dixon imaging in combination with prostate DCE-MRI. Single-echo Dixon uses pre-contrast estimates of the "nuisance" phase parameters, and may be susceptible to changes (motion, contrast inflow) between the dual-echo calibration and the time-resolved series. While single-echo Dixon is tolerant of some amount of motion, major motion can cause a small amount of fat signal leakage into the water image (Figure 1, arrows). In general, however, these artifacts don’t affect the region immediately adjacent to the prostate. Future work will investigate additional methods of avoiding motion-induced artifacts, including estimation of dynamic field maps and virtual shimming (12). In conclusion, DCE-MRI of the prostate with single-echo Dixon fat suppression provides high spatial and temporal resolution dynamic imaging of contrast uptake without the presence of confounding fat signal.Acknowledgements
The authors would like to acknowledge study coordinator Kathy Brown and the following sources of funding: NIH EB000212, NIH RR018898, DOD W81XWH-15-1-0341, Mayo Clinic Discovery Translation Program.References
- Natl. Cancer Inst. https://www.cancer.gov/types/prostate.
- Delongchamps NB et al. BJU Int. 2011;107:1411–1418.
- de Rooij M et al. Am. J. Roentgenol. 2014;202:343–351.
- Weinreb JC et al. Eur. Urol. 2016;69:16–40.
- Stinson EG et al. Magn. Reson. Med. 2015;74:81–92.
- Yu H et al. Magn. Reson. Med. 2006;55:413–422.
- Stinson EG et al. In: Proceedings of the 25th Annual Meeting of ISMRM. Honolulu, Hawaii, USA; 2017. p. 3264.
- Froemming AT et al. In: Proceedings of the 23rd Annual Meeting of ISMRM. Toronto, Canada; 2015. p. 1169.
- Stinson EG et al. Magn. Reson. Med. 2017 ePub ahead of print. DOI:10.1002/mrm.26620.
- Tofts PS et al. Magn. Reson. Med. 1991;17:357–367.
- Kargar S et al. In: ISMRM Workshop. Sedona AZ; 2016.
- Xiang Q-S. In: Proceedings of the 9th Annual Meeting of ISMRM. Glasgow, Scotland, UK; 2001. p. 789.
Figures