4492
Synthetic 3D reconstruction1Radiology, Mayo Clinic, Rochester, MN, United States
Synopsis
A new method is described in which slice profile in 2D multi-slice acquisition is corrected for with k-space-based processing, restoring resolution along the slice select direction. When used with multiple multi-slice acquisitions the method may allow isotropic 3D resolution. The method is described, and preliminary results from phantom and prostate MRI exams are presented.
Purpose
Two-dimensional (2D) multi-slice T2-weighted spin-echo (T2SE) acquisition is used in essentially 100% of clinical prostate MRI exams. However, slice thickness is typically 3–6× coarser than inplane resolution and can limit interpretation. This is often accounted for by acquiring 2D multi-slice images in two or three of the orientations: axial (A), coronal (C), sagittal (S). Directly acquired 3D T2SE images are typically compromised by reduced resolution and contrast1. The purpose of this work is to describe how multi-slice images can be used to form a 3D data set. The novel aspect is that transforming the acquired multi-slice data along the slice direction into k-space allows correction of the slice profile, enabling improved resolution.Methods
The approach is illustrated in Figure 1. Figure 1A shows a set of slices acquired in a 2D multi-slice scan with slice selection along Z. The inplane sampling is r, the slice thickness T, and the slice-to-slice spacing S. For illustration assume T:r is 4:1 and S>T. The idea of the approach is to transform the acquired slice information along Z while maintaining the signals in $$$k_X-k_Y$$$ space. Assuming frequency encoding is along $$$k_X$$$, only the $$$k_Y-k_Z$$$ plane is shown (Fig. 1B). Full sampling of k-space is assumed to extend from -1/2r to +1/2r in both directions. The rect-like slice thickness T imposes a sinc-like low-pass filter of width 2/T along $$$k_Z$$$, with the shaded passband shown. Sampling slices at spacing S along Z causes the passband signals to be replicated at intervals of 1/S along $$$k_Z$$$, shown as the dashed horizontal lines, creating aliasing.
The reconstruction can be expressed mathematically. Define $$$\vec{k}$$$ as the desired, unknown, high resolution k-space data vector of size N (assumed here to be along Z) for a specific $$$\left(k_X,k_Y\right)$$$. The multi-slice process subjects $$$\vec{k}$$$ to slice-select-based modulation and shifted replications, both expressed as matrices. This is further down-sampled to match the number M of slices along Z (M<N). This can be expressed as:
$$F \cdot \vec{z} = D \cdot \left \{ A_0 + A_{-1} + A_{+1} + \ldots \right \}\cdot B \cdot \vec{k}\tag{1}$$
where $$$F$$$ is the M-point Fourier transform, $$$\vec{z}$$$ the M×1 acquired data vector along Z, $$$D$$$ is the M×N down-sampling matrix, $$$A_i$$$ express the replications at offsets i(1/S) due to the k-space aliasing (with $$$A_0$$$ the identity matrix $$$I_N$$$), and $$$B$$$ is the N×N diagonal matrix describing the $$$k$$$ modulation due to slice selection. Inversion of Eq. 1 yields an estimate of $$$\vec{k}$$$.
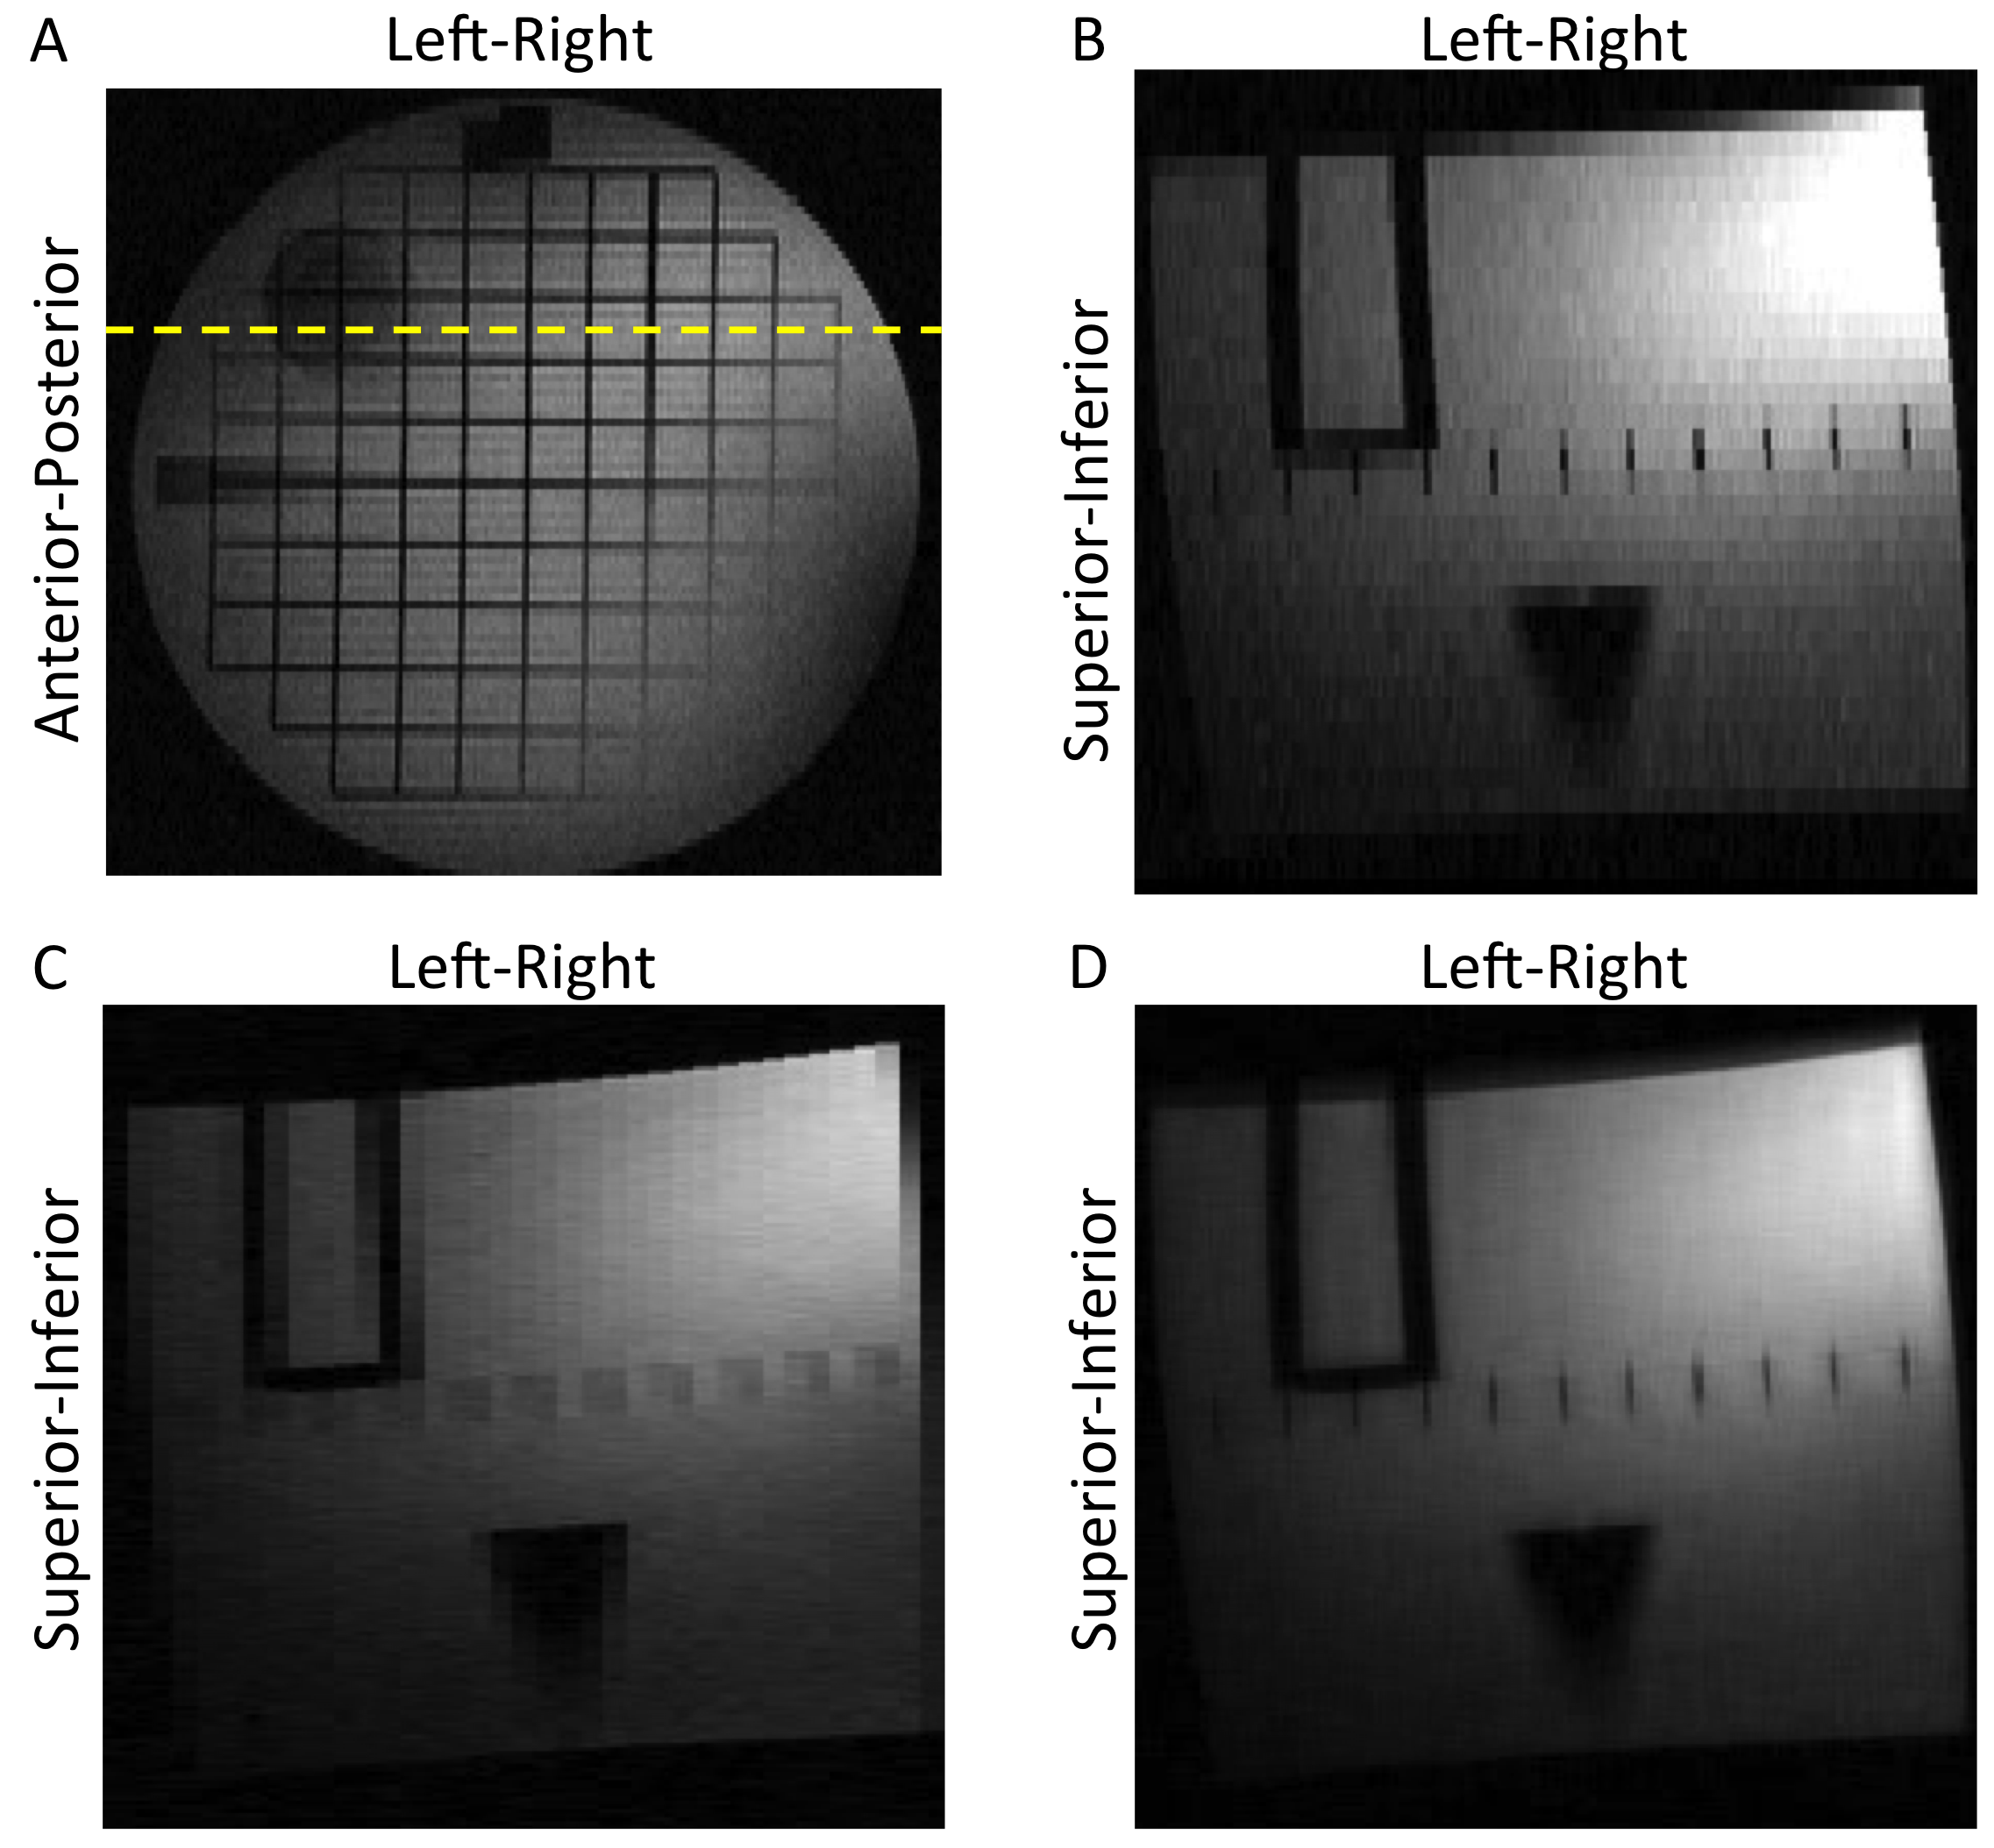
The algorithm of Eq. 1 was tested experimentally in T2SE images of a phantom and of subjects having a prostate MRI exam (for which multi-slice images in A, C, and S orientations are typically all acquired). In the experiments the acquired images were contiguous; i.e. S=T. Also, the algorithm was extended by taking multi-slice data from two orientations (A and C), applying Eq. 1 individually to each and combining results for improved $$$k_Y$$$-$$$k_Z$$$ coverage (Fig. 1C).
Results
Results from a human prostate study using a single multi-slice T2SE set (axial) are shown in Figure 2. Figure 2A shows one of the acquired images. The axial images were stacked and a sagittal section through the line shown in (A) is presented in (B), showing clear stair-stepping. Use of the new algorithm of Eq. 1 yields the result in (C) which improves the apparent resolution. This is similar to zero padding as might be expected with use of a single set of contiguous slices. Use of axial and sagittal multi-slice sets in a phantom is illustrated in Figure 3. The line in the axial section (A) identifies the target coronal section. Images of that section formed from stacked axial and sagittal acquired slices are shown in (B) and (C) respectively, both showing stair-stepping. Figure 3D shows the same section formed synthetically from both sets. Note the improved sharpness along the inplane directions with markedly diminished stair-stepping artifact without perceptible contrast loss.Discussion
We have presented a new approach for generating 3D images from 2D multi-slice data. The novel element is k-space-based correction for slice profile, a correction going beyond zero padding2. The k-space approach provides considerable flexibility vs. image-space-based super-resolution techniques3. Figure 3 illustrated usage when multiple orientations are used. The method is also applicable to multi-NEX acquisition in which the time spent for averaging could be exchanged with overlapped slices (S<T), reducing the aliasing along kZ. This could possibly eliminate the coronal and sagittal T2SE image sets in prostate MRI. The method is applicable to other 2D multi-slice acquisitions such as DWI as well as other regions of the body.Acknowledgements
DOD W81XWH-15-1-0341References
- Gold GE, Busse RF, Beehler C, Han E, Brau ACS, Beatty PJ, Beaulieu C. Isotropic MRI of the knee with 3D fast spin-echo extended echo-train acquistiion (XETA): initial experience. AJR 2007;188:1287-1293.
- Du YP, Parker DL, Davis WL, Cao G. Reduction of partial-volume artifacts with zero-filled interpolation in three-dimensional MR angiography. JMRI 1994;4:733-741.
- Greenspan H, Oz G, Kiryati N, Peled S. MRI inter-slice reconstruction using super-resolution. Magn Reson Img 2002;20:437-446.
Figures
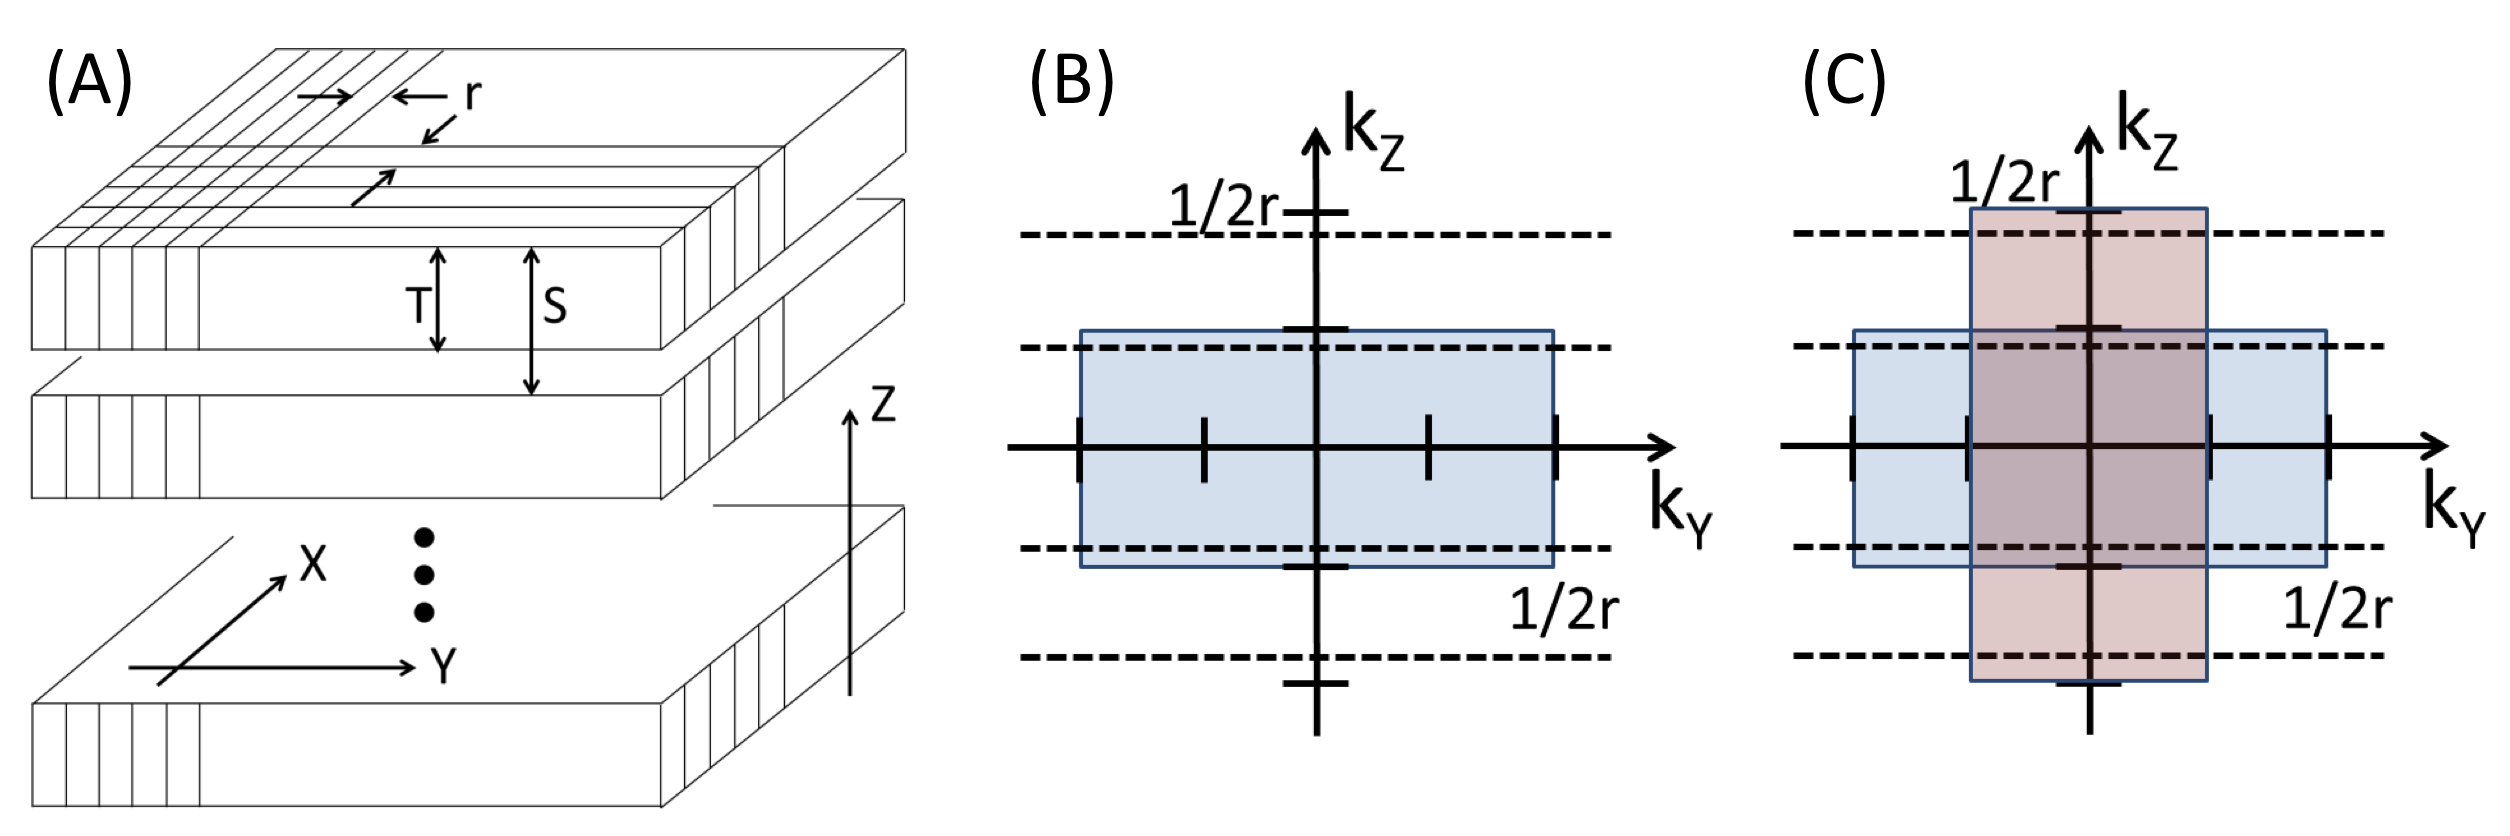
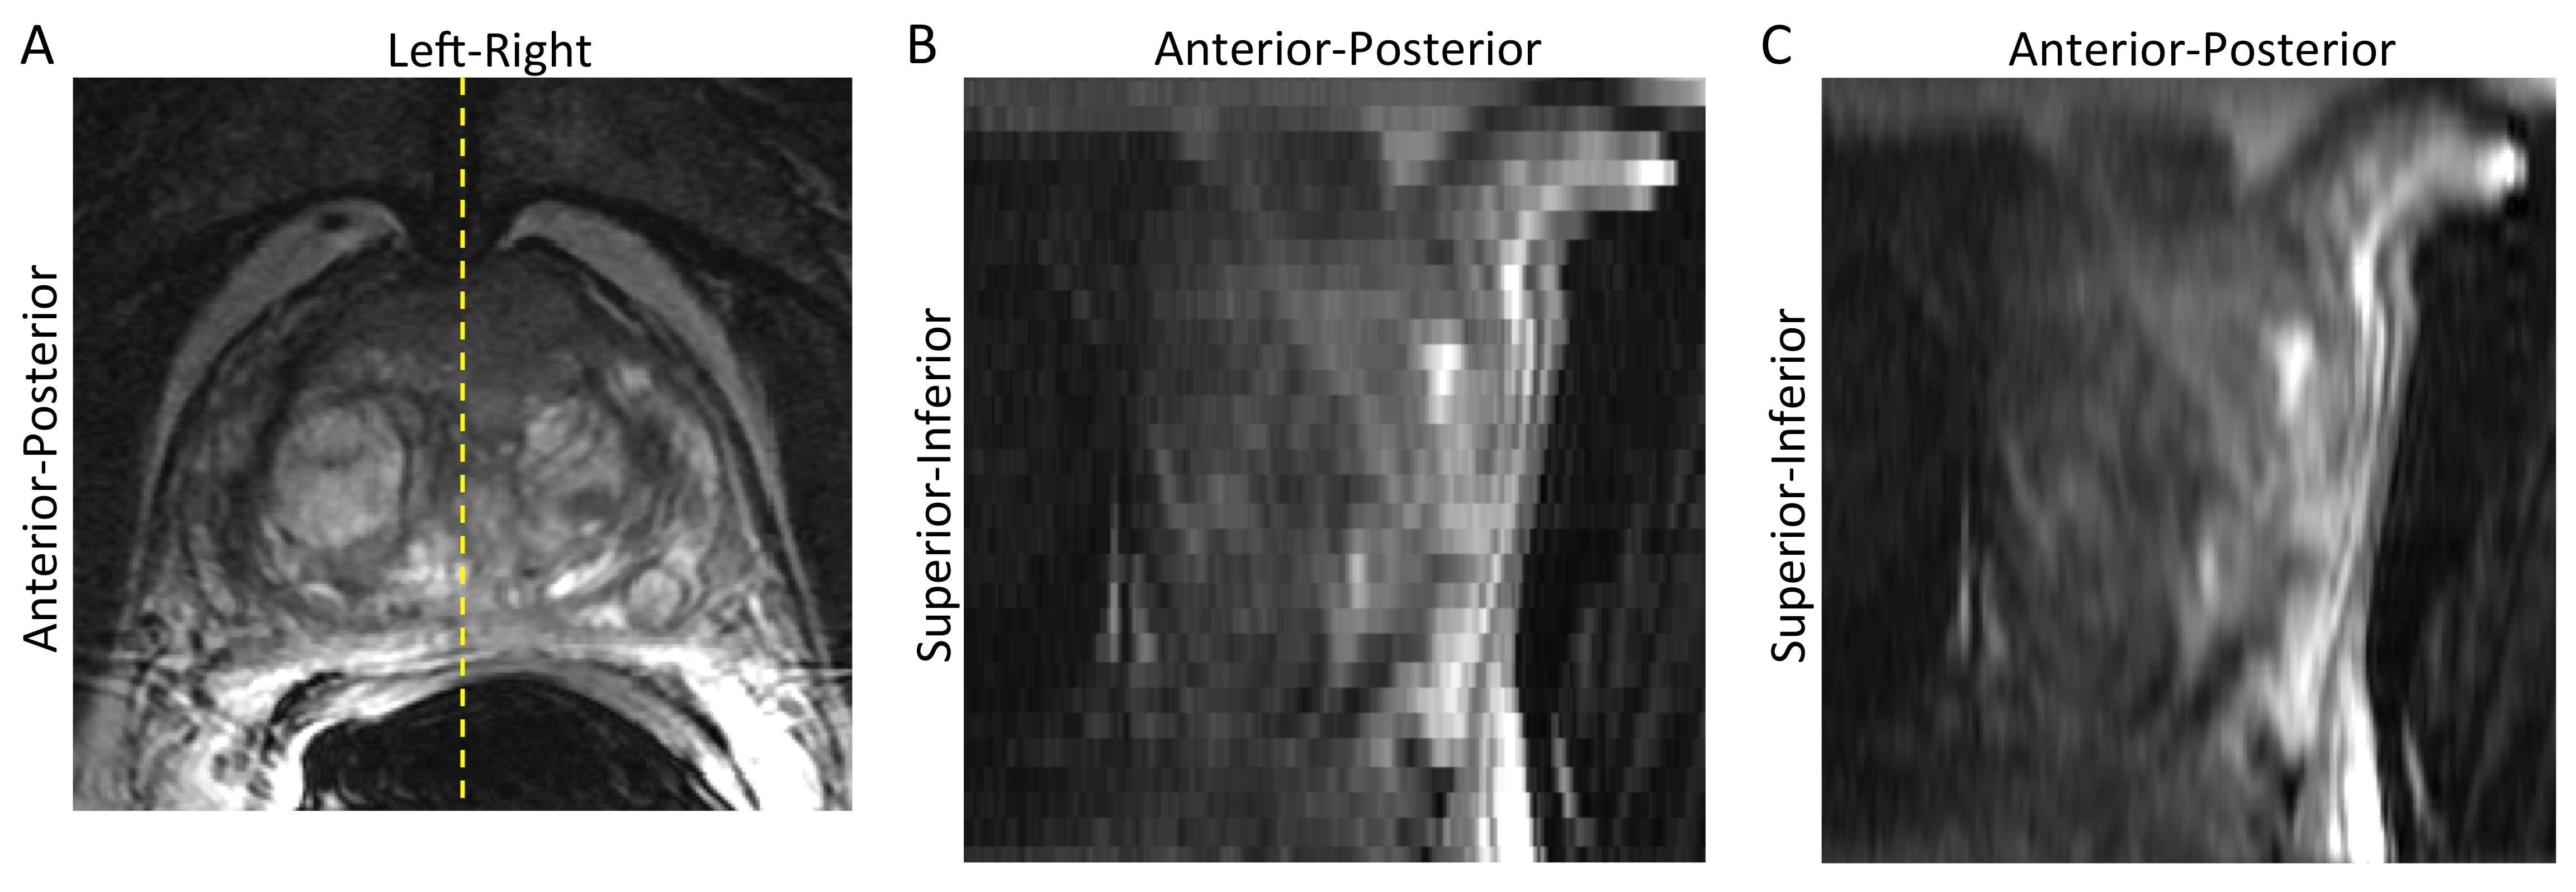
Figure 2. (A) Reference 2D multi-slice axial image of prostate. Line shows position of synthetic sagittal image. (B) Sagittal image formed from stacked acquired axial images. (C) Synthetic sagittal image resulting from described algorithm showing improved apparent up-down resolution.