4490
Intra- and Inter-scanner Variability Evaluation of RR-VFA B1+ and T1 in the Prostate at 3T1Department of Radiological Sciences, University of California, Los Angeles, Los Angeles, CA, United States, 2Physics and Biology in Medicine IDP, University of California, Los Angeles, Los Angeles, CA, United States
Synopsis
Accurate T1 estimation is critical for quantitative prostate DCE MRI. B1+ inhomogeneity can introduce significant error into the T1 quantification, especially for variable flip angle method. Reference region variable flip angle (RR-VFA) method is a promising B1+ and T1 estimation technique, which requires no separate scans for B1+ mapping and can reduce slice profile and position mismatch between B1+ and T1 maps. In this study, we investigated both intra-scanner repeatability and inter-scanner reproducibility regarding B1+ corrected T1 on two 3.0 T scanners to compare RR-VFA to a commercially available B1+ estimation technique. RR-VFA showed comparable
INTRODUCTION
Quantitative dynamic contrast-enhanced (DCE) MRI is a widely used tool for prostate cancer diagnosis1. The quantitative analysis of DCE-MRI typically requires accurate estimation of pre-contrast T1, where the variable flip angle (VFA) method is commonly used2. However, the VFA method is sensitive to B1+ inhomogeneity, which can introduce error into the prescribed flip angles and subsequent T1 quantification.3 The reference region VFA (RR-VFA) method is a promising B1+ and T1 estimation technique4,5, which has potential to improve clinical prostate quantitative DCE estimation because it does not require a separate scan for B1+ mapping and can reduce slice profile and position mismatch between B1+ and T1 maps. In this work, we compared the RR-VFA technique to a commercially available B1+ estimation techniques based on saturated turbo FLASH (satTFL)6 regarding intra- and inter-scanner variability of B1+ corrected T1 maps.METHODS
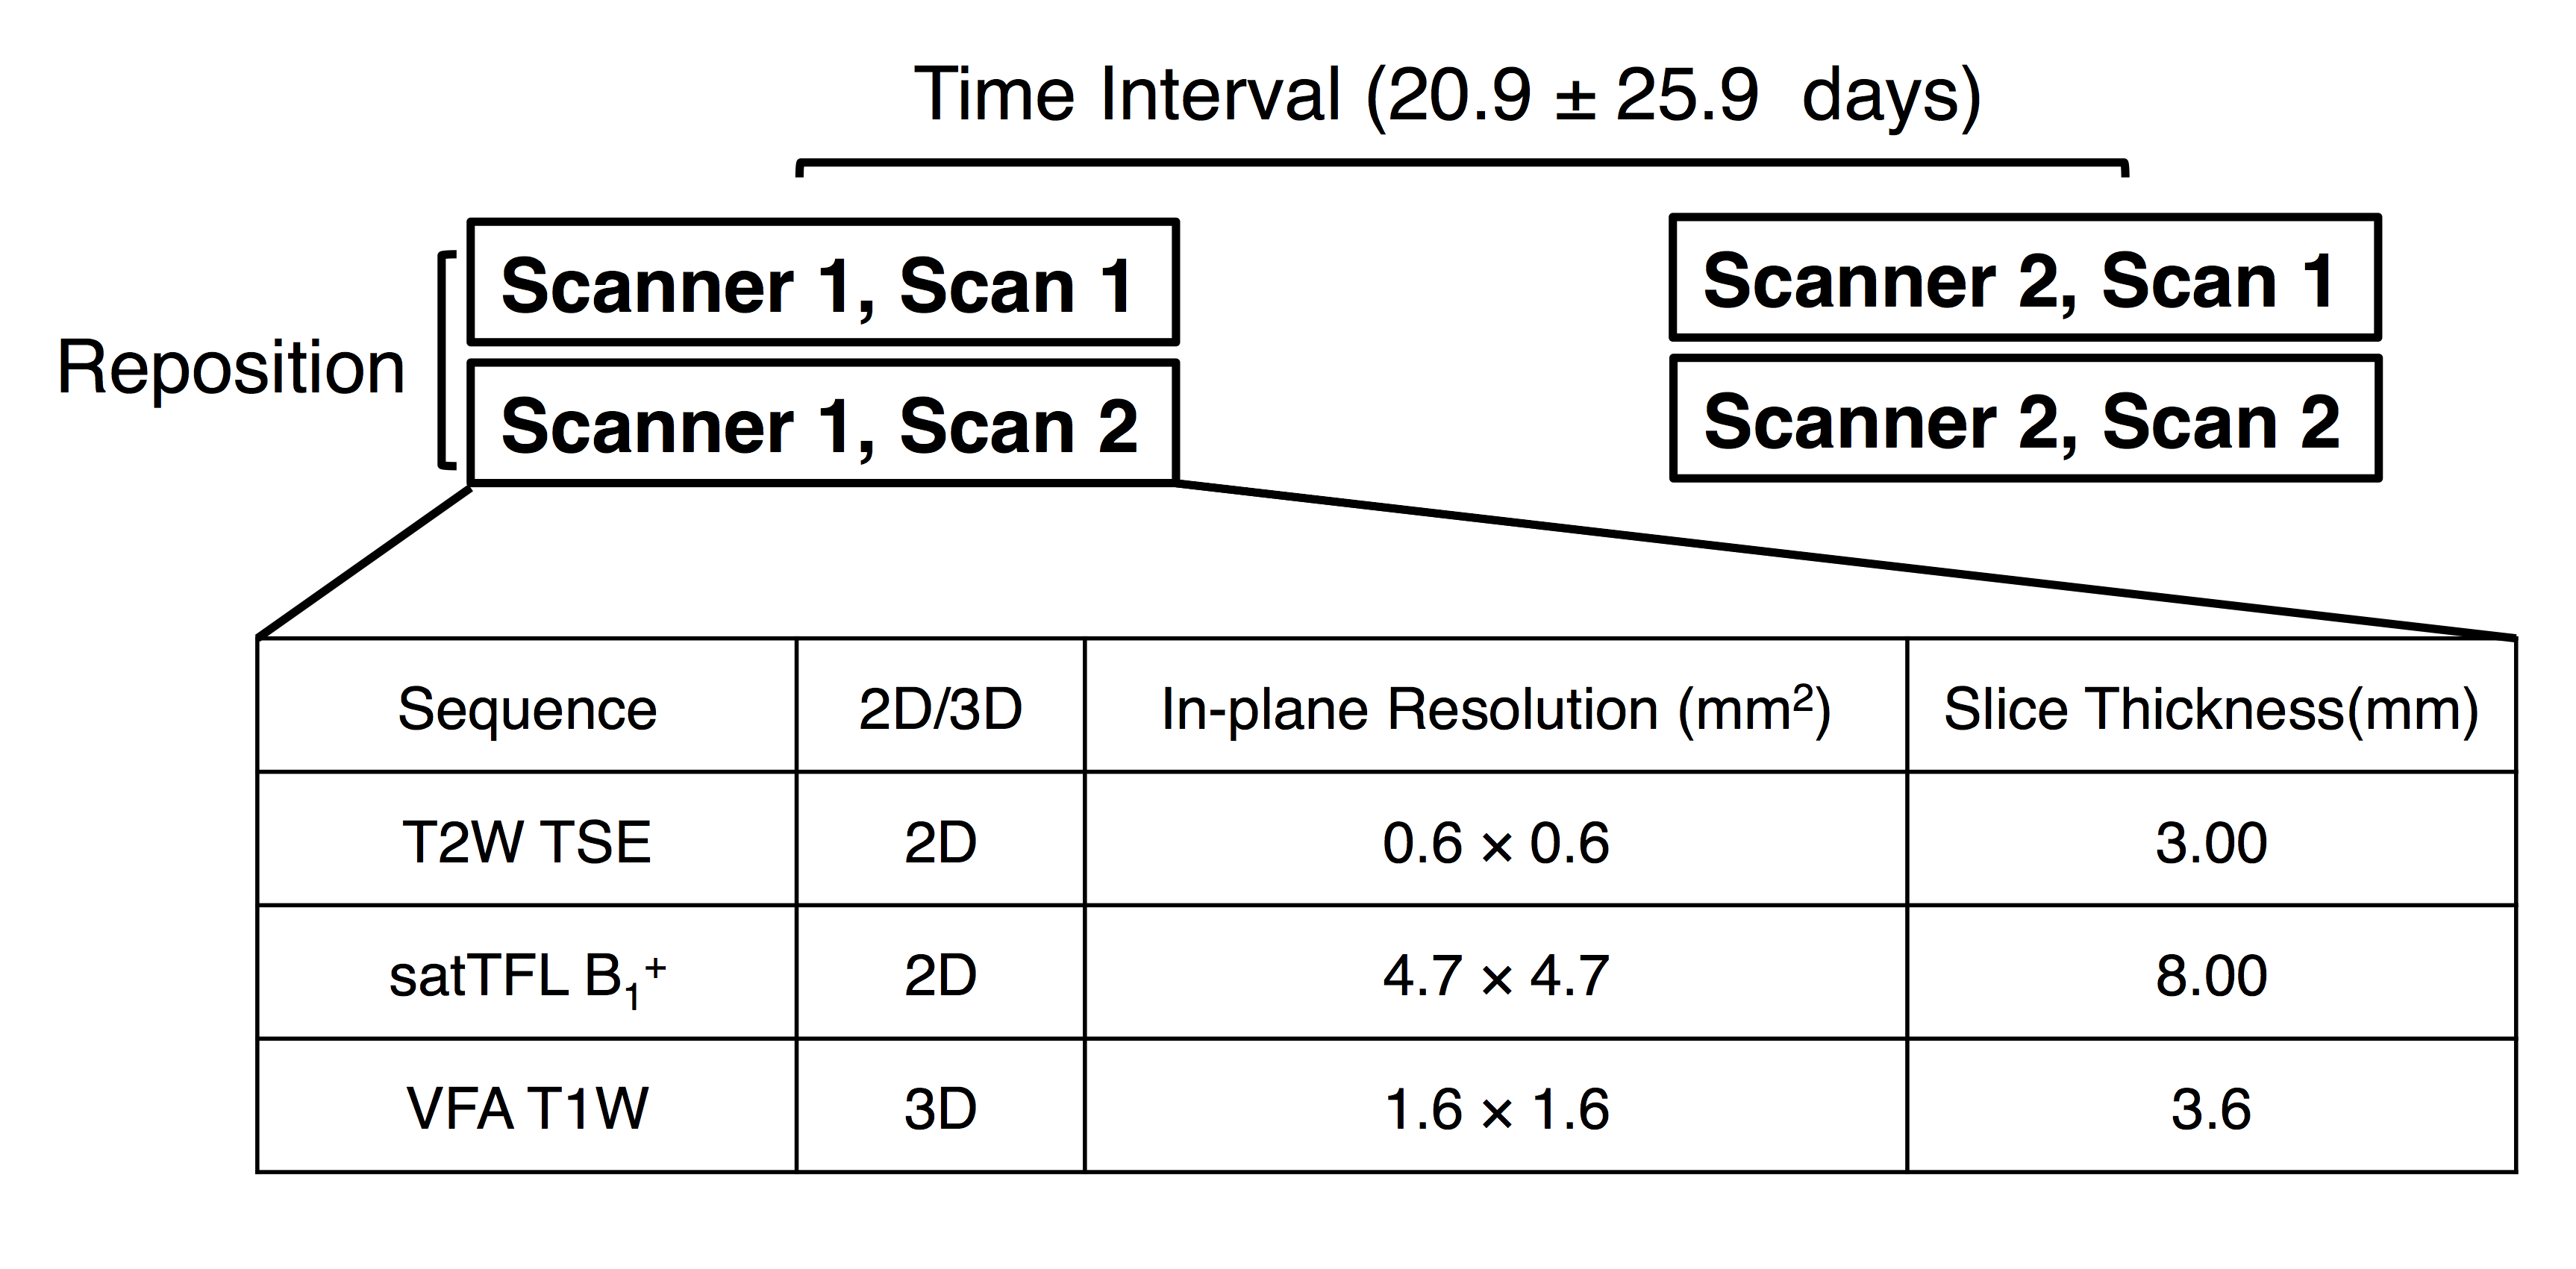
With IRB approval, ten healthy male subjects with mean age of 29.3±4.2 years old were prospectively recruited in this study with written informed consent. Each subject was scanned on two different 3.0T systems Prisma (‘Scanner 1”) and Skyra (“Scanner 2”) (Siemens Healthcare, Erlangen, Germany) respectively. On each scanner, each subject was scanned twice in the feet-first supine position, with repositioning between the two scans. The general workflow is shown in Fig. 1. The protocol included 2D T2 weighted Turbo Spin Echo (T2W TSE), 2D saturated turbo FLASH (satTFL) B1+ sequence and 3D VFA imaging with a dual echo bipolar readout (TEs=1.23/2.46 ms). The body coil was used for RF transmission and a receive-only phased array coil was used for signal reception. “TrueForm” B1+ shimming mode was active for both scanners.7
Relative flip angle maps (obtained flip angle/prescribed flip angle×100%) were generated using both RR-VFA and satTFL. Three T1 maps (T1 without B1+ correction, satTFL corrected T1 and RR-VFA corrected T1) were calculated for each scan. Regions of interests (ROI) were positioned on three representative slices (base, mid and apex) in the prostate, as well as the left and right obturator internus muscles, on each T2W TSE scan. We matched the slices manually between scans. For each scan, two B1+ maps and three T1 maps were estimated, and both B1+ and T1 maps were linearly interpolated to the same dimension as the 2D T2W TSE acquisition so that the ROI drawn on T2W TSE scans could be transferred to those maps directly. All post-processing was performed using in-house scripts written in Matlab (Mathworks, Natick, Mass).
B1+ estimations from two methods within each ROI were compared using linear regression and Pearson’s correlation. The Pearson’s correlation was also used to compare T1 between scans for intra- and inter-scanner variability evaluation. For intra-scanner variability, the average T1 between the two scans on the same scanner for the same volunteer were compared using paired t-test, Linear Regression and Bland Altman plot. Similarly, inter-scanner variability was assessed by determining the correlation and agreement of the average T1 between the scans of two different systems for the same volunteer.
RESULTS and DISCUSSION
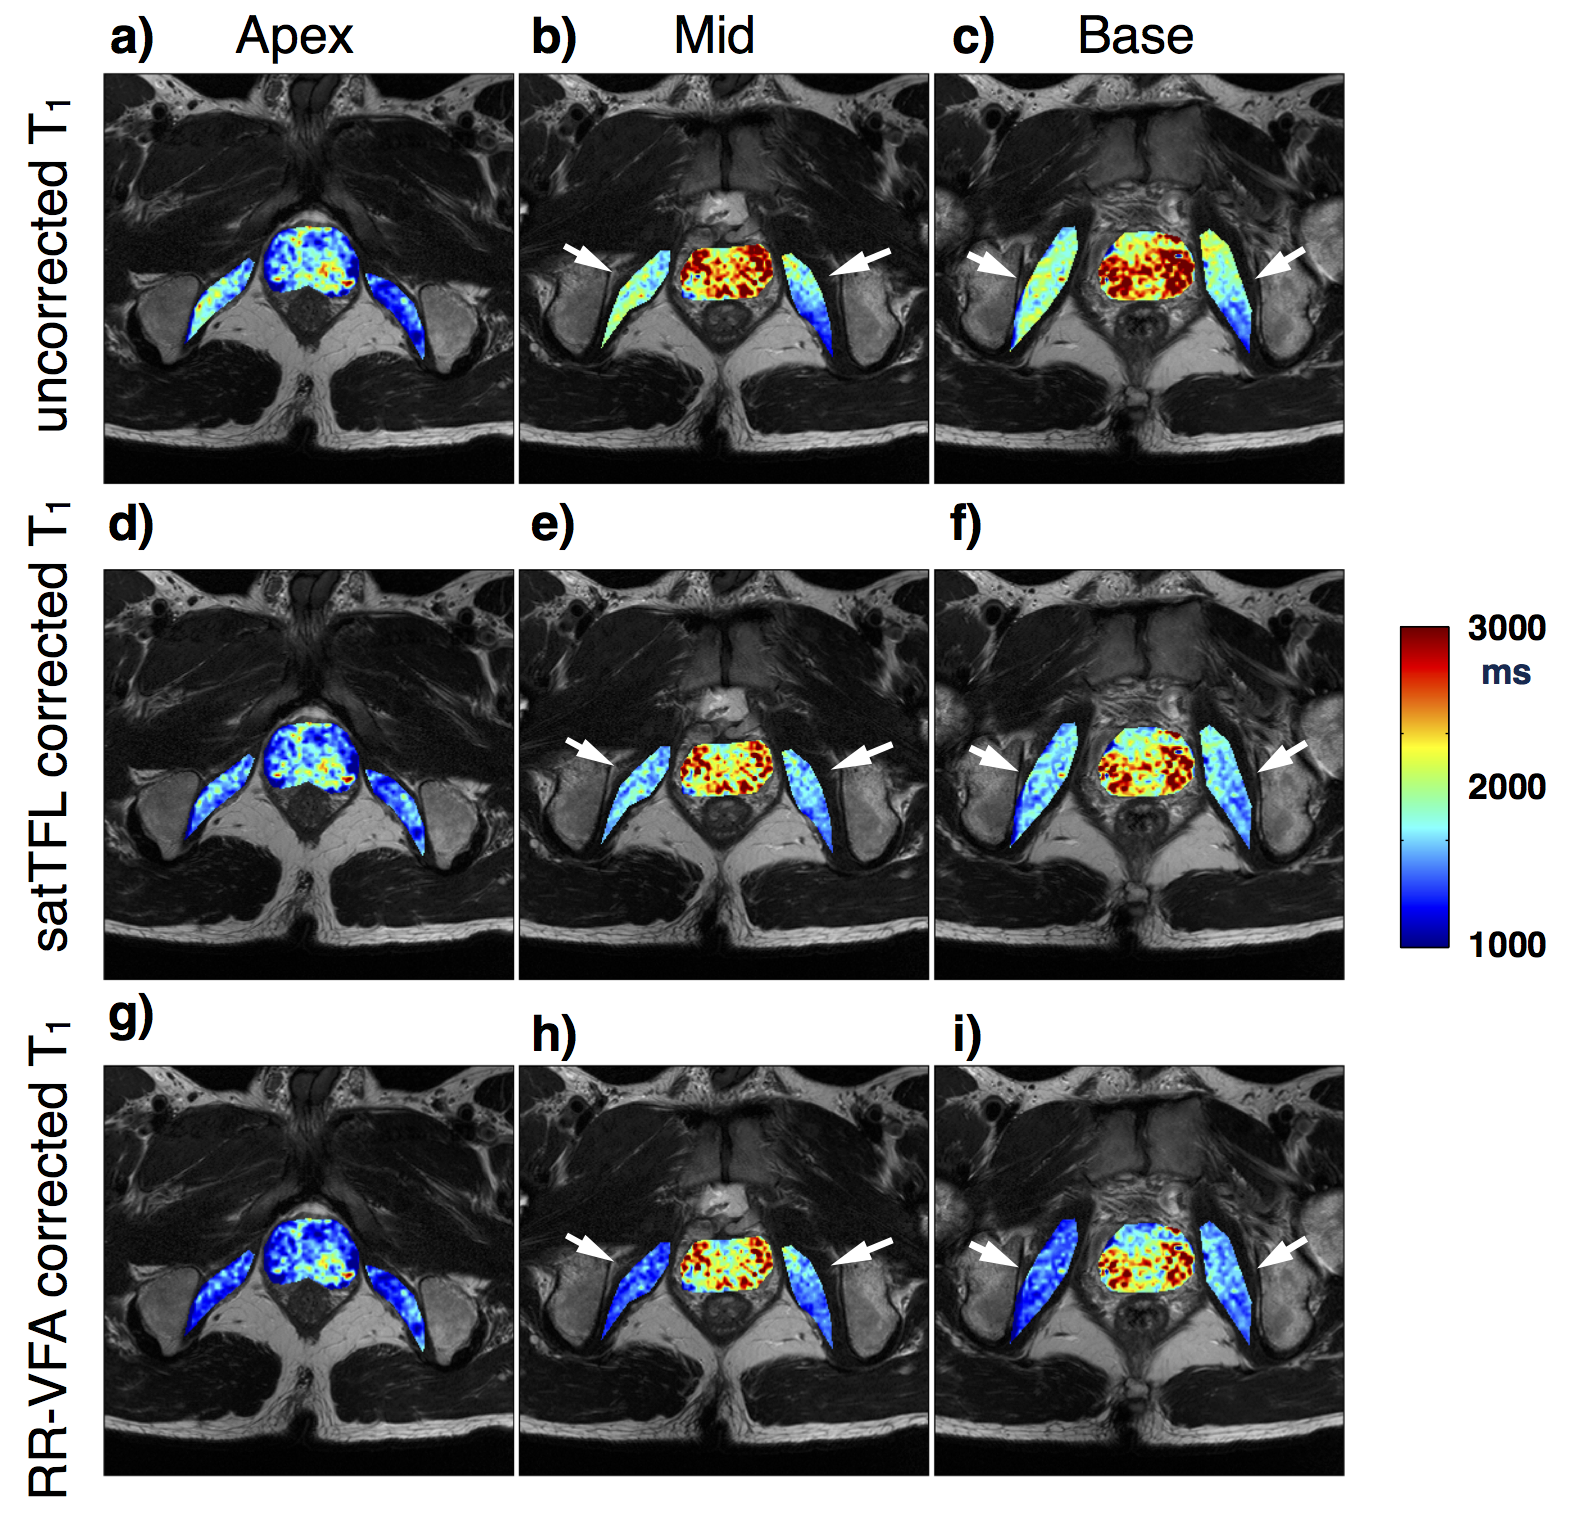
Representative ROI positioning for three T1 maps from the same scan is shown in Fig. 2. The uncorrected T1 shows inconsistent T1 values between left and right obturator internus muscles, and the inconsistency is reduced in both B1+ corrected T1 maps.
Linear regression between average B1+ from RR-VFA and satTFL gives a slope of 1.2 when comparing RR-VFA to satTFL B1+. The squared Pearson correlation coefficient (r2) between two B1+ estimation techniques is 0.859, showing good linear correlation.
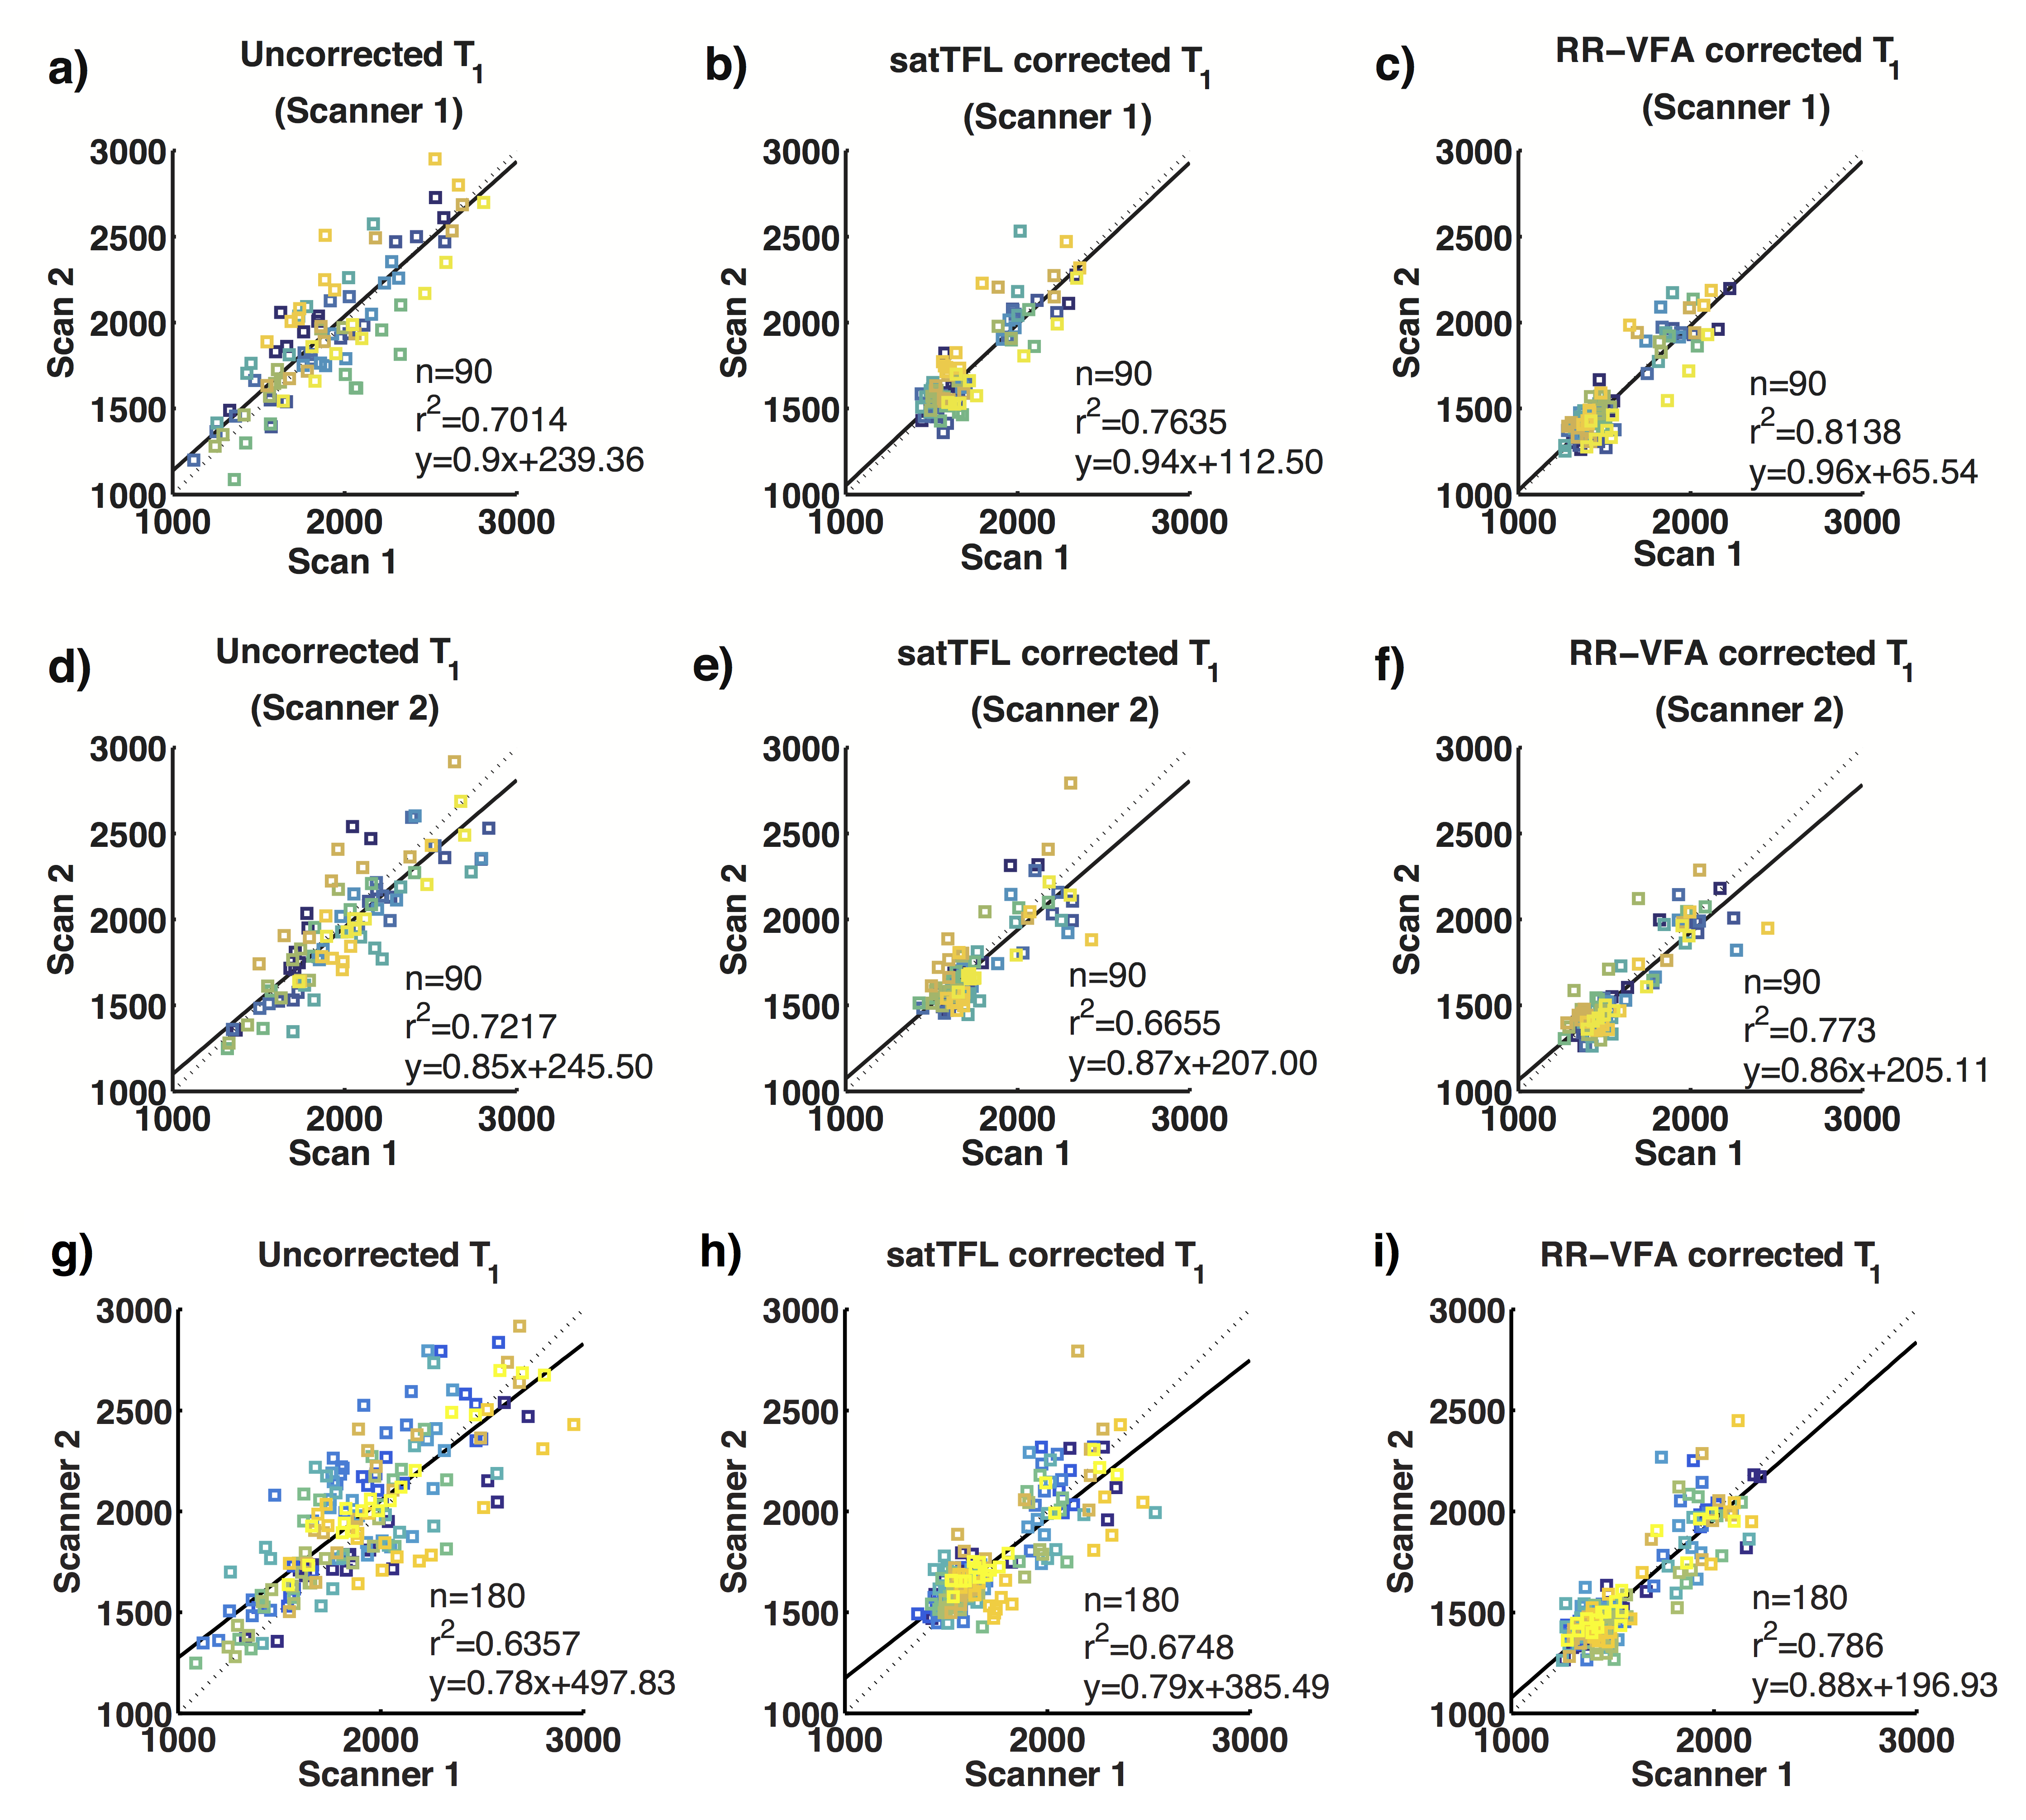
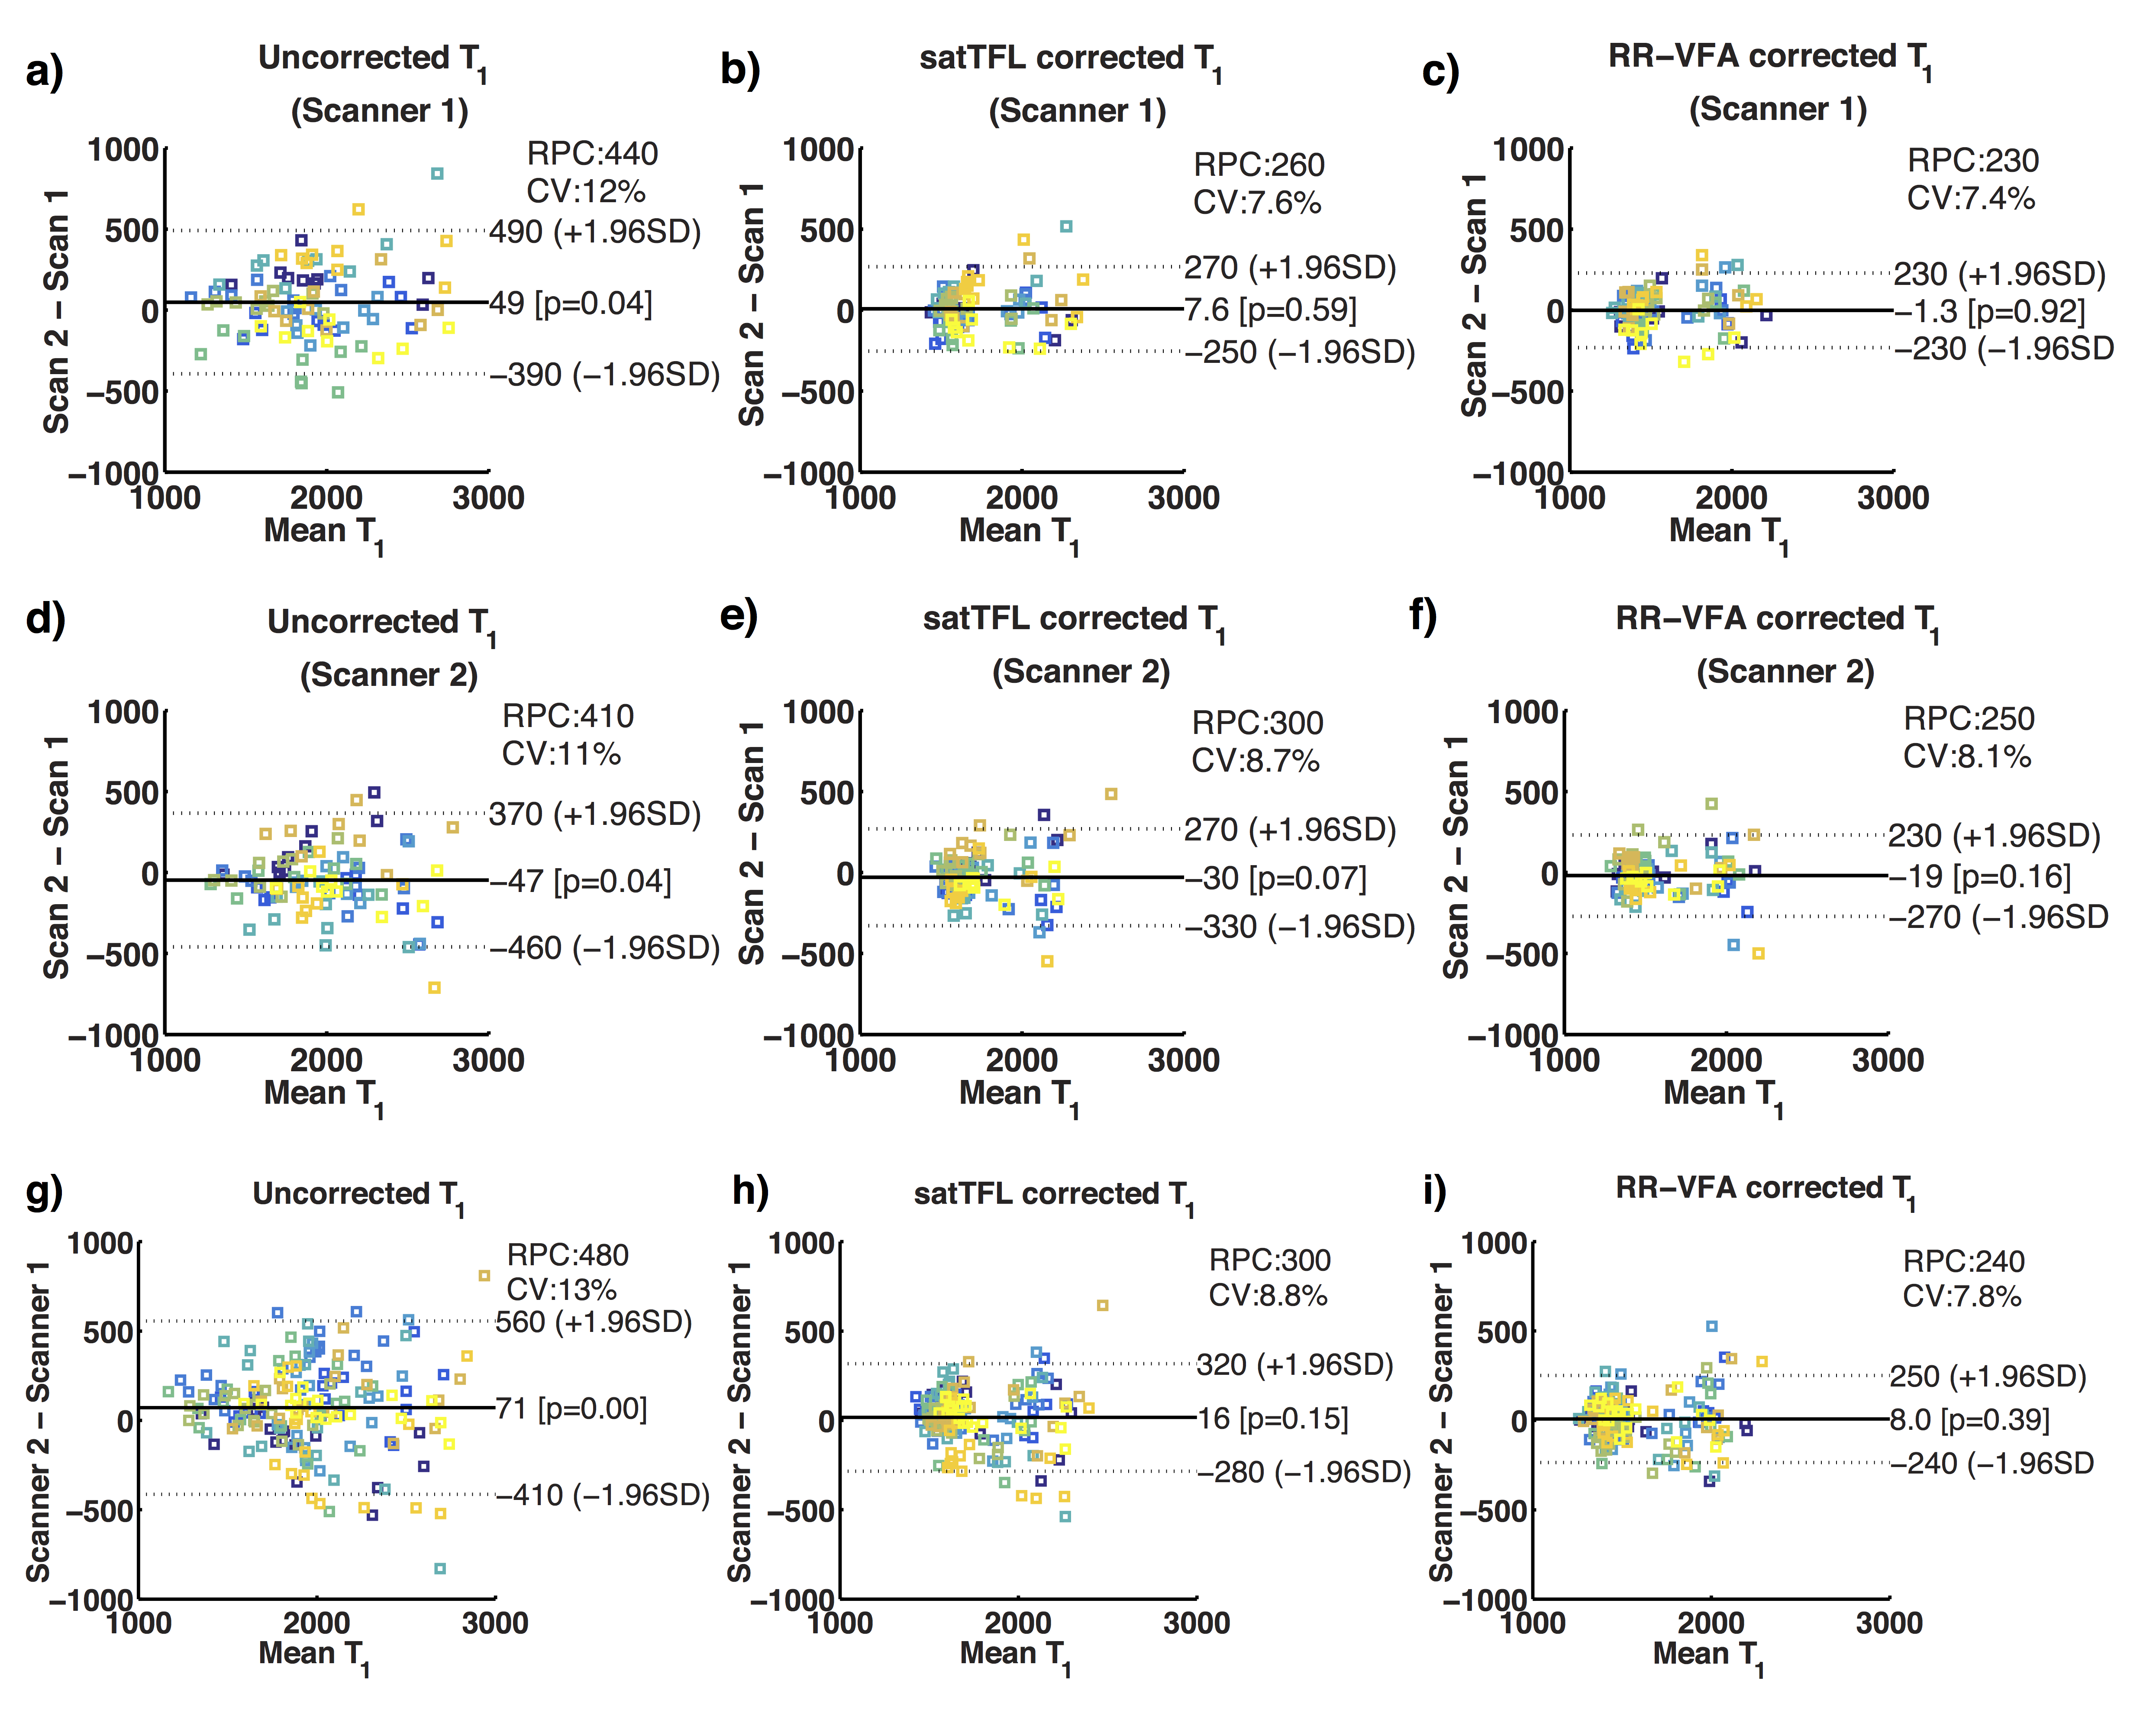
Evaluation of T1 using paired t-test is shown in Fig 3. T1 from different scans before B1+ correction is significantly different from each other, while not significantly different after B1+ correction using both B1+ estimation methods. Also, the intra- and inter-scanner comparison of linear regression is shown in Fig. 4. A higher squared Pearson Correlation (r2) is observed in RR-VFA corrected T1 compared to uncorrected T1 and satTFL corrected T1. The intra-and inter-scanner comparison of Bland-Altman plot is shown in Fig. 5. The 95% limits of agreement for RR-VFA corrected T1 is smaller than that of uncorrected T1 as well as satTFL corrected T1.
CONCLUSION
The intra- and inter-scanner variability of T1 estimation has been significantly reduced using both RR-VFA and satTFL. The RR-VFA corrected T1 had similar intra- and inter-scanner variability to the satTFL corrected T1, and RR-VFA provides B 1 + estimation highly correlated to satTFL (r2 = 0.859). Considering other advantages of RR-VFA such as no requirement for a separate scan, RR-VFA shows great potential in improving the prostate quantitative DCE-MRI.
Acknowledgements
No acknowledgement found.References
1. Alonzi R, Padhani AR, Allen C. Dynamic contrast enhanced MRI in prostate cancer. European Journal of Radiology. 2007;63(3):335–350. doi:10.1016/j.ejrad.2007.06.028 2
2. Gupta RK. A new look at the method of variable nutation angle for the measurement of spin-lattice relaxation times using fourier transform NMR. Journal of Magnetic Resonance. 1977;25(1):231–235. doi:10.1016/0022-2364(77)90138-X
3. Sung K, Daniel BL, Hargreaves BA. Transmit B1+ field inhomogeneity and T1 estimation errors in breast DCE-MRI at 3 tesla. Journal of magnetic resonance imaging : JMRI. 2013;38(2):454–9. doi:10.1002/jmri.23996
4. Sung K, Saranathan M, Daniel BL, Hargreaves BA. Simultaneous T 1 and B 1 + Mapping Using Reference Region Variable Flip Angle Imaging. Magnetic Resonance in Medicine. 2013;70(4):954–961. http://doi.wiley.com/10.1002/mrm.24904. doi:10.1002/mrm.24904
5. Rangwala NA, Dregely I, Wu HH, Sung K. Optimization and evaluation of reference region variable flip angle (RR-VFA) B1+ and T1 Mapping in the Prostate at 3T. Journal of Magnetic Resonance Imaging. 2017;45(3):751–760. doi:10.1002/jmri.25410
6. Chung S, Kim D, Breton E, Axel L. Rapid B1+ mapping using a preconditioning RF pulse with turboFLASH readout. Magnetic Resonance in Medicine. 2010;64(2):439–446. http://doi.wiley.com/10.1002/mrm.22423. doi:10.1002/mrm.22423
7. Blasche M, Riffel P, Matthias L. TimTX TrueShape and syngo ZOOMit technical and practical aspects. MAGNETOM Flash 2012:74–84. 39.
Figures