4487
Reduced FOV EPI with Blip-up Blip-down Field Correction for Prostate DWI1Mayo Clinic, Rochester, MN, United States
Synopsis
Geometric distortion in echo planar imaging spin echo images caused by a non-uniform B0 field remains an issue in clinical imaging. The purpose of this work is to combine the reduced-field-of-view echo planar pulse sequence with a blip-up blip-down correction in prostate DWI. We show reduced geometric distortion in prostate imaging and ADC maps with little or no additional acquisition time required over current protocols.
Purpose
Despite much work on pulse sequence design and correction methods, geometric distortion in echo planar imaging spin echo (EPI-SE) images caused by a non-uniform B0 field remains an issue in clinical imaging. A reduced-field-of-view (rFOV) pulse sequence has been shown to reduce distortions in prostate imaging relative to standard EPI-SE sequence1-3. However, since B0 induced distortion is inversely proportional to FOV, further improvement using this approach is limited. Another approach to reduce distortion is the use of the blip-up blip-down acquisition scheme5-7. The blip-up blip-down approach uses the resulting opposing distortions in the image pair to determine the underling B0 field and apply a correction. The purpose of this work is to combine the rFOV pulse sequence with a blip-up blip-down correction in prostate DWI.METHODS
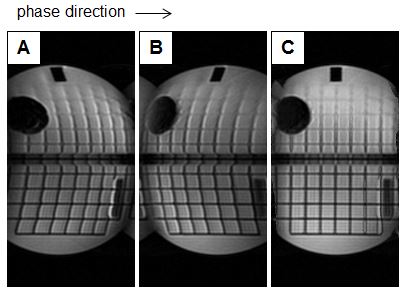
Studies were performed with Institutional Review Board approved protocols. An rFOV single shot EPI-SE based pulse sequence, FOCUS4, has been modified to acquire two reversed polarity phase encoded images on a 3.0T GE scanner. The blip-up blip-down acquisition provides a distortion pair of images shown in Figure 1. Sampling parameters for the rFOV sequence were; acquired resolution 144 x 72, TR = 3.5s, slices = 16, b=100, nex=4; b=1000, nex=14; b=1600, nex=16; scan time=5:39. The blip-up blip-down sequence acquired half of the signal average values to accommodate for the reversed encoding pairs and additionally acquired a b=0 reversed polarity pair used to determine the B0 correction field for a total scan time=5:46. The correction scheme employs the routines topup and applytopup7 which can be downloaded from the FSL web site8. The acquired B0 images for the blip-up blip-down acquisition were not used in the ADC calculation to be consistent with the rFOV analysis.RESULTS
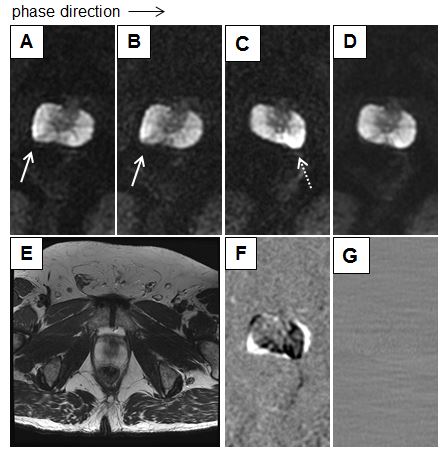
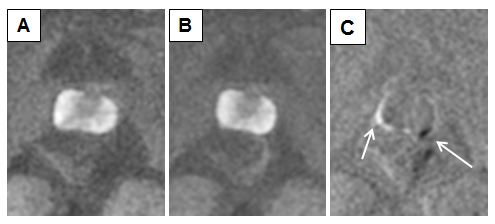
Geometric distortions arising from the use of the rFOV sequence are demonstrated in a phantom scan in Figure 1. Significant distortions are clearly seen and can be mostly corrected with the topup algorithm. A volunteer study of a healthy subject, Figure 2, displays similar distortion and signal pile up. By sampling both signal pile up and signal elongation the correction algorithm is able to resolve the underlying signal. The applytopup routine solves for the corrected image by combining the field distortion and all acquired signals for one complete line in the phase direction with a regularizing term. This line-by-line correction approach results in small residual striping values left over in the corrected difference image Figure 2G. The resulting ADC maps for both the sequences are displayed in Figure 3. As expected, the difference between the two methods is greatest where geometric distortion has been corrected.DISCUSSION
The combination of the rFOV pulse sequence with the use of the blip-up blip-down correction scheme can further correct distortion artefacts caused by susceptibility induced B0 field nonuniformities. The inherent ability of the blip-up blip-down correction approach to resolve the signal pile-up ambiguity makes it a good candidate to apply to an application that already uses multiple signal averages to increase the signal to noise ratio. Without increasing scan time, this allows additional information to be sampled so that the B0 field may be inferred. Future work will look at incorporating a sampled field map that may complement the current field estimate and help reduce any residual line-by-line striping artefacts.Acknowledgements
DoD grant W81XWH-15-1-0341References
1. Thierfelder KM, Scherr MK, Notohamiprodjo M, et al. Diffusion-weighted MRI of the prostate: advantages of Zoomed EPI with parallel-transmit-accelerated 2D-selective excitation imaging. Eur Radiol 2014;24:3233-3241.
2. Korn N, Kurhanewicz J, Banerjee S, Starobinets O, Saritas E, Noworolski S. Reduced-FOV excitation decreases susceptibility artifact in diffusion-weighted MRI with endorectal coil for prostate cancer detection. Magn Reson Imaging 2015;33:56-62.
3. Brendle C, Martirosian P, Schwenzer NF, et al. Diffusion-weighted imaging in the assessment of prostate cancer: Comparison of zoomed imaging and conventional technique. Eur J Radiol 2016;85:893-900.
4. Jeong EK, Kim SE, Guo J, et al. High-resolution DTI with 2D interleaved multislice reduced FOV single-shot diffusion-weighted EPI (2D ss-rFOVDWEPI). Magn Reson Med 2005;54:1575–79.
5. Chang H, Fitzpatrick JM. A technique for accurate magnetic resonance imaging in the presence of field inhomogeneities. IEEE Trans Med Imag 1992;11:319–329.
6. M. Okan Irfanoglu, Pooja Modi, Amritha Nayak, Elizabeth B. Hutchinson, Joelle Sarlls, and Carlo Pierpaoli. DR-BUDDI (Diffeomorphic Registration for Blip-Up blip-Down Diffusion Imaging) Method for Correcting Echo Planar Imaging Distortions. Neuroimage. 2015 Feb 1; 106: 284–299.
7. Andersson JL, Skare S, Ashburner J. How to correct susceptibility distortions in spin-echo echo-planar images: application to diffusion tensor imaging. Neuroimage 2003;20:870–888.
8. Topup download. https://fsl.fmrib.ox.ac.uk/fsl/fslwiki/FslInstallation.
Figures