4486
Restriction Spectrum Imaging-A Novel Diffusion-Based Technique for Detection and Characterization of Prostate CancerEly R Felker1, Leonard Marks2, Fuad Elkhoury2, David Lu1, Daniel Margolis3, Sepideh Shakeri1, Pooria Khoshnoodi4, Lorna Herbert2, Nathan White5, David Karow6, and Steven Raman1
1Radiology, UCLA, Los Angeles, CA, United States, 2Urology, UCLA, Los Angeles, CA, United States, 3Radiology, Cornell, New York, NY, United States, 4Pathology, University of Minnesota, Minneapolis, MN, United States, 5UCSD, San Diego, CA, United States, 6Human Longevity Institute, San Diego, CA, United States
Synopsis
We evaluated the utility of restriction spectrum imaging (RSI), a novel diffusion-based technique to detect and to characterize prostate cancer among men enrolled in a national cancer institute-funded prospective clinical trial of magnetic resonance ultrasound fusion biopsy. RSI was statistically significantly associated with clinically significant prostate cancer.
Introduction
Restriction spectrum imaging (RSI) is a novel advanced diffusion-based technique, which has been used to image prostate cancer (PCa) in a few small studies (1-3). Some of the purported advantages over conventional diffusion-weighted imaging (DWI) include: less spatial distortion, superior tumor contrast-to-noise, and the ability to obtain a normalized in vivo measure of tumor cellularity (4), however, this technique has not yet been widely validated. The purpose of this study was to investigate the utility of RSI for prediction of PCa aggressiveness in men undergoing magnetic resonance (MR)-ultrasound (US) fusion biopsy (FB).Methods
106 consecutive men enrolled in an institutional review board-approved National Cancer Institute-funded prospective clinical trial (PAIREDCaP) underwent pre-biopsy 3.0 T multiparametric (mp) MRI, which included multiplanar T2-weighted imaging (T2WI), conventional diffusion-weighted imaging (DWI), dynamic contrast enhancement (DCE) and RSI. RSI was performed using spin-echo echoplanar imaging with b values of 0, 250, 750, and 2000 s/mm2 with 6, 6 and 15 directions at each nonzero b value. RSI cellularity maps were derived using the signal fraction of the registered isotropic component of the diffusion spectrum and overlaid on axial T2WI, as has been described previously (5). Cellularity maps were constructed using data from all b values, which were standardized across all patients to obtain z score maps. RSI z score maps were calculated by measuring the mean and standard deviation of normal prostate signal from the raw RSI cellularity data (measured in the same zone, ipsilateral to the lesion in an area determined to be normal on MRI and on sextant biopsy) subtracting the measured mean value from each subject’s cellularity map, and dividing the result by the standard deviation of the measured normal prostate. The reference standard in all cases was MR-US FB, which included 12-core systematic biopsy and targeted biopsy (2-4 cores) through each lesion with a PI-RADSv2 assessment category > 3. Clinical and imaging features were compared among men with and without clinically significant (cs) PCa (Gleason > 3 + 4). Multivariate logistic regression was performed to determine significant predictors of csPCa.Results
57/106 men (54%) had csPCa on FB. Mean age was significantly higher in men with csPCa compared to those without (65.9 + 6.2 years versus 64.2 + 7.0 years, P = 0.001). Median PSA density was significantly higher among men with csPCa (0.18 ng/mL2 versus 0.10 ng/mL2, P < 0.0001). PI-RADSv2 assessment category was significantly higher among men with csPCa, P < 0.0001. Median apparent diffusion coefficient was significantly lower among men with csPCa (798 versus 978, P < 0.0001), and median RSI z score was significantly higher among men with csPCa (3.3 versus 1.4, P = 0.0002). On multivariate logistic regression, controlling for PI-RADSv2 assessment category, an RSI z score > 3 had an odds ratio of 2.31 for Gleason > 3 + 4, with a trend toward statistical significance, P = 0.06.Discussion
DWI has consistently been shown to be useful for PCa detection and characterization at mpMRI (6-8), but it is subject to significant distortion from B0 magnetic field inhomogeneities, such as occur in the presence of rectal gas or hemorrhage. Another limitation of DWI is that the ADC cannot be standardized across different imaging platforms. RSI z score, on the other hand, inherently normalizes across the population studied and thus could serve as a more useful imaging biomarker for comparison across different scanners and institutions. Our results show a statistically significant difference between RSI z scores among patients with and without csPCa. Additionally, on multivariate logistic regression there was a trend toward significance for prediction of csPCa, when controlling for PI-RADSv2 assessment category, with an odds ratio of 2.3 for an RSI z score >3.Conclusion
RSI z score is significantly associated with csPCa and may hold promise as a more reproducible metric of diffusion restriction compared to ADC. Future studies are needed to validate these preliminary findings.Acknowledgements
No acknowledgement found.References
1. Liss MA, White NS, Parsons JK, et al. MRI-derived restriction spectrum imaging cellularity index is associated with high grade prostate cancer on radical prostatectomy specimens. Front Oncol 2015;5(30:1-8 2. Yamin G, Schenker-Ahmed NM, Shabaik A, et al. Voxel level radiologic-pathologic validation of restriction spectrum imaging cellularity index with Gleason grade in prostate cancer. Clin Cancer Res 2016;22(11):2668-74 3. McCammack KC, Schenker-Ahmed NM, White NS, et al. Restriction spectrum imaging improves MRI-based prostate cancer detection. Abdom Radiol 2016;41(5):946-53 4. Brunsing RL, Schenker-Ahmed NM, White NS, et al. Restriction spectrum imaging: an evolving imaging biomarker in prostate MRI. J Magn Reson Imaging 2017;45(2):323-336 5. White N, McDonald C, Farid N, et al. Improved conspicuity and delineation of high-grade primary and metastatic brain tumors using “restriction spectrum imaging”: quantitative comparison with high B-value DWI and ADC. AJNR 2013;34:958-64 6. Tan CH, Wei W, Johnson V, Kundra V. Diffusion-weighted MRI in the detection of prostate cancer: meta-analysis. Am J Roentgenol 2012;199:822-829 7. Langer DL, van der Kwast TH, Evans AJ, et al. Prostate cancer detection with multiparametric MRI: logistic regression analysis of quantitative T2, diffusion-weighted imaging, and dynamic contrast-ehanced MRI. J Magn Reson Imaging 2009;30:347-334 8. Chamie K, Sonn GA, Finley DS, et al. The role of magnetic resonance imaging in delineating clinically significant prostate cancer. Urology 2014;83(2):369-75Figures
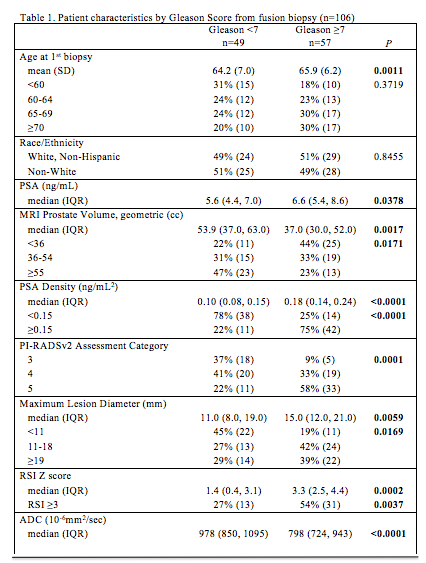
Table 1. Patient demographics, clinical and imaging features compared between men with csPCa (Gleason 3 +4 or more) and those without, using Fisher's exact and Kruskal Wallis tests.
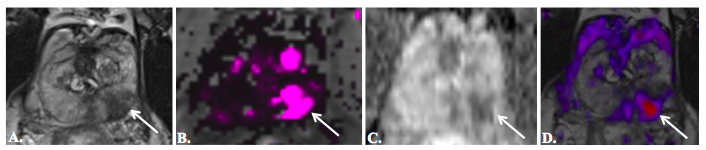
Fig. 2179 year-old man
with PSA of 9.3 ng/mL and no prior prostate biopsy. 3T mpMRI, including axial T2WI (a), dynamic
contrast-enhancement Ktrans map (b), ADC (c), and RSI map overlaid
on axial T2WI (d), demonstrates a PI-RADSv2 5/5 lesion (arrows) in the left
posterolateral peripheral zone midgland.
RSI z score was 4.36. MR-US fusion biopsy detected Gleason 4 + 5
PCa in multiple cores.