4484
Rapid hepatic glycogen synthesis in humans using dynamic 13C MR spectroscopy1Advanced Imaging Research Center, University of Texas Southwestern Medical Center, Dallas, TX, United States, 2Radiology, University of Texas Southwestern Medical Center, Dallas, TX, United States, 3Electrical and Computer Engineering, University of Texas at Dallas, Richardson, TX, United States, 4Molecular Genetics, University of Texas Southwestern Medical Center, Dallas, TX, United States, 5Clinical Biochemistry, Rigshospitalet, Copenhagen, Denmark, 6Internal Medicine, University of Texas Southwestern Medical Center, Dallas, TX, United States, 7Children’s Medical Center Research Institute, University of Texas Southwestern Medical Center, Dallas, TX, United States
Synopsis
The development of hyperpolarized 13C for human patients has refocused interest on radiofrequency (RF) coil design for optimal 13C sensitivity. 13C NMR spectra were acquired from the human liver using a clamshell transmit and 8-channel paddle receive array in a 3T MRI system. Following a baseline 13C liver scan for 15-min, [1-13C]glucose was ingested and 13C MRS data were acquired for 1-3hrs. [1-13C]glucose was observed immediately after ingestion in the stomach, and evolution of [1-13C]glycogen was monitored with < 1min temporal resolution. 13C chemical shift imaging data confirmed that the glycogen signals were localized in the liver.
Background
Due to its key role in human glucose homeostasis, hepatic glycogen plays an important role in a range of metabolic disorders, including obesity, diabetes, and nonalcoholic fatty liver disease1. The gold standard for studying hepatic glycogen metabolism in humans is 13C MRS following oral intake of [1-13C]glucose2. Previous 13C MRS human studies have relied on temporal resolutions of 30 mins or more, and studies of the kinetics of hepatic glycogen synthesis are difficult during the earliest postprandial period (0-30 minutes)3,4. Novel coil array designs and volume 13C transmit methods may improve signal. Therefore, we aimed at developing a high-sensitivity 13C MRS method to observe hepatic glycogen synthesis with a high temporal resolution during the earliest post-prandial phase in humans.Methods
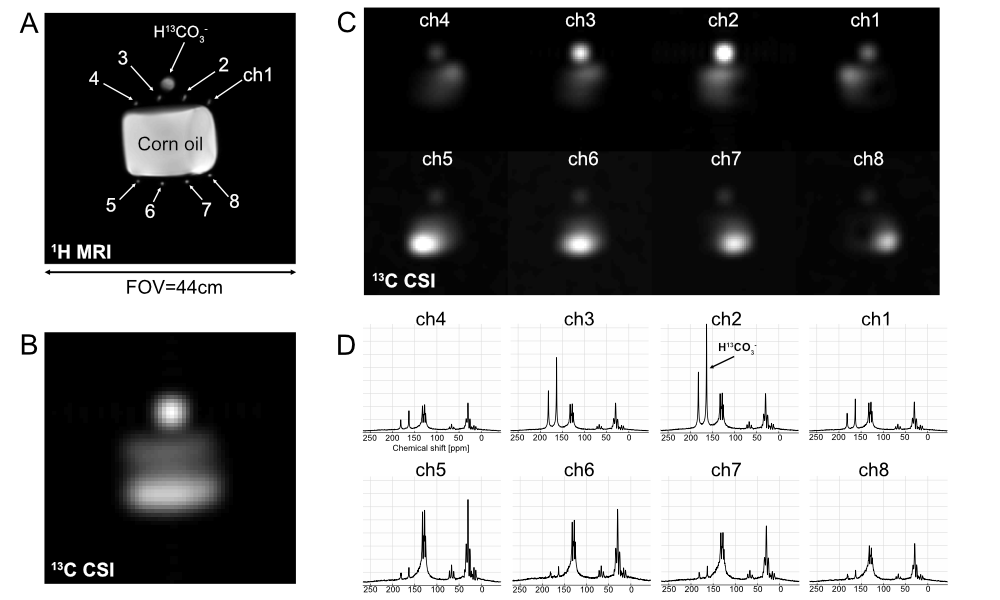
We used a system designed for imaging hyperpolarized 13C in human patients to monitor metabolism of thermally-polarized (not hyperpolarized) [1-13C]glucose. Studies on a corn-oil phantom were performed to determine the sensitivity profile of each coil element. Three healthy volunteers were recruited (37-51 years old, 2 males, 1 female). Glycogen synthesis was monitored using 13C MRS following overnight fasting and an oral glucose load5. Briefly, for structural references 2D FIESTA images over the liver were acquired (16 slices, breath-hold) from each subject using a GE GEM body flex coil at a 3T wide-bore MR scanner (GE Healthcare, 750W Discovery). Then a baseline 13C MRS liver scan was performed followed by oral administration of [1-13C]glucose solution (98g glucose, containing 20% [1-13C]glucose). 13C MRS scans started concurrent with the glucose ingestion and were repeated in 15-min blocks for up to 3hrs. For 13C MRS (TR=0.5s, FA=60o, #scan=1800, acquisition time=15min) and chemical shift imaging (FOV=32cm, matrix=8x8, TR=0.5s, 8 averages, slice-selective, FA=60o, acquisition time=4min 16s), a clamshell 13C transmit coil and 8-channel 13C receive array paddle coils (GE Healthcare) were used for both RF excitation and signal acquisition, respectively. Blood samples, drawn every 15min, were analyzed for plasma levels of [1-13C]glucose and [1-13C]lactate using gas chromatography mass spectrometry (GC-MS).Results and Discussion
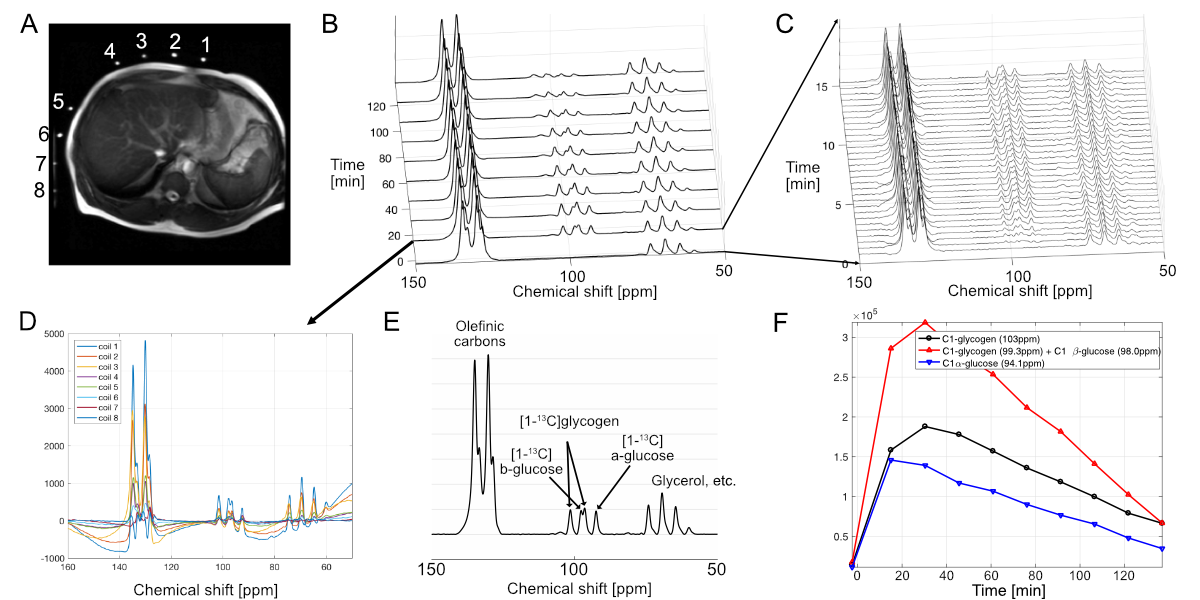
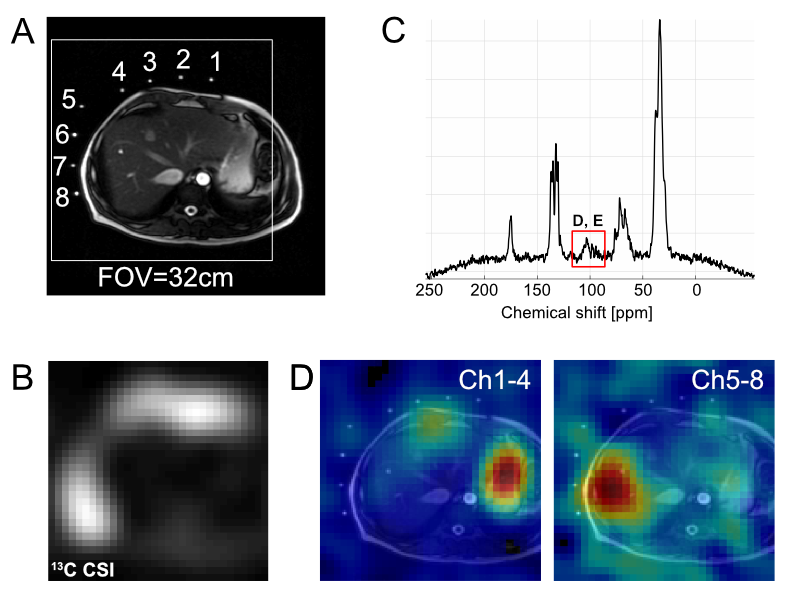
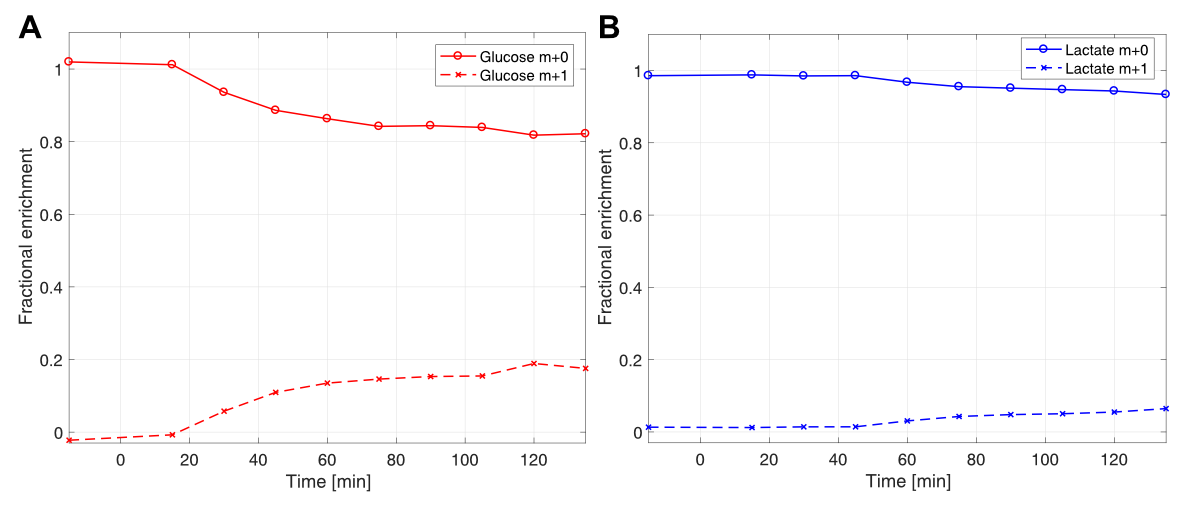
The 13C paddle coils were sensitive enough to detect 13C signals located ~20-cm away from each coil element (Fig. 1). While not detected at baseline 13C MRS, [1-13C]-labeled α, β-glucose (94.1, 98.0 ppm) and glycogen (99.3, 103 ppm) peaks accumulated rapidly, beginning as early as ~2 mins after oral administration of [1-13C]glucose (Fig. 2). [1-13C]glucose signal peaked at 15 mins, whereas [1-13C]glycogen peaked at 30 mins after [1-13C]glucose ingestion, and both signals declined towards baseline levels over the next 3hrs. Separate 13C chemical shift imaging data confirmed the spatial localization of [1-13C]glycogen peaks in the liver (Fig. 3), while [1-13C]glucose signals were primarily localized in the stomach. The signal-to-noise ratio of [1-13C]glucose and [1-13C]glycogen varied depending on the subject, probably due to the different positioning of the paddle coils relative to the liver, but the glycogen peaks could be resolved even when reconstructed from 30s-long segments (60 averages). After ingestion of [1-13C]glucose, plasma levels of [1-13C]glucose and [1-13C]lactate rose gradually: at 2hrs ~20% of all plasma glucose was [1-13C]-labeled and ~5% of plasma lactate was [1-13C]-labeled (Fig. 4). The distinctive difference in glucose kinetics between 13C MRS and plasma GC-MS suggests a prompt and effective hepatic uptake of [1-13C]glucose from the portal circulation during the early postprandial period.Conclusion
We observed rapid accumulation of hepatic [1-13C]glycogen following orally administered [1-13C]glucose, using a sensitive, high-resolution time-resolved 13C MRS method. Current commercial technology allows high temporal resolution studies of glycogen metabolism in the human liver. This method may be useful for future studies of hepatic glycogen metabolism in humans.Acknowledgements
Funding support: National Institutes of Health of the United States (P41EB015908; S10OD018468; 5UL1TR001105); The Mobility Foundation; The Texas Institute of Brain Injury and Repair; Sapere Aude grant from the Danish Council for Independent Research; Howard Hughes Medical Institute. The authors also acknowledge Teresa Eversole and Salvador Pena for logistical support.
References
1. Petersen MC, Vatner DF and Shulman GI. Regulation of hepatic glucose metabolism in health and disease. Nat Rev Endocrinol. 2017;13:572-587.
2. Alger JR, Sillerud LO, Behar KL, Gillies RJ, Shulman RG, Gordon RE, Shae D and Hanley PE. In vivo carbon-13 nuclear magnetic resonance studies of mammals. Science. 1981;214:660-2.
3. Taylor R, Magnusson I, Rothman DL, Cline GW, Caumo A, Cobelli C and Shulman GI. Direct assessment of liver glycogen storage by 13C nuclear magnetic resonance spectroscopy and regulation of glucose homeostasis after a mixed meal in normal subjects. J Clin Invest. 1996;97:126-32.
4. Moore MC, Coate KC, Winnick JJ, An Z and Cherrington AD. Regulation of hepatic glucose uptake and storage in vivo. Adv Nutr. 2012;3:286-94.
5. Petersen KF, Cline GW, Gerard DP, Magnusson I, Rothman DL and Shulman GI. Contribution of net hepatic glycogen synthesis to disposal of an oral glucose load in humans. Metabolism. 2001;50:598-601.
Figures