4483
Dynamic Hyperpolarized 13C CS-EPSI of Human Prostate Cancer – Initial Experience on 17 Patients Testing Acquisition & Quantitative Analysis Methods1Radiology and Biomedical Imaging, University of California, San Francisco, San Francisco, CA, United States, 2Department of Clinical Pharmacy, University of California, San Francisco, San Francisco, CA, United States, 3School of Medicine, University of California, San Francisco, San Francisco, CA, United States
Synopsis
New hyperpolarized-13C MRI instrumentation and methods enabled phase II clinical studies on 17 prostate cancer patients using 3D dynamic CS-EPSI with 0.5cm3 spatial and 2s time resolution. New manufacturing processes for 13C-pyruvate provided more consistent polarization levels, pyruvate concentrations, radical filtrations for reliable and safe patient injections. Improved quantitative methods were designed and implemented for reproducible kinetic modeling, correction for receiver profile, and peak detection, accounting for B0 inhomogeneity and noise characteristics. These studies have shown the ability to detect high pyruvate-to-lactate conversion rates in biopsy confirmed prostate cancer.
Introduction
Recent advancements in MR instrumentation, sterile 13C-pyruvate manufacturing process, and acquisition strategies has enabled phase II hyperpolarized-13C patient prostate cancer studies with excellent reliability and reproducibility1,2. Advanced pulse sequence designs, such as 3D CS-EPSI1 and EPI2 has been shown to capture HP-13C dynamics of pyruvate-to-lactate conversion throughout the entire human prostate with high spatiotemporal resolution. With all the new techniques in place, it is timely to review the methodology and how the essential diagnostic information can be extracted from the large HP-13C datasets. This report summarizes our initial experience from the first 17 prostate cancer patients on whom high quality 3D dynamic data were acquired. We also investigated a specialized processing scheme with improved accuracy to quantitatively interpret the spectroscopic imaging data for evaluation of prostate cancer metabolism.Methods
Patient Studies: Seventeen prostate cancer patients were studied in this phase II HP-13C MRI research to this date, whose pathological grades range from low-grade Gleason 3+3 to the aggressive 4+5. GMP-grade pyruvic acid was polarized in a 5T SPINlab polarizer for 2.5-3 hours, yielding 242±13mM solution with 37.8±6.1% polarization, 0.9±0.3uM radical and 31.7±0.9°C temperature. The new manufacturing process of sterile 13C-pyruvate greatly improved reliability and efficiency, and significantly reduced cost. A 3D compressed-sensing CS-EPSI sequence provided 0.5cm3 volumetric and 2s temporal resolution with low-power, B1-insensitive RF pulses1,3,4.
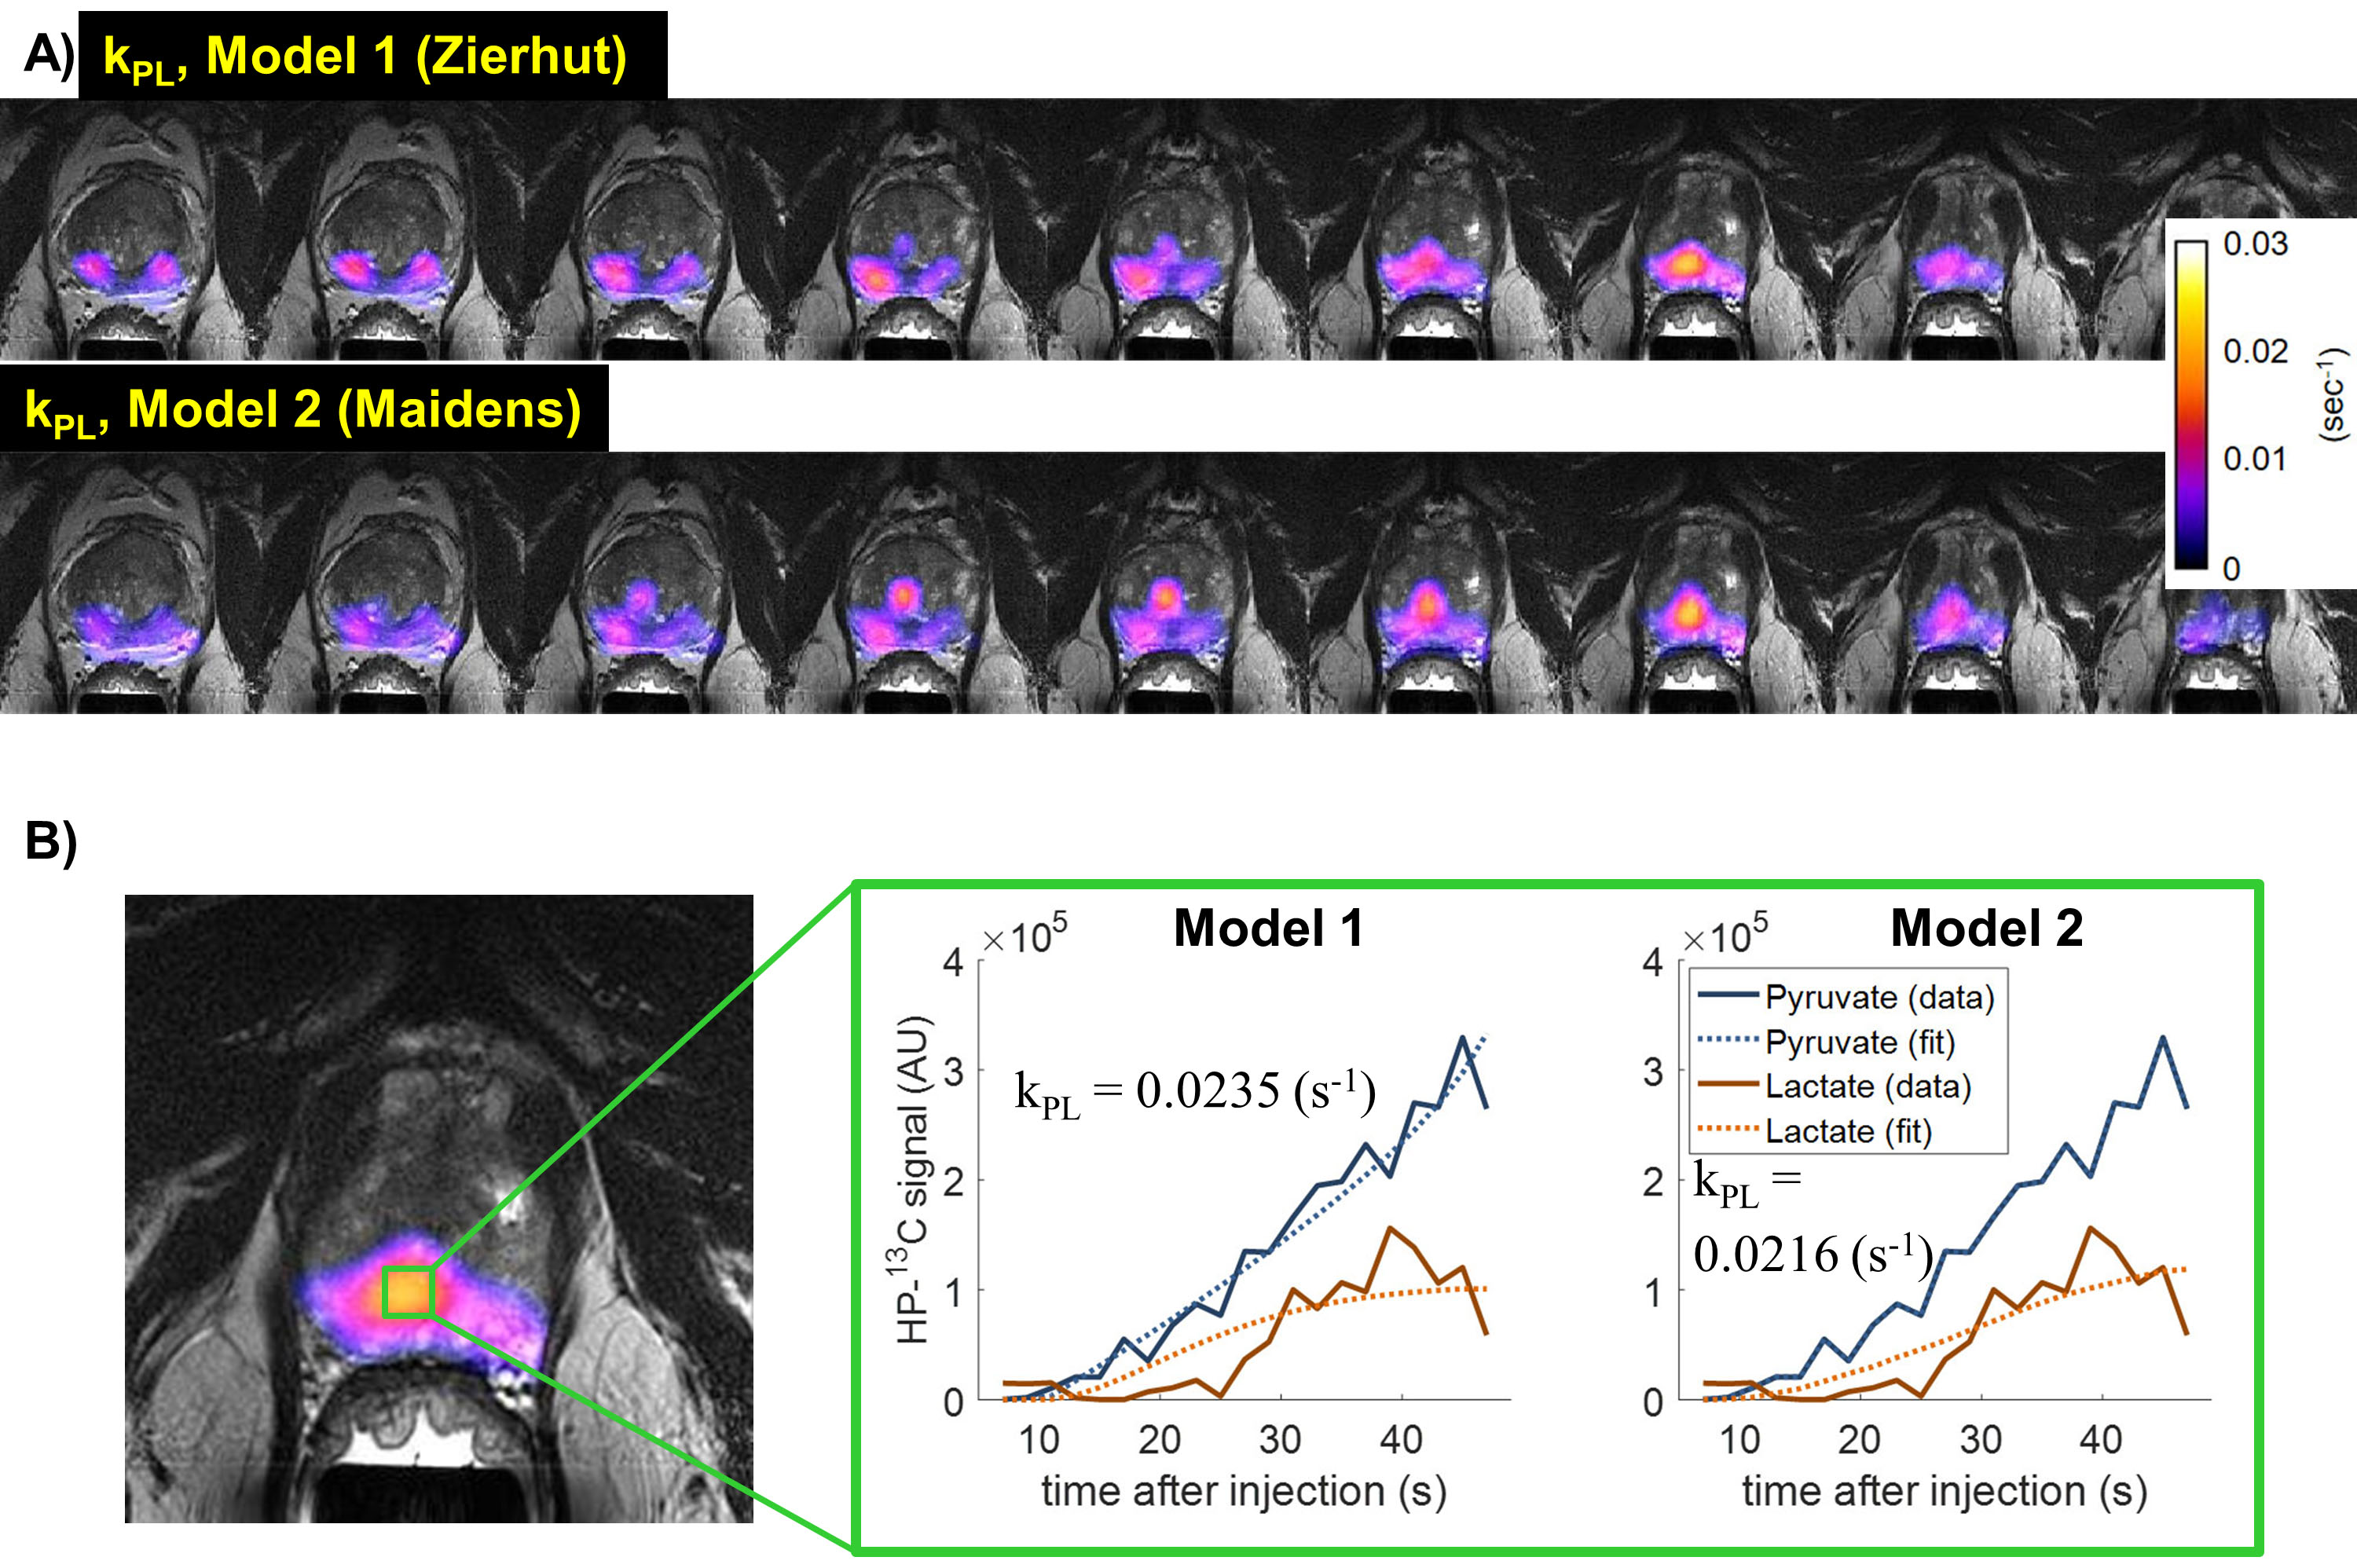
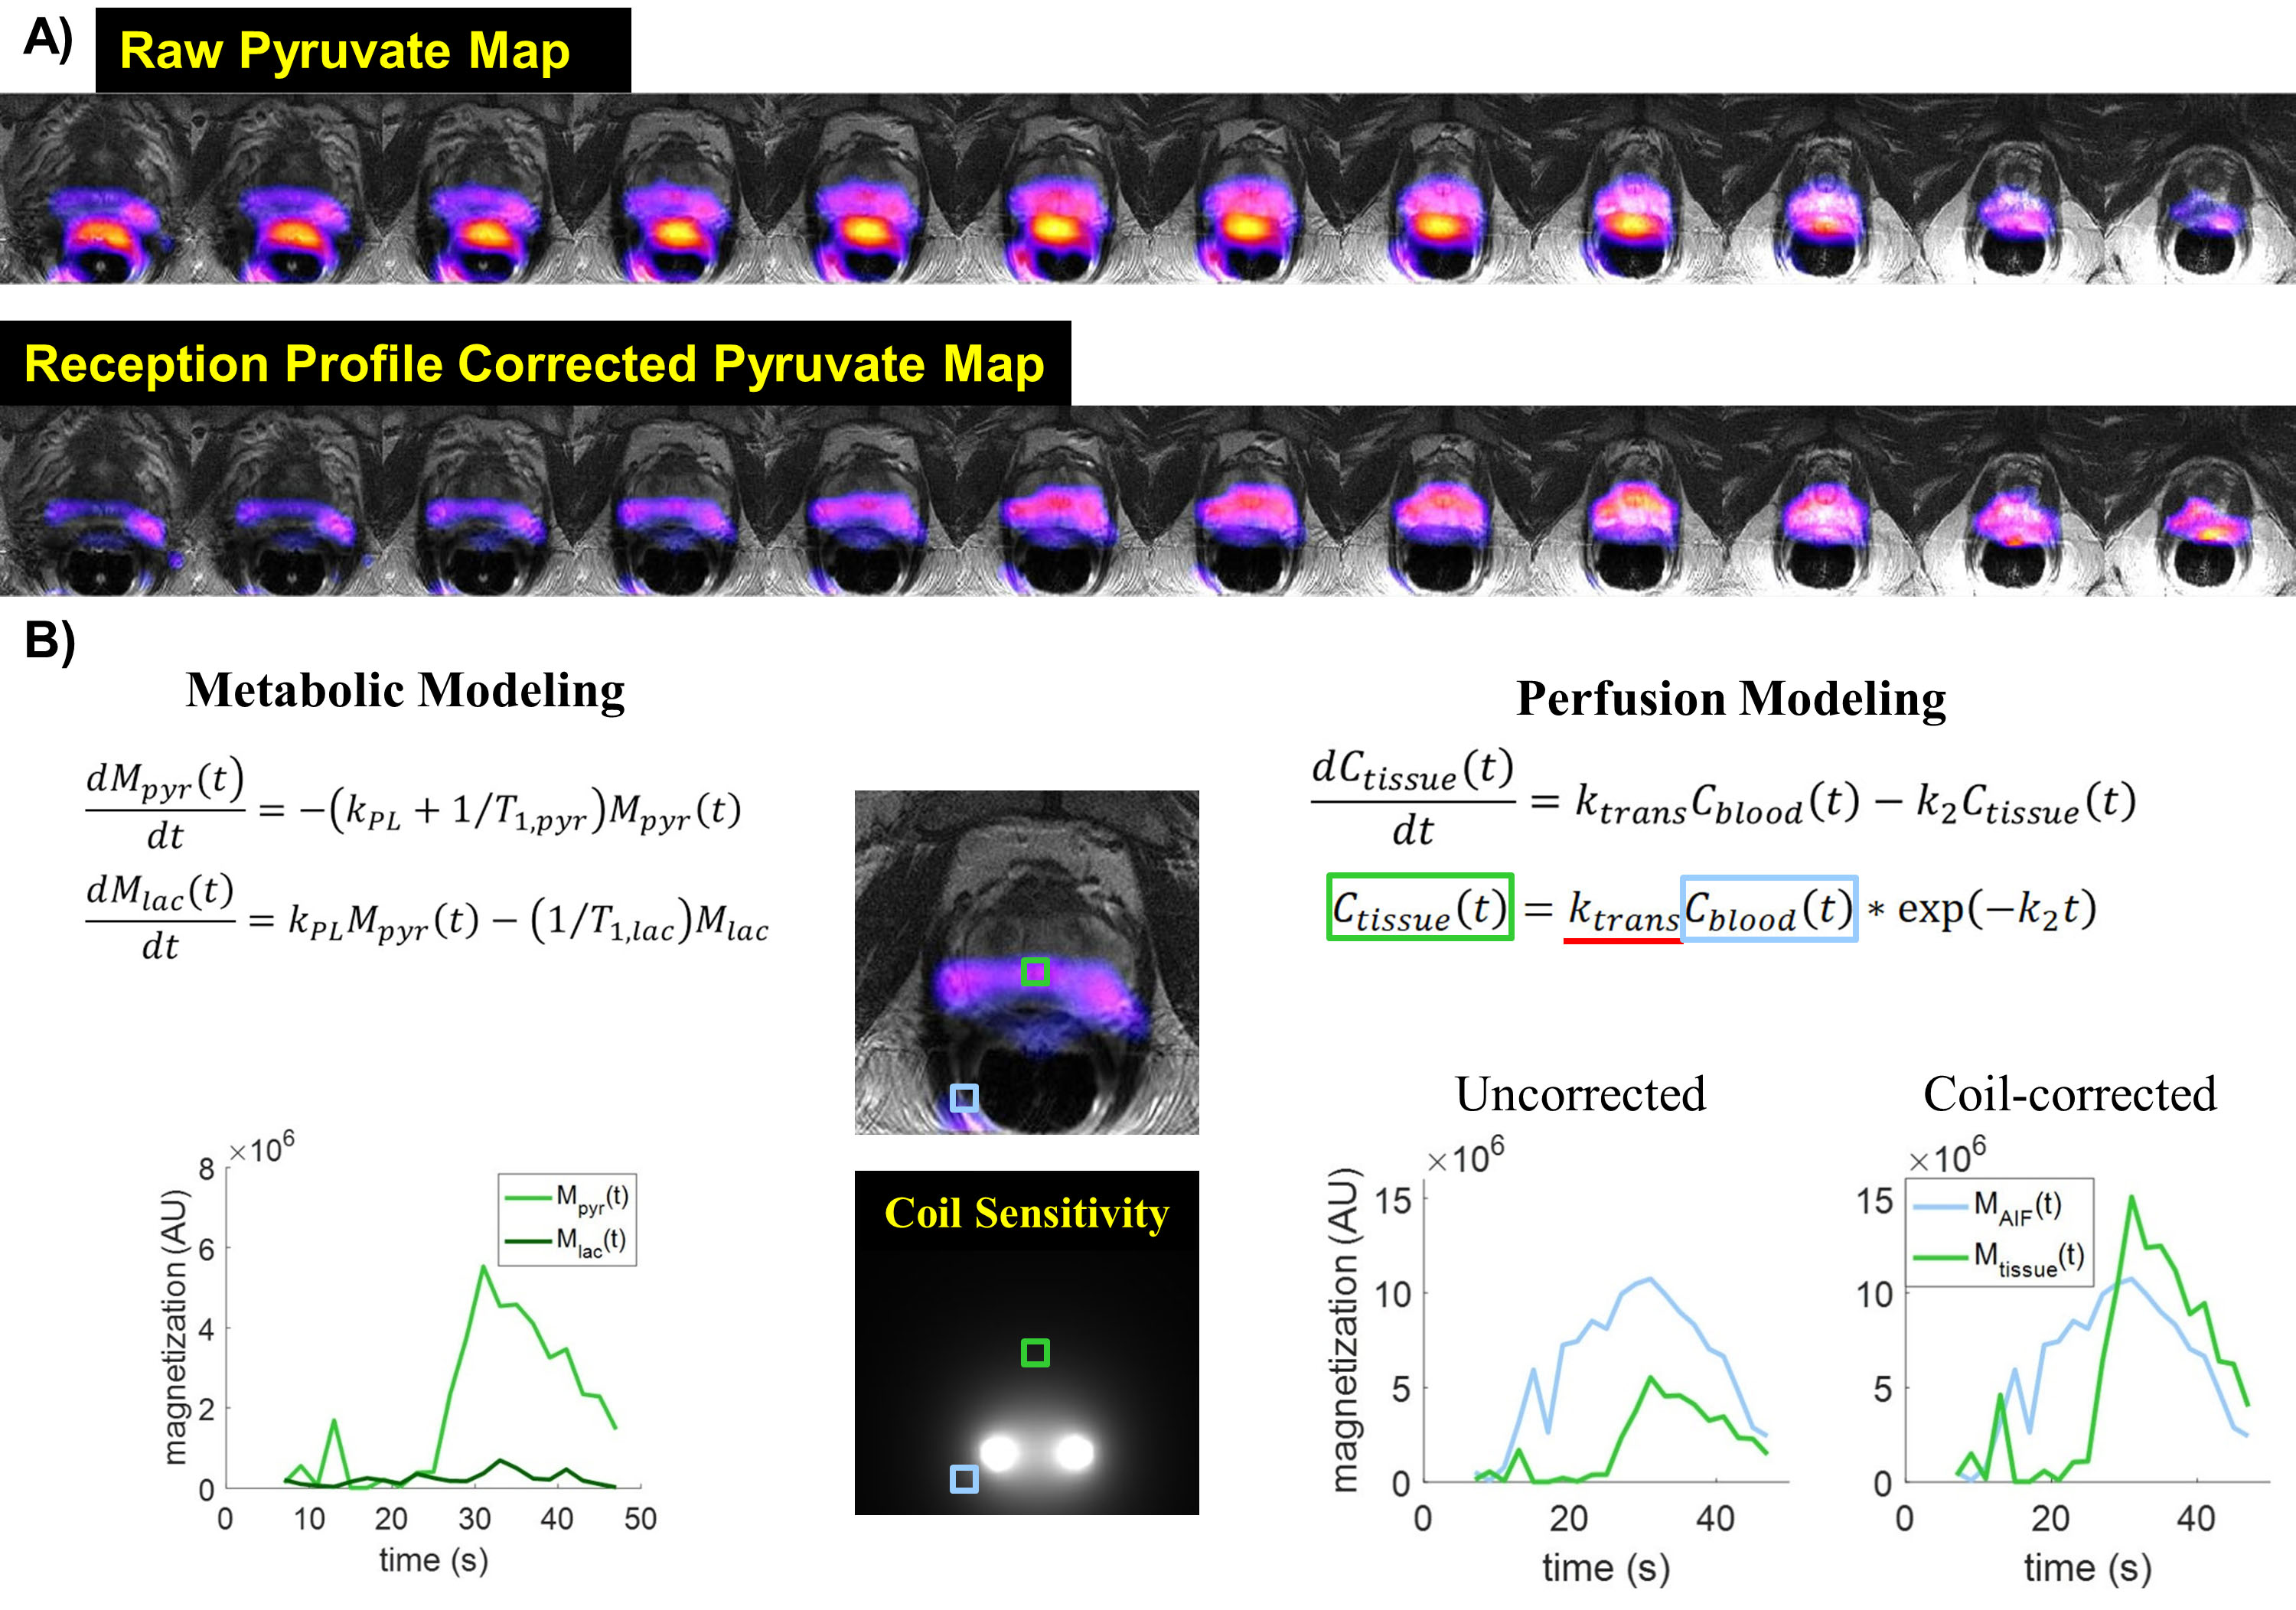
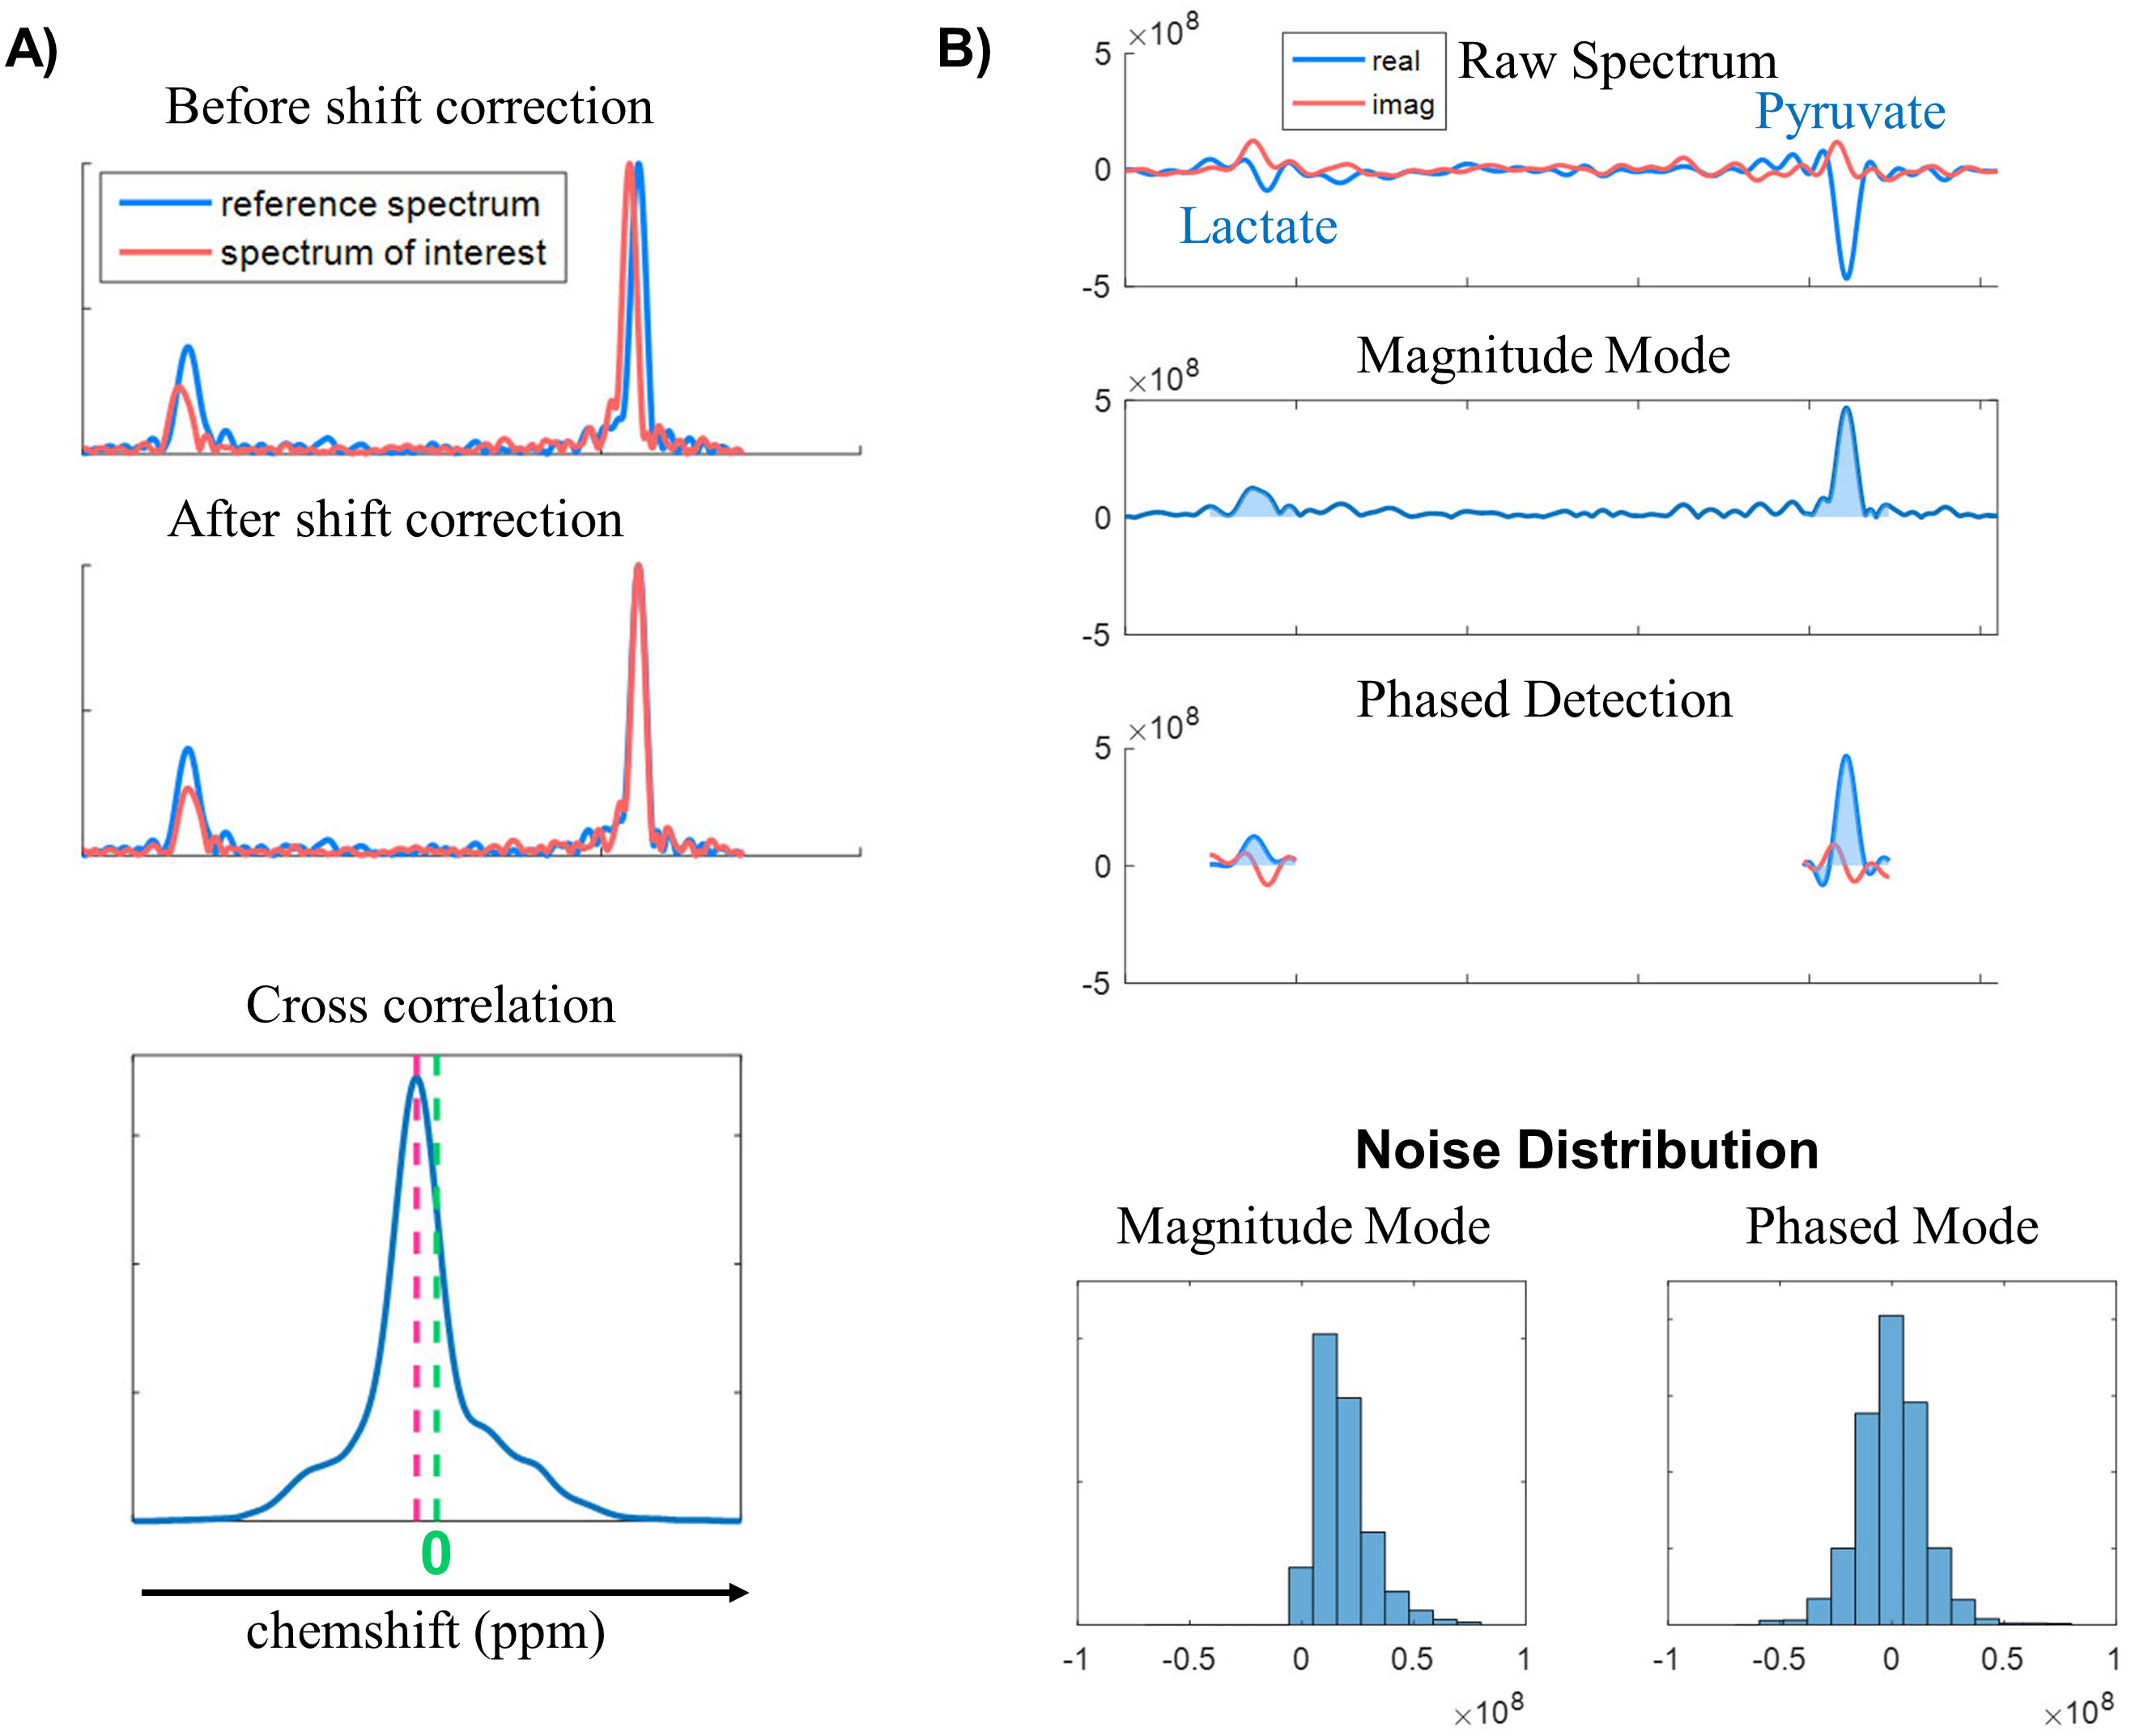
Improved Quantitative Methods: Two types of models were applied to estimate pyruvate-lactate conversion rate kPL. Model 1 was a two-site exchange model with a Gamma-variate arterial input function5. Model 2 was an assumption-less model6. A coil sensitivity correction7 was applied to improve quantitative accuracy. The HP-13C maps were normalized by the reception B1 profile map of the endorectal coil to remove receiver profile weighting. The phased sum of spectrum used zero-order phase correction for each metabolite peak.
Results and Discussions:
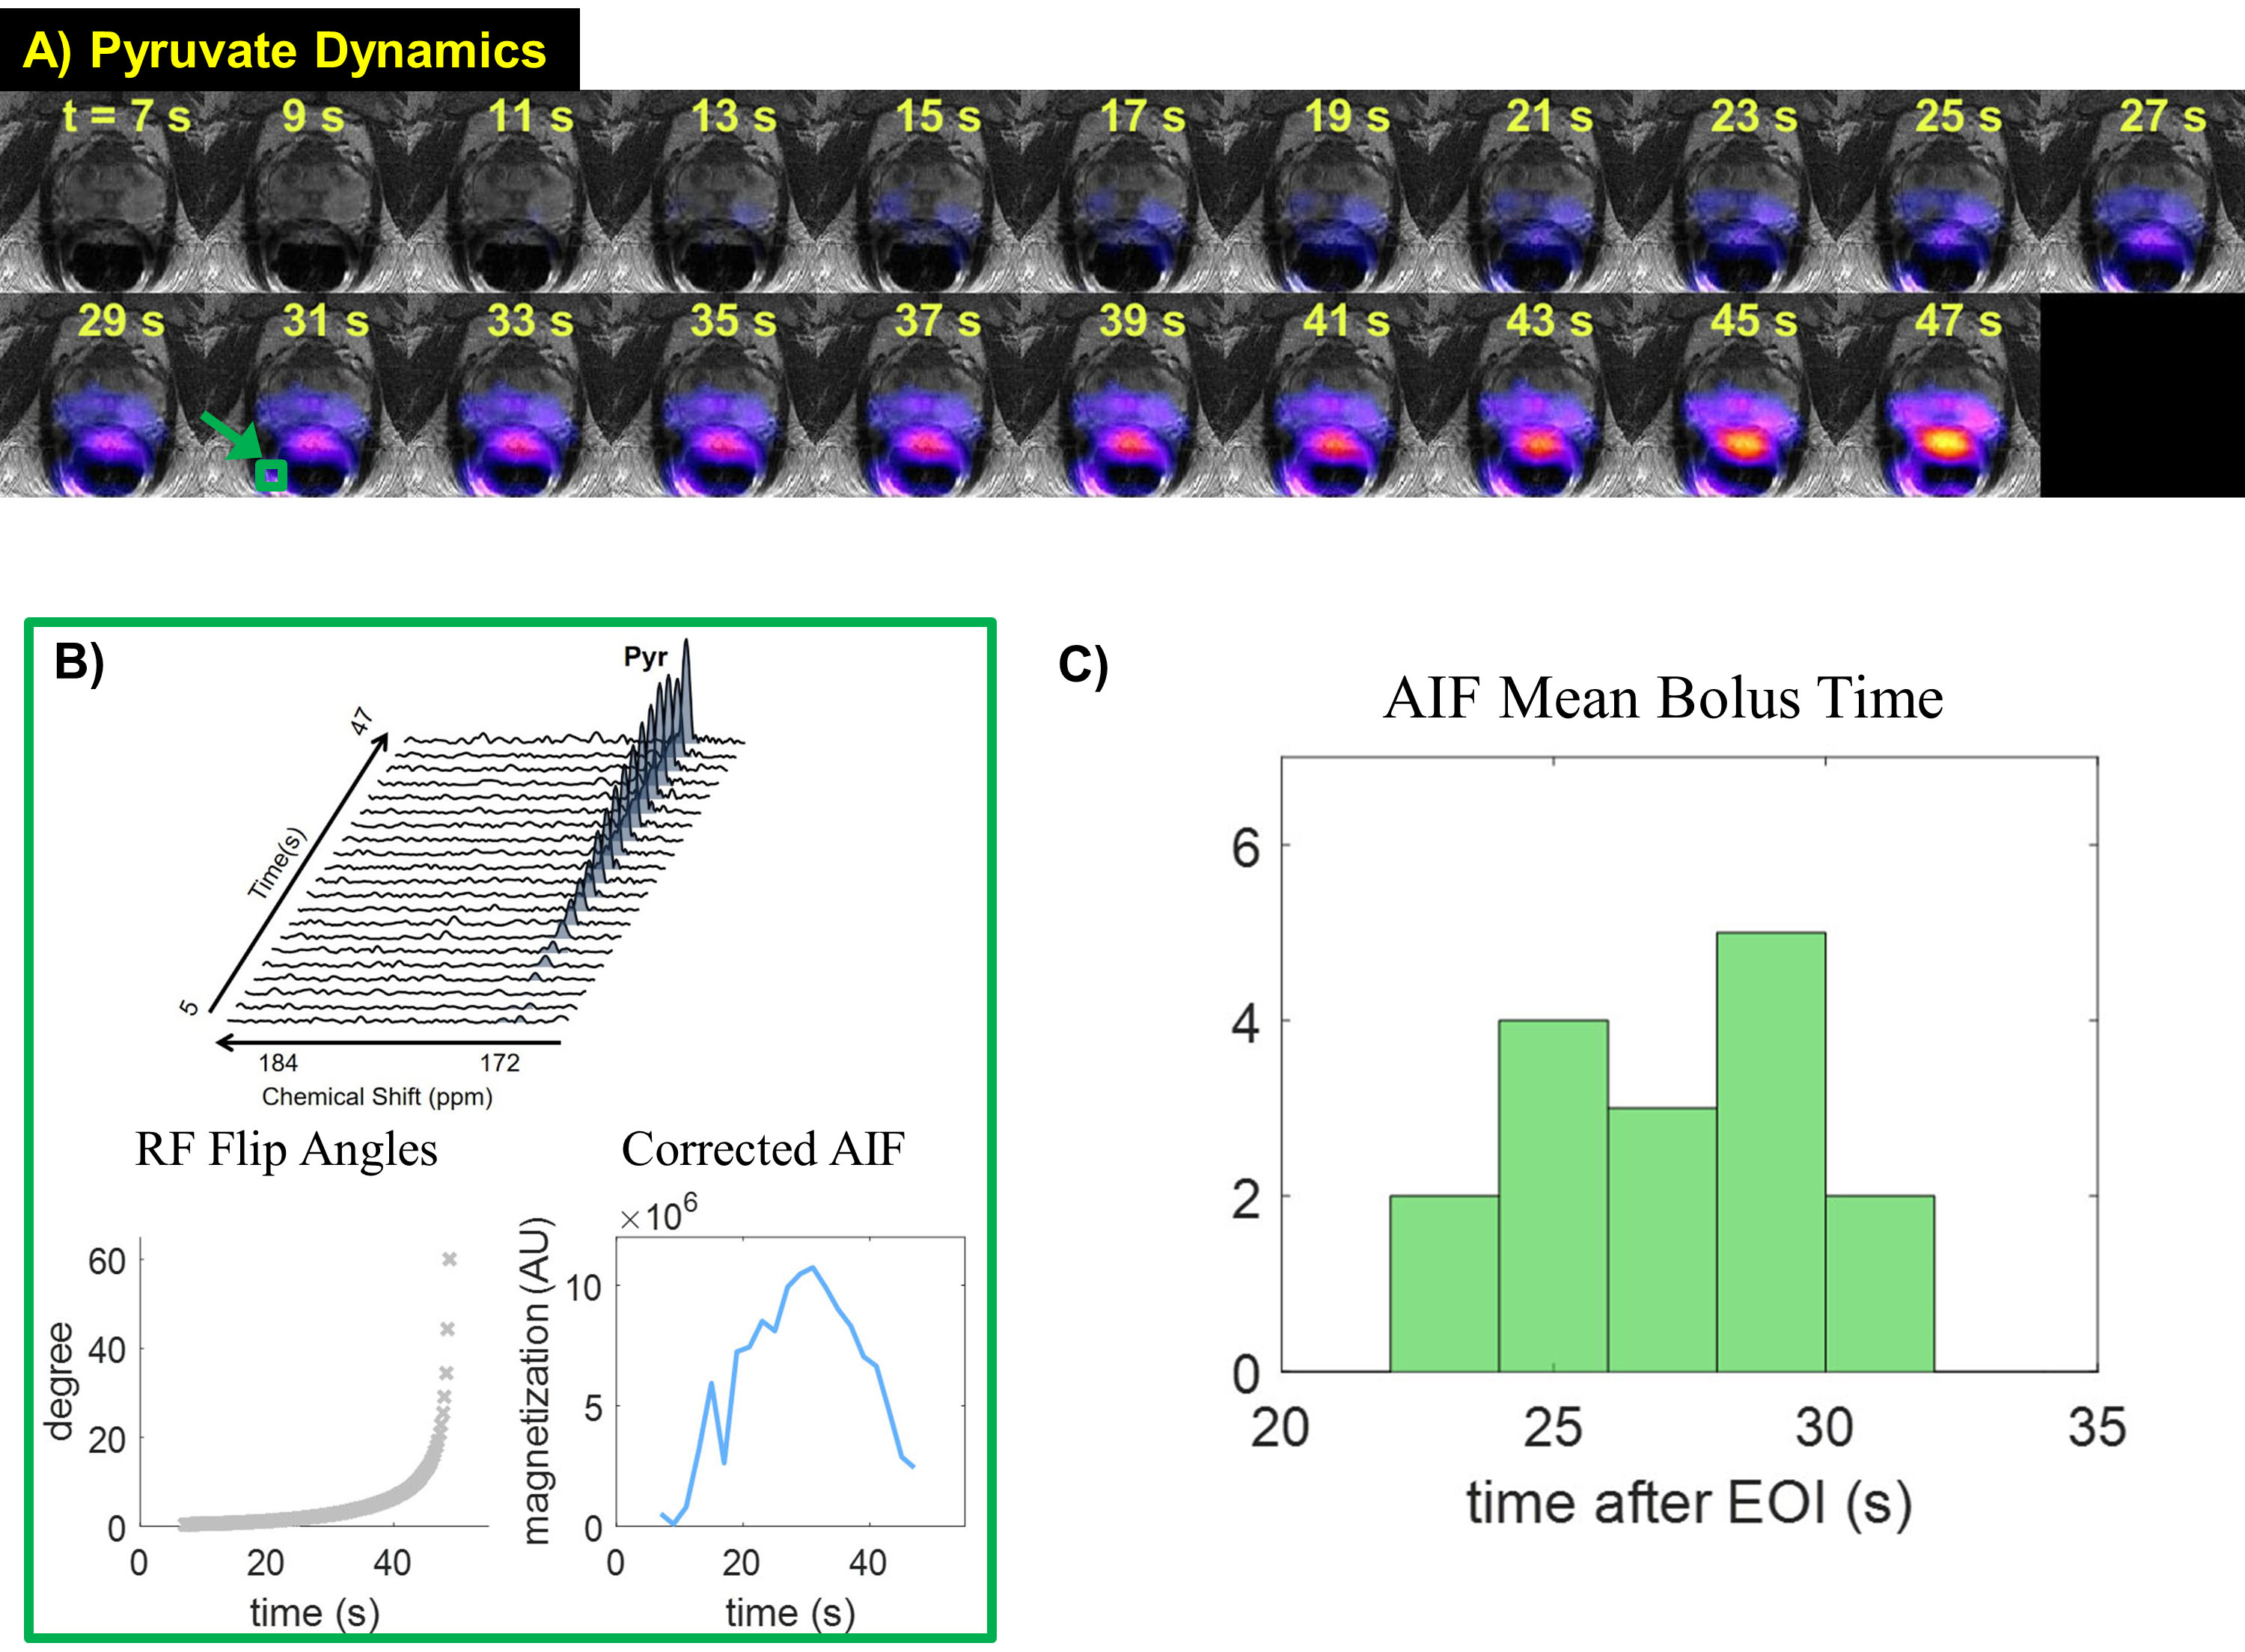
Figure.1A shows pyruvate signal appearing at ~15s after the end of injection in this patient. To investigate the variability across the patient cohort, bolus deliveries were represented by selecting arterial voxels adjacent to the prostate. The arterial signal curve was corrected by the variable RF flip angles, generating an equivalent magnetization curve across time (Fig.1B). The mean injection duration for these patients was 10.7±0.7s, and the mean bolus time in the arterial voxel was detected at 26±6s post-injection (Fig.1C). This indicated that pyruvate bolus delivery was variable among the 17 patients of this study under the similar injection and acquisition timing.
To quantitatively analyze cancer metabolism, we endeavored to develop and test methods for the accurate and robust evaluation of kPL. Model 1 and 2 produced similar kPL maps within the prostate in this patient who had biopsy-confirmed prostate cancer (Fig.2A). Also, comparable fit curves and kPL estimates (0.0235 vs 0.0216s-1) were found in a voxel with high lactate signal (Fig.2B). This highlights the importance of choosing an appropriate model to represent the underlying pyruvate-lactate conversion dynamics.
Figure 3A illustrates a typical map of pyruvate area summed over time before and after reception profile correction7. The correction normalized the strong pyruvate signal seen in the high intensity regions near the receive ER coil. While such corrections do not affect kPL estimation, it benefits the study of pyruvate perfusion and uptake8,9, providing relative quantification across the FOV (Fig.3B).
Another important task is to quantify spectral peaks. On average, less than 0.5ppm of B0 off-resonance shift was observed within the prostate FOV. Such shifts may slightly affect the sum area under peaks, but can easily be corrected using cross correlation between the spectrum of interest and a “reference spectrum (Fig.4A).” Peak detection under magnitude mode of the spectra suffers from noise bias, while a phase-sensitive peak detection using phase-corrected spectrum follows a Gaussian noise distribution, which is zero-mean and has well-understood statistical behavior (Fig.4B).
In summary, the improved acquisition strategies and data analysis allowed better characterization of prostate cancer metabolism in patients. These developments are important for future larger population studies correlating HP-13C MR data with pathological information from either biopsy or post-surgical whole-mount histopathology.
Conclusions
The first 17 patients of phase II clinical trials provided us with invaluable experience and insights on how the data acquisition and analysis can be improved to more robustly acquire and analyze the metabolic information that HP-13C MRI offers.Acknowledgements
This work was supported by grants from the NIH (R01EB017449, R01EB013427, R01CA166655, and P41EB013598).References
[1] Chen HY et al., Phase II Clinical Hyperpolarized 13C 3D-Dynamic Metabolic Imaging of Prostate Cancer using a B1-insensitive Variable Flip Angle Design. Proceedings of the 25th Annual Meetings of ISMRM 2017;
[2] Gordon JW et al., Human Hyperpolarized 13C MRI using a Novel Echo-Planar Imaging (EPI) Approach. Proceedings of the 25th Annual Meetings of ISMRM 2017;
[3] Hu S et al., 3D Compressed Sensing for Highly Accelerated Hyperpolarized C-13 MRSI With In Vivo Applications to Transgenic Mouse Models of Cancer. Magn. Reson. Med. 2010; 63(2):312-21.
[4] Larson PEZ et al., Fast Dynamic 3D MR Spectroscopic Imaging with Compressed Sensing and Multiband Excitation Pulses for Hyperpolarized C-13 Studies. Magn. Reson. Med. 2011; 65(3):610-9.
[5] Zierhut ML et al., Kinetic modeling of hyperpolarized 13C1-pyruvate metabolism in normal rats and TRAMP mice. J. Magn. Reson 2010; 202(1), 85-92.
[6] Maidens J et al., Optimizing flip angles for metabolic rate estimation in hyperpolarized carbon-13 MRI . IEEE Trans. Med. Imag. 2016; 35(11), 2403-2412.
[7] Noworolski SM et al., Post‐processing correction of the endorectal coil reception effects in MR spectroscopic imaging of the prostate. J. Magn. Reson. 2010; 32(3), 654-662.
[8] von Morze C et al., Simultaneous Multiagent Hyperpolarized 13C Perfusion Imaging. Magn. Reson. Med. 2014; 72(6), 1599-1609
[9] Chen HY et al., Assessing Prostate Cancer Aggressiveness with Hyperpolarized Dual-Agent 3D Dynamic Imaging of Metabolism and Perfusion. Cancer Res. 2017; 77(12), 3207-3216
Figures