4480
Investigating Pulmonary Gas Transport Processes with Hyperpolarized Xenon-129 Dissolved-Phase MRI1Radiology, University of Pennsylvania, Philadelphia, PA, United States
Synopsis
Several hyperpolarized xenon-129 (HXe) MRI techniques have been developed for characterizing lung function through the observation of parenchymal xenon gas uptake, but these methods tend to provide only a snapshot of a steady-state distribution of the xenon signal within the lung parenchyma. In this study, we investigated the feasibility of extracting gas-transport maps from the relative signal changes between two dissolved-phase images captured with different acquisition parameters. We demonstrated how the acquisition parameters of a suitably-designed HXe MRI pulse sequence can be harnessed for tracing pulmonary gas transport processes, and potentially quantifying them at an unprecedented level.
Purpose
A major challenge for the comprehensive evaluation of lung function is the difficulty of measuring the temporal dynamics of gas transport from the alveolar airspaces into the heart and, ultimately, the circulatory system. Several hyperpolarized xenon-129 (HXe) MRI techniques have been developed for characterizing lung function through the observation of parenchymal xenon gas uptake1-7, but these methods tend to provide only a single snapshot of a fairly arbitrary steady-state distribution of the xenon signal within the lung parenchyma. In this study, we investigated the feasibility of extracting gas-transport maps from the relative signal changes between two dissolved-phase images captured with different acquisition parameters, where the choice of the imaging parameters determined which stage of the transport process is emphasized.Methods
Imaging experiments were performed in 3 sedated New Zealand rabbits (approx. 4.5 kg). Animals were ventilated with room air until imaging began, at which point the gas mix was switched to 20% oxygen and 80% HXe for two breaths (6 ml/kg tidal volume). Imaging was performed at end inspiration of the second breath. All studies were approved by the Institutional Animal Care and Use Committee. MR imaging was conducted using a 2D-projection gradient-echo sequence that employed a non-selective 900-μs Gaussian RF excitation pulse centered 3,530 Hz downfield from the gas-phase resonance. Taking advantage of the large frequency difference between the two phases combined with a sufficiently small acquisition bandwidth, HXe in the pulmonary air spaces and dissolved in the lung tissue were imaged simultaneously, side-by-side4. The following sequence parameters were used: matrix size 36×80; TR 10-250 ms; TE 2.7 ms; flip angle 40° or 75°; FOV 238 mm; receiver bandwidth 110 Hz/pixel. DP image ratios were calculated by masking the two images in a set with the thresholded image with the shorter TR, and then dividing the DP image with the longer TR by that of the shorter TR. All MR studies were performed at 1.5T (Avanto; Siemens), using a custom xenon-129 transmit/receive birdcage coil (Stark Contrast, Erlangen, Germany). Enriched xenon gas (87% xenon-129) was polarized using a prototype commercial system (XeBox-E10, Xemed LLC, Durham, NH).Results and Discussion
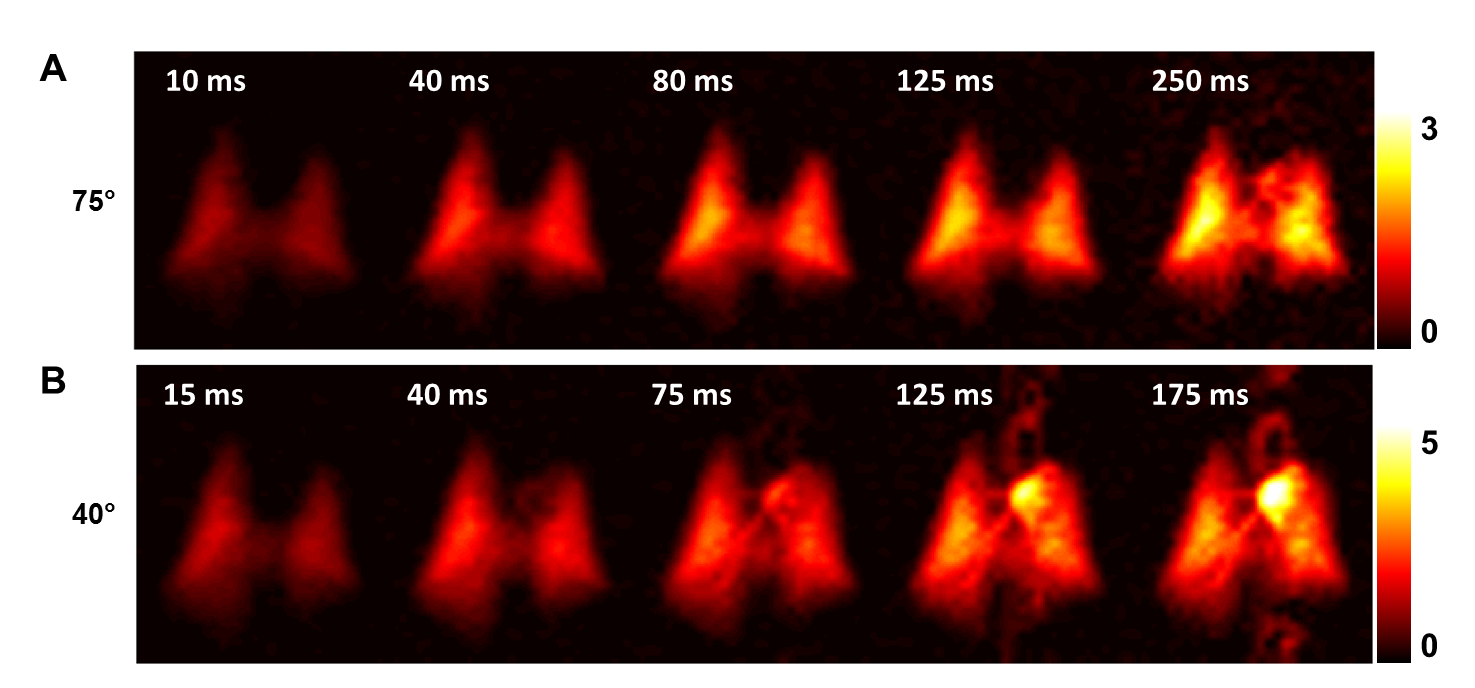
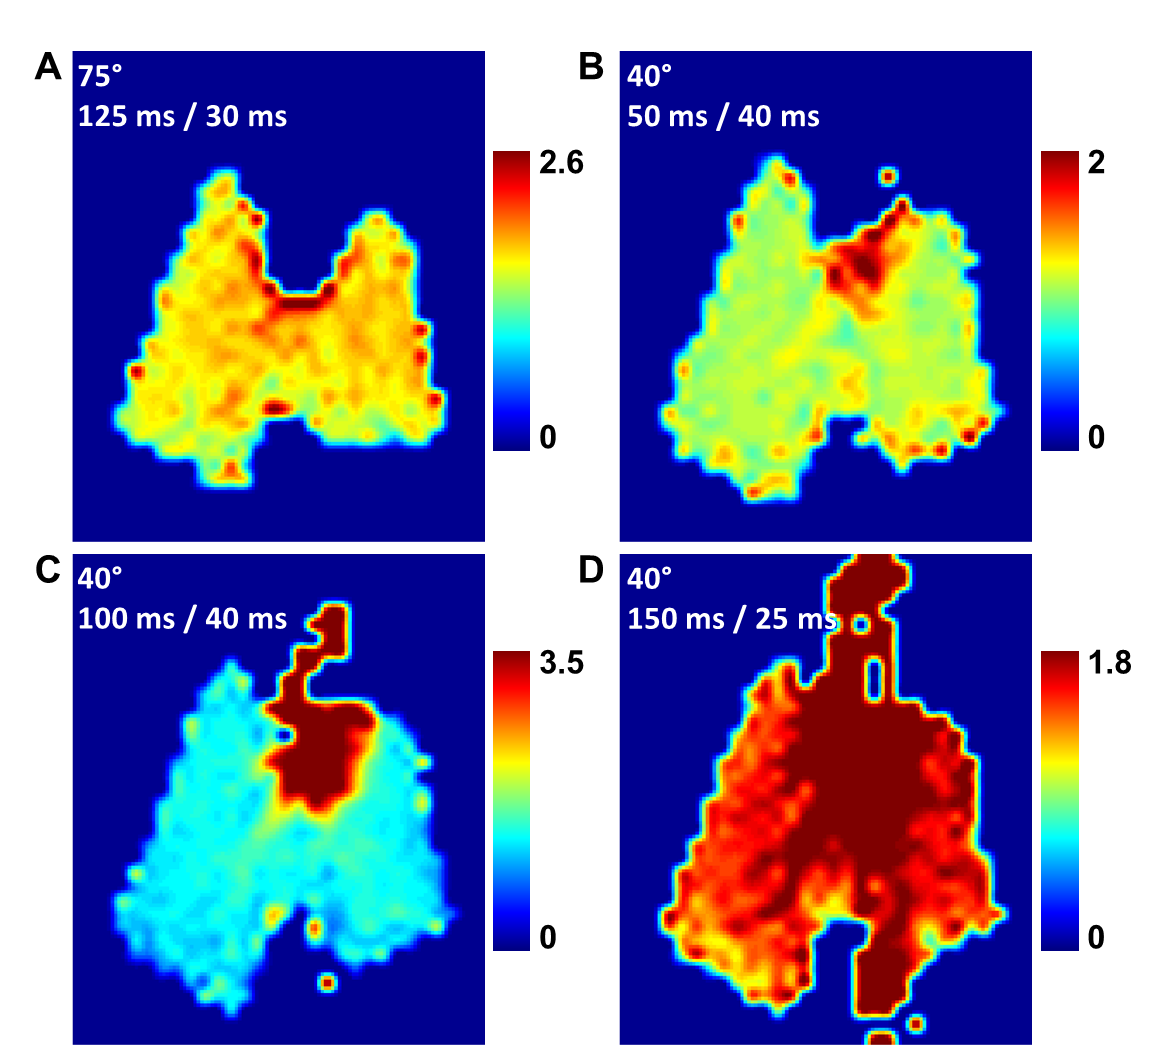
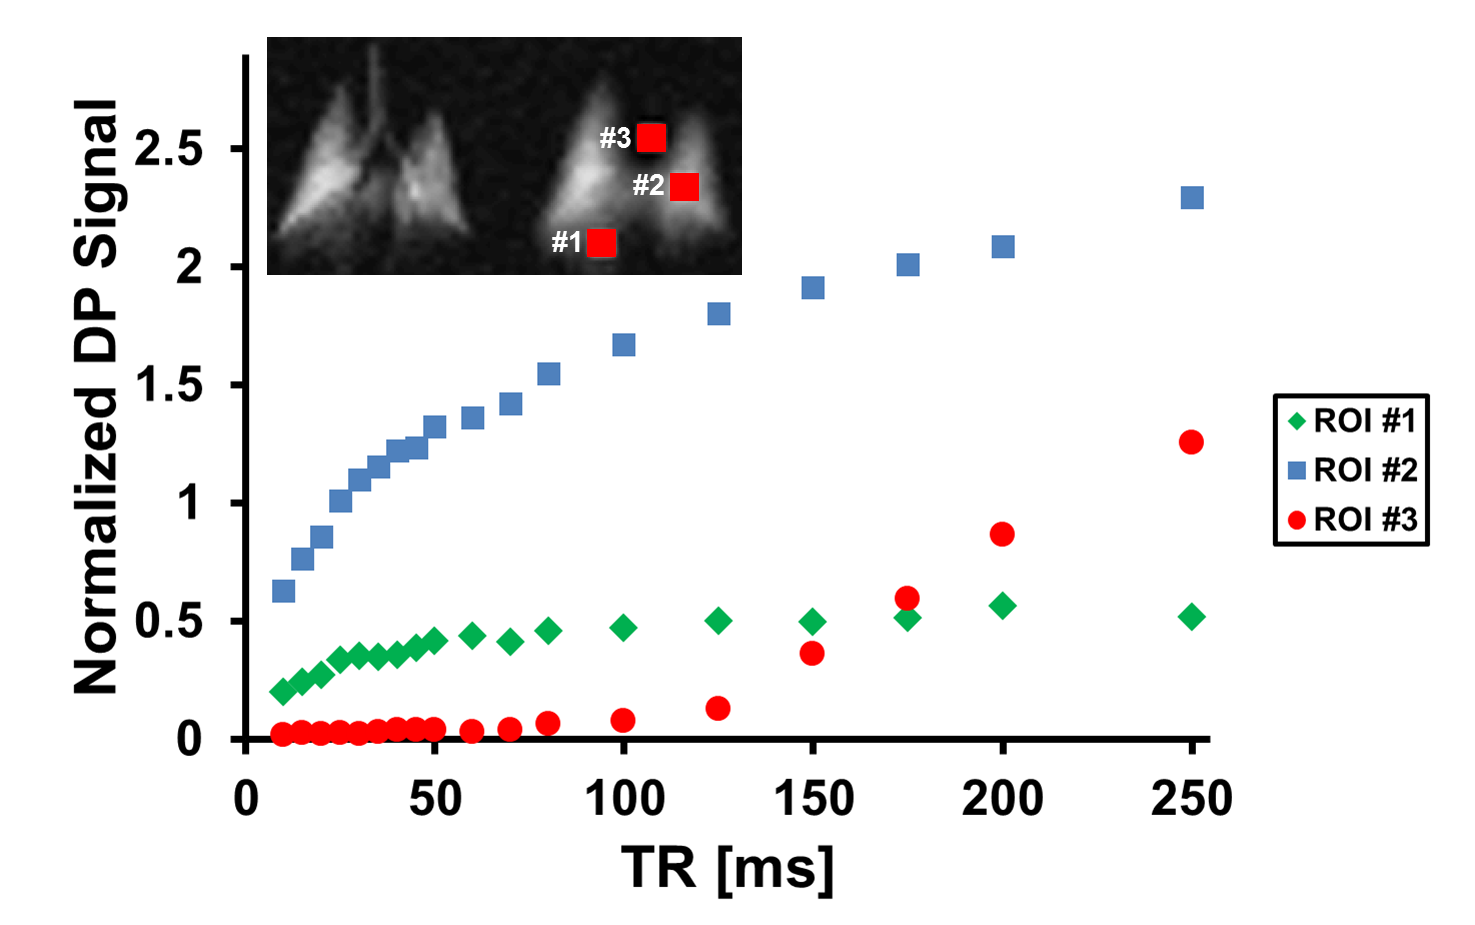
Figure 1 illustrates the dynamic aspects of gas uptake in the alveoli and subsequent transport through the vasculature to the heart. The distribution of the DP signal in the chest is strongly dependent on the TR of the image acquisition (Fig. 1A). As the TR is increased, additional time is available for the xenon gas to saturate the lung tissue and follow the circulation to more distal locations. The apparent gas transport dynamics for a flip angle of 40° (Fig. 1B) are very similar to those for a flip angle of 75°, albeit on an accelerated time scale.Juxtaposition of DP maps acquired with different TRs and/or flip angles can be used to highlight various aspects of DP gas transport during the breathing process or at breath-hold. For example, Fig. 2 shows various DP ratios of acquisitions with different flip angle / TR combinations. These relative-change maps reveal details of the pulmonary gas transport that are largely indiscernible via the analysis of the underlying DP image intensities alone.To allow an initial quantitative assessment of xenon gas uptake and its dependence on TR, we defined 3 regions of interests (ROIs) in the DP images. The location of these ROIs is displayed in the insert of Fig. 3. The plot in Fig. 3 shows the DP signal behavior in the selected ROIs as a function of TR with a fixed flip-angle of 75°. The signal in ROI #1 increases for approximately 80 ms and then levels off, while the signal in ROI #2 continues to rise fairly linearly. The DP signal from ROI #3 stays at the noise level for about 80 ms, at which point the first dissolved xenon gas has travelled from the alveolar gas exchange regions to the heart. After 125 ms, the signal level begins to rise rapidly and approximately linearly with TR.Conclusion
In this work, we have demonstrated how the acquisition parameters of a suitably-designed HXe MRI pulse sequence can be harnessed for tracing pulmonary gas transport processes, and potentially quantifying them at an unprecedented level. Once future research in lung disease models has determined which parameter combinations and relative-change maps are most valuable for the characterization of lung function, two or possibly more parameter permutations could be acquired during the same breath-hold. Further exploration of these methods could serve as an experimental foundation for the development and testing of comprehensive theoretical gas uptake models.Acknowledgements
Supported by NIH grants R01 EB015767 and R01 HL129805.References
[1] Ruppert et al. NMR of hyperpolarized 129Xe in the canine chest: spectral dynamics during a breath-hold. NMR Biomed 2000;13:220-228.
[2] Driehuys et al. Imaging alveolar–capillary gas transfer using hyperpolarized 129Xe MRI. Proc Natl Acad Sci USA 2006;103:18278-18283.
[3] Patz et al. Human Pulmonary Imaging and Spectroscopy with Hyperpolarized 129Xe at 0.2T. Acad Radiol 2008;15:713-727.
[4] Mugler et al. Simultaneous magnetic resonance imaging of ventilation distribution and gas uptake in the human lung using hyperpolarized xenon-129. Proc Natl Acad Sci USA 2010;107(50):21707-21712.
[5] Cleveland et al. Hyperpolarized 129Xe MR Imaging of Alveolar Gas Uptake in Humans. Plos One 2010;5:e12192.
[6] Qing et al. Regional Mapping of gas uptake by blood and tissue in the human lung using hyperpolarized xenon-129 MRI. J Magn Reson Imaging 2013; 39(2):346-359.
[7] Doganay et al. Quantification of regional early stage gas exchange changes using hyperpolarized 129Xe MRI in a rat model of radiation-induced lung injury. Magn Reson Med 2016;76:566-576.
Figures