4477
Repeatability of Pulmonary Functional Metrics of Gas-exchange Measured with Hyperpolarized Xenon-129 MRI1Medical Physics, University of Wisconsin - Madison, Madison, WI, United States, 2Biostatistics and Medical Informatics, University of Wisconsin - Madison, Madison, WI, United States, 3Radiology, University of Wisconsin - Madison, Madison, WI, United States, 4Biomedical Engineering, University of Wisconsin - Madison, Madison, WI, United States
Synopsis
To advance hyperpolarized Xenon-129 MRI as a robust tool for probing pulmonary gas-exchange in lung diseases, establishing repeatability of quantitative ratios and regional metrics is critical. Repeatability was assessed using Bland-Altman analysis. Average inter-visit tissue-to-gas, red blood cell-to-gas (RBC-to-gas) and RBC-to-tissue ratios were highly repeatable; the primary source of variation was due to lung inflation volume variations, suggesting consistency of breath-hold coaching and dose delivery is important. Regional distribution of measures was also qualitatively well-matched between visits. Demographic factors may also influence these measures; our preliminary data indicate a significant relationship between RBC-to-tissue ratio and subject age.
Purpose
Hyperpolarized Xenon-129 (HP-129Xe) MRI is a safe and increasingly attractive technique for quantification of pulmonary functional gas-exchange in patients with lung diseases including COPD and idiopathic pulmonary fibrosis1-3. Here we investigate the long term (~4 weeks) visit-to-visit repeatability of these imaging based metrics in healthy adult patients.Methods
A cohort of 8 healthy adult subjects (ages 30-69 yrs, mean 54.0, standard deviation 12.0) underwent HP-129Xe MRI on a 1.5T scanner (General Electric, Waukesha, WI) using a quadrature vest coil tuned to the xenon resonant frequency of 17.66 MHz @ 1.5T (Clinical MR Solutions, Brookfield, WI). Each subject was imaged with an identical protocol at 2 separate time points, with ~1 month between visits (range 28-40 days, mean 32.8 days, standard deviation 4.5 days). Dissolved and gaseous phase HP-129Xe images were acquired with a single ~14 second breath hold scan following exhalation to functional reserve capacity (FRC) then inhalation of 1L of isotopically enriched (85%) 129Xe polarized to ~14-20%, with sequence parameters as described in Kaushik et al4. Tissue and red blood cell (RBC) components were separated from the dissolved phase using a 1-point Dixon method5. Regional measures were compared to reference distributions constructed from healthy normal subjects (Gaussian with a mean±standard deviation) for ventilation (0.43±0.17), tissue-to-gas (1.05±0.28) and RBC-to-gas (0.33±0.18), and lung voxels were binned based on the number of standard deviations they were offset from the reference mean6. 3D proton ultrashort echo time (UTE) MRI was also acquired for the purposes of lung segmentation. The lungs were semi-automatically segmented and subsequently deformably registered to the HP-129Xe ventilation images. Lung volumes at each time point were quantified by multiplying the voxel volume by the number of lung voxels. Bland-Altman plots, coefficient of variation (CV), and intra-class correlation coefficient (ICC) were used to investigate the inter-visit repeatability of whole-lung (i.e. mean of lung voxels) tissue-to-gas, RBC-to-gas and RBC-to-tissue ratios. The distribution of binned voxels within the lungs was also qualitatively compared visually using histogram plots. Given previous literature describing a relationship between gas-exchange metrics and lung inflation level2, we also investigated the correlations between inter-visit differences in lung volumes and whole-lung tissue-to-gas, RBC-to-gas and RBC-to-tissue ratios. Finally, we explored the dependency of these ratios on subject age.Results
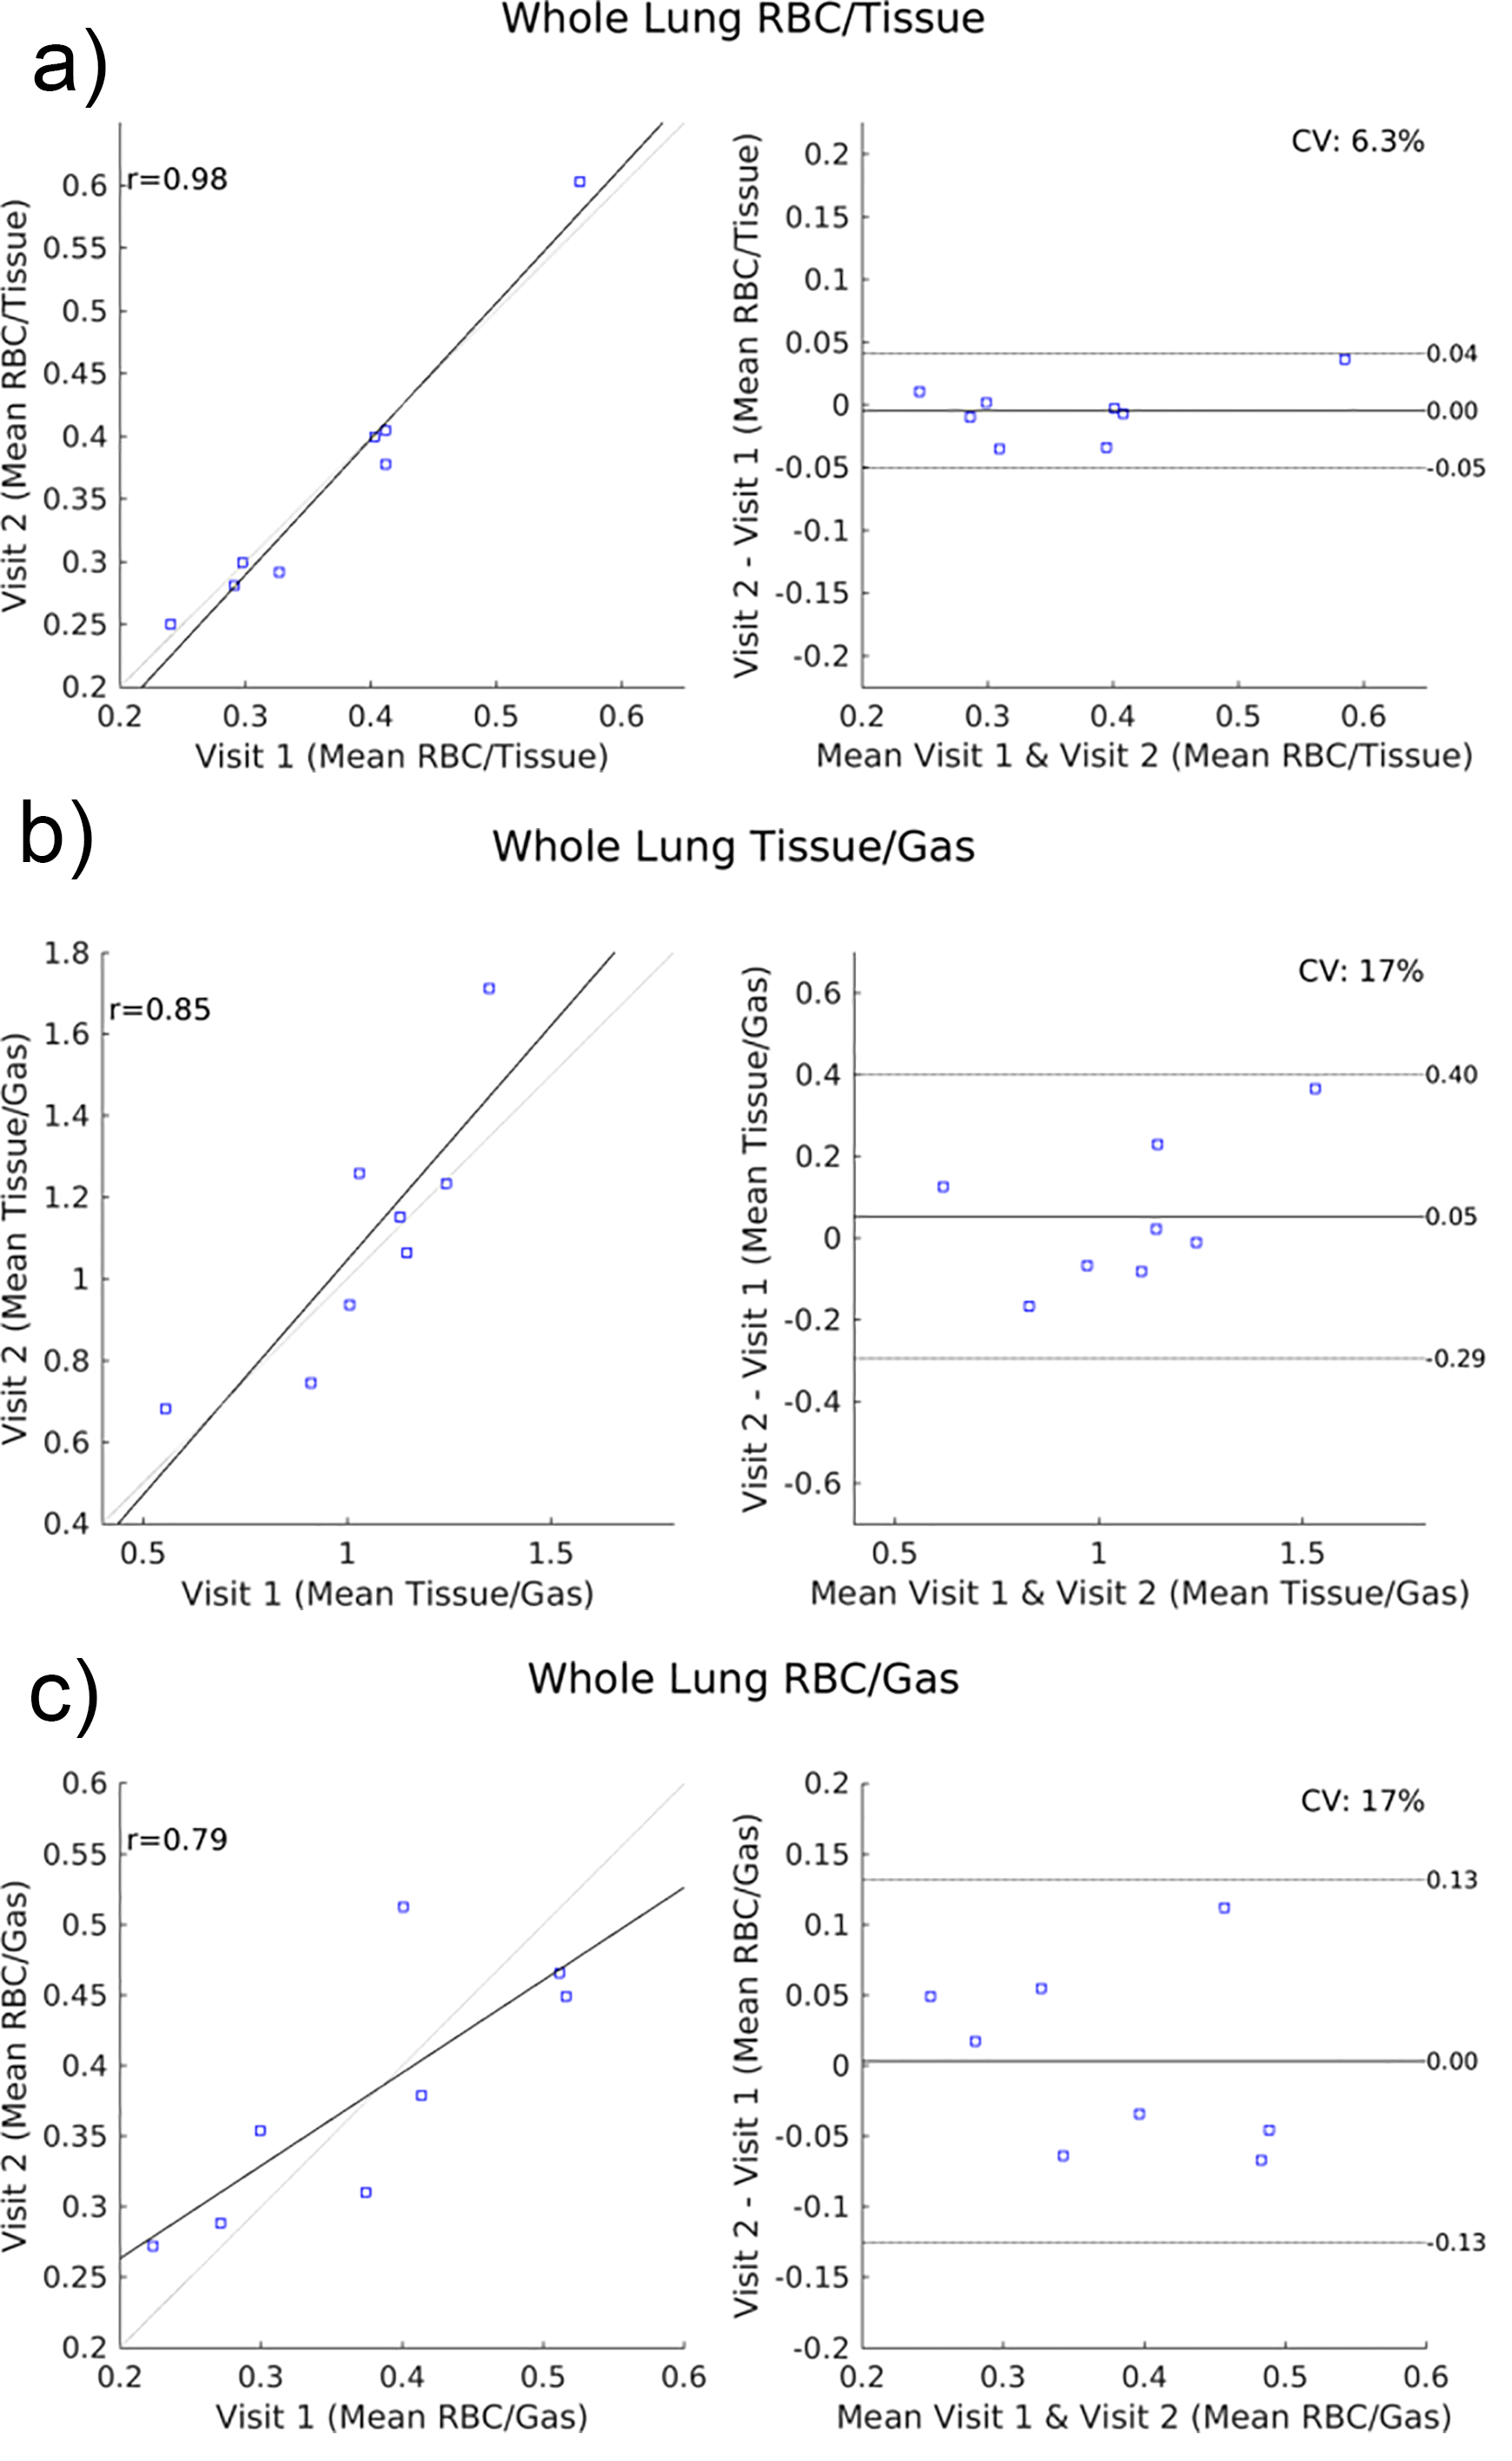
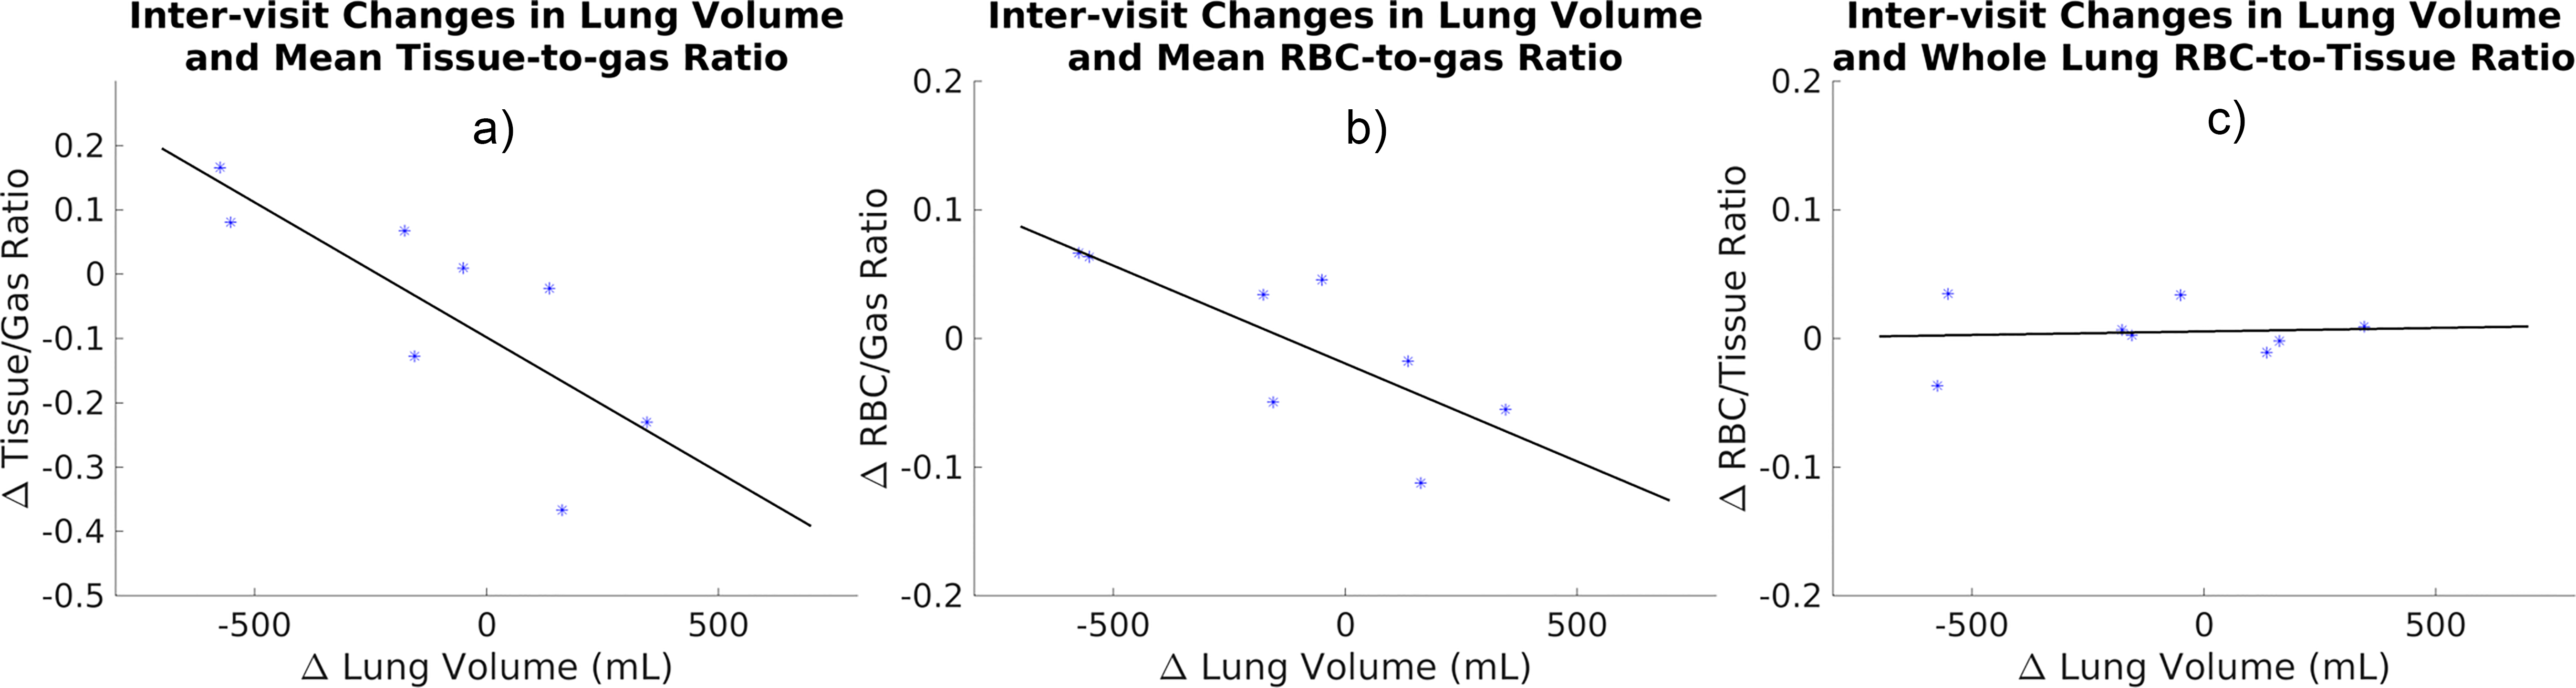
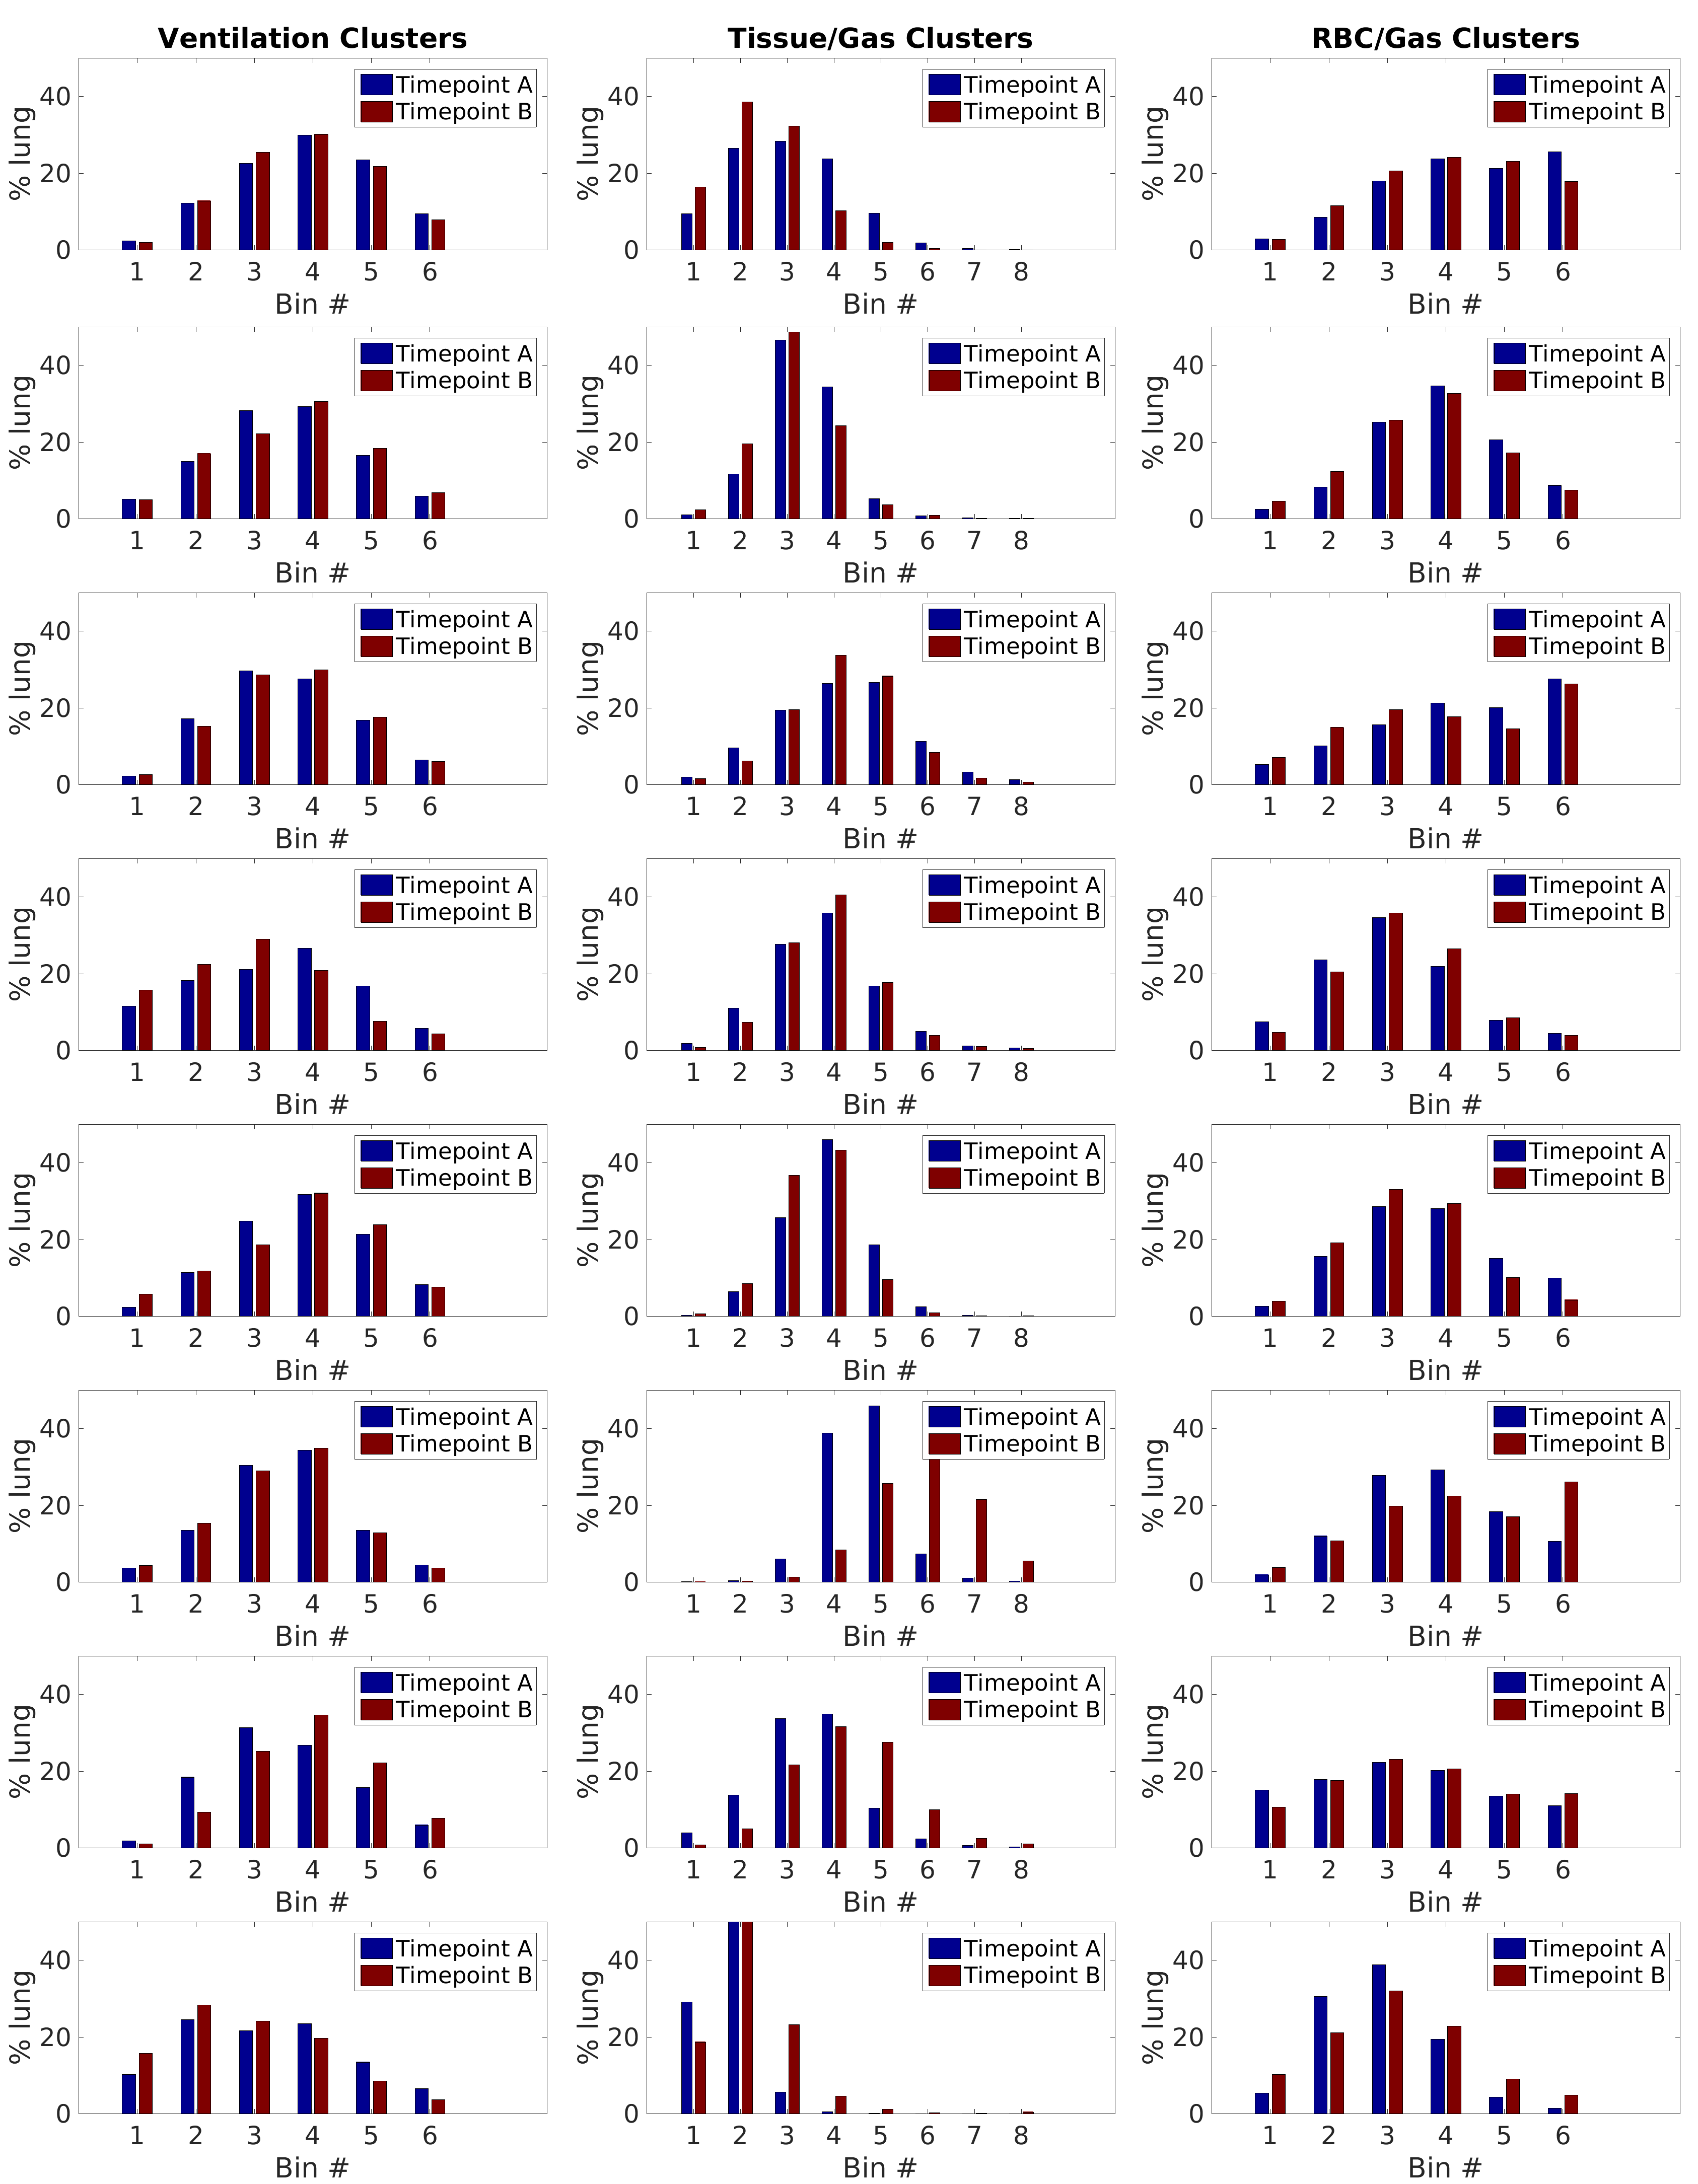
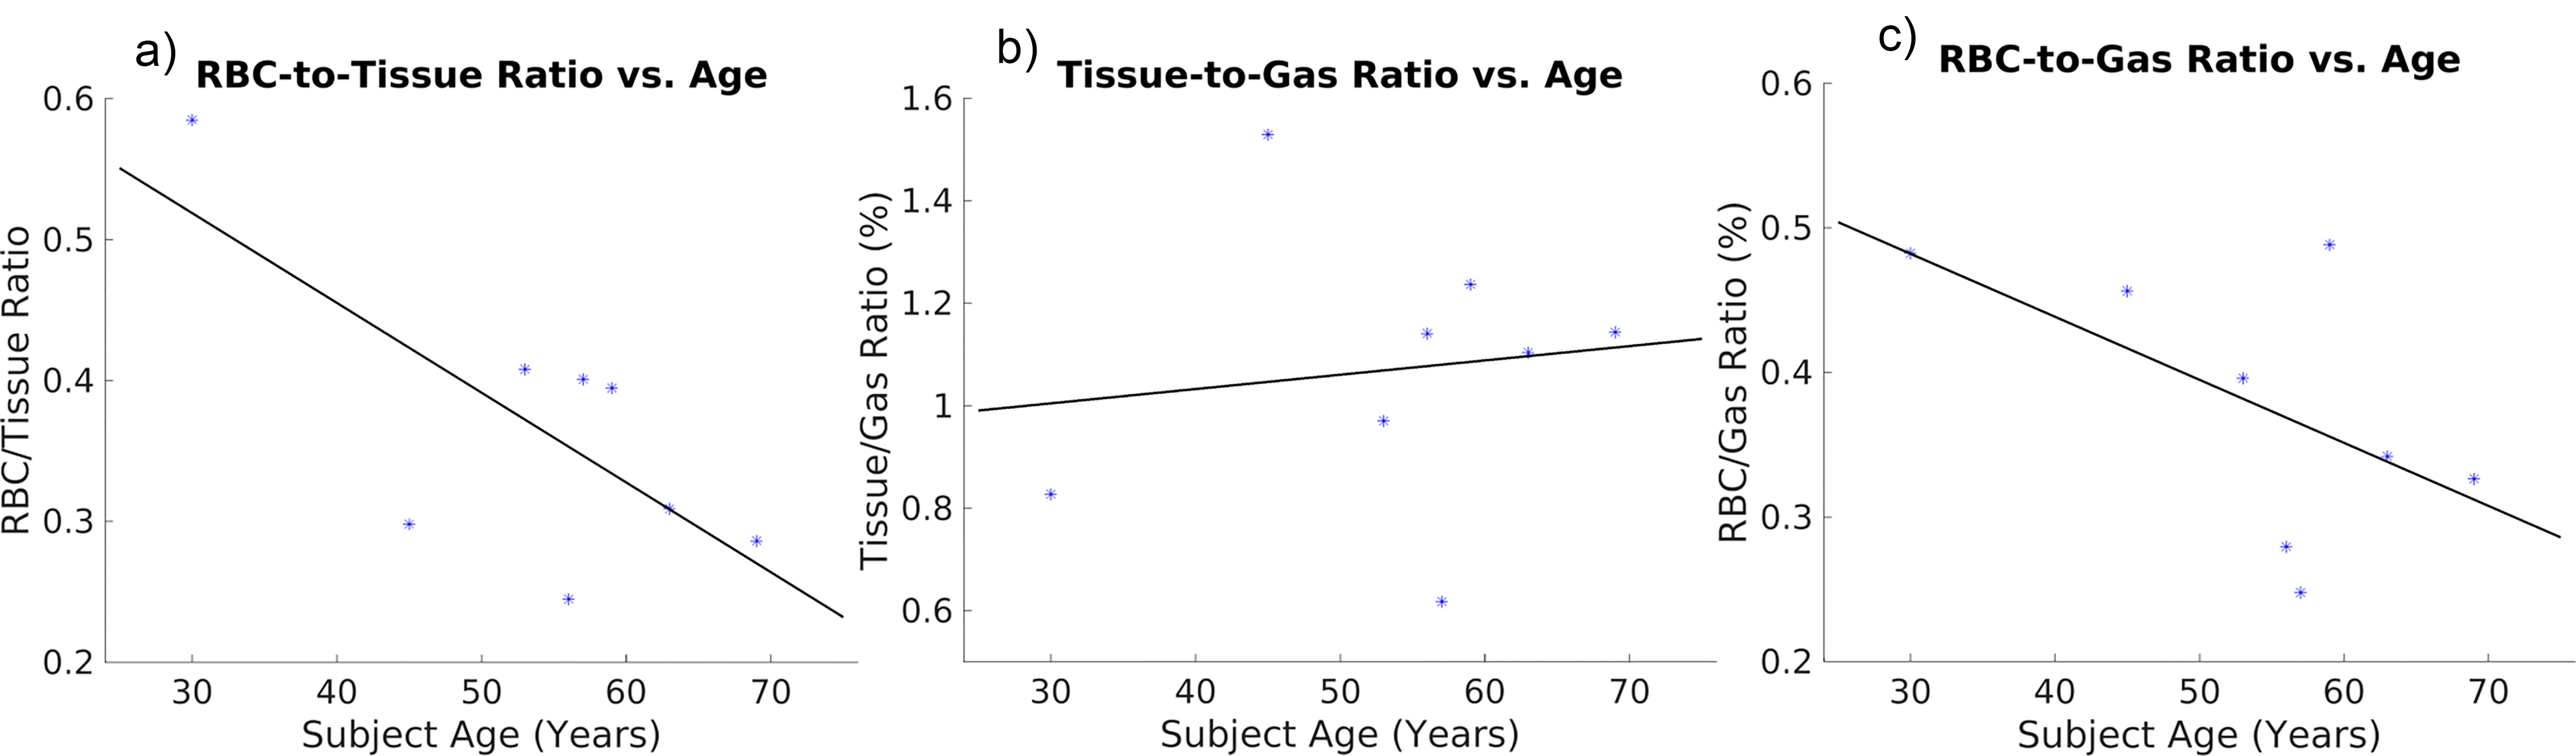
Bland-Altman and correlation plots for mean tissue-to-gas, RBC-to-gas and RBC-to-tissue ratios are shown in Figure 1. Mean RBC-to-tissue ratio is highly repeatable (CV=6.3%, ICC=0.98), while both tissue-to-gas and RBC-to-gas are similarly slightly less so (Tissue-to-gas: CV=17%, ICC = 0.82, RBC-to-gas: CV=17%, ICC=0.80). Scatterplots of difference in lung volumes vs. gas-exchange metrics, shown in Figure 2, demonstrate one potential source of this discrepancy. Inter-visit changes in both tissue-to-gas and RBC-to-gas are moderately-to-strongly correlated with changes in lung volume (Tissue-to-gas: r=-0.78, P=0.022, RBC-to-gas: r=-0.76, P=0.026). No such association is apparent between RBC-to-tissue and lung volume changes (r=0.08, P=0.854). Histograms of voxels binned according to normal subject reference distributions at both visits are shown for the entire cohort in Figure 3, demonstrating good agreement, in general, in the inter-scan regional distribution of these voxel-wise metrics. Finally, scatterplots of gas-exchange metrics vs. age are shown in Figure 4. A significant negative correlation was found between RBC-to-tissue ratio and age (r=-0.71, P=0.048). Correlations between age and both tissue-to-gas and RBC-to-gas were not significant (Tissue-to-gas: r=0.12, P=0.773, RBC-to-gas: r=-0.56, P=0.147).Discussion and Conclusion
These results indicate that common HP-129Xe imaging based metrics of gas-exchange are highly repeatable visit-to-visit over the long term (~4 weeks). While tissue-to-gas and RBC-to-gas ratios are slightly less repeatable than RBC-to-tissue, it seems likely that this is largely due to inter-visit variations in lung volumes, which appear to influence the former two ratios, but not the latter. The associations (or lack thereof) between these metrics and lung volume can explain the additional inter-scan variation and are consistent with previous findings based on total lung spectroscopy2. Histograms of the regional distribution of these voxel-wise metrics are qualitatively well-matched, in the majority of cases, further strengthening the case for repeatable measures. Generally, when the distributions are poorly matched, histogram shape is largely preserved, indicating that a bulk shift in the distribution (potentially related to lung volume differences) has occurred. Notably, ventilation histograms are very repeatable, which might be expected given that they are less affected by variation in lung volumes. Finally, the effect of age on RBC-to-tissue highlights the importance of age matching in subject cohorts. These results are very encouraging; however, more precise, quantitative, regional analysis is important to comprehensively justify the repeatability of these techniques and is the focus of ongoing and future work.Acknowledgements
The authors would like to acknowledge financial support from NIH/NHLBI R01 HL126771, NIH/NCRR 1 S10 OD016394 (the Pulmonary Imaging Center), and NIH/NCATS UL1 TR000427 to UW ICTR for funding support.References
1. Qing K, Ruppert K, Jiang Y, Mata JF, Miller GW, Shim YM, Wang C, Ruset IC, Hersman FW, Altes TA, Mugler JP. Regional mapping of gas uptake by blood and tissue in the human lung using hyperpolarized xenon-129 MRI. J Magn Reson Imaging. 2014; 39(2):346–359.
2. Kaushik SS, Freeman MS, Yoon SW, Liljeroth MG, Stiles JV, Roos JE, Foster WM, Rackley CR, McAdams HP, Driehuys B. Measuring Diffusion-Limitation with a Perfusion-Limited Gas-Hyperpolarized 129Xe Gas-Transfer Spectroscopy in Patients with Idiopathic Pulmonary Fibrosis. J Appl Physiol. 2014; 117:577–585.
3. Ebner L, Kammerman J, Driehuys B, Schiebler ML, Cadman RV, Fain SB. The role of hyperpolarized 129xenon in MR imaging of pulmonary function. Eur J Radiol 2017; 86:343-352.
4. Kaushik SS, Robertson SH, Freeman MS, He M, Kelly KT, Roos JE, Rackley CR, Foster WM, McAdams HP, Driehuys B. Single-Breath Clinical Imaging of Hyperpolarized 129Xe in the Airspaces, Barrier and Red Blood Cells using an Interleaved 3D Radial 1-point Dixon Acquisition. Magn Reson Med. 2016; 75(4):1434-1443.
5. Kaushik SS, Freeman MS, Cleveland ZI, Davies J, Stiles J, Virgincar RS, Robertson SH, He M, Kelly KT, Foster WM, McAdams HP, Driehuys B. Probing the regional distribution of pulmonary gas exchange through single-breath gas- and dissolved-phase 129Xe MR imaging. J. Appl. Physiol. 2013; 115:850–860
6. Wang Z, Robertson SH, Wang J, He M, Virgincar RS, Schrank GM, Bier EA, Rajagopal S, Huang YC, O’Riordan TG, Rackley CR, McAdams HP, Driehuys B. Quantitative analysis of hyperpolarized 129Xe gas transfer MRI. Med Phys. 2017; 44(6):2415-2428.
Figures