4476
Quantifying Changes in Time-Resolved Hyperpolarized 129Xe Spectroscopy among Healthy Volunteers, Subjects with Idiopathic Pulmonary Fibrosis, and Subjects with Pulmonary Arterial Hypertension1Radiology, Duke University Medical Center, Durham, NC, United States, 2Cardiology, Duke University Medical Center, Durham, NC, United States
Synopsis
The temporal dynamics of 129Xe spectroscopy were examined by collecting FIDs during inhalation, breath-hold, and exhalation. These FIDs were fit to a Voigt model to extract four spectral parameters (amplitude, chemical shift, linewidth, and phase) for the airspace, barrier, and RBC 129Xe resonances. The RBC resonance parameters exhibited oscillations at the cardiac frequency which were quantified by peak-to-peak amplitudes. IPF subjects exhibited larger signal amplitude, chemical shift, and phase oscillations than healthy or PAH subjects. This indicates that 129Xe transfer spectroscopy is differentially affected by cardiopulmonary dynamics such that the causes of gas exchange impairment can be distinguished.
Purpose
The spectral parameters of 129Xe in airspaces, interstitial tissue, and red blood cells (RBCs) are sensitive to lung inflation and disease1. We sought to investigate how four spectral parameters (amplitude, chemical shift, linewidth, and phase) change during inhalation, breath-hold, and exhalation to identify signatures that distinguish healthy subjects from subjects with idiopathic fibrosis (IPF) or pulmonary arterial hypertension (PAH).Methods
129Xe spectra were dynamically acquired every 20ms in 14 healthy, 9 IPF, and 7 PAH subjects on a 1.5 GE 15M4 EXCITE and a 3T SIEMENS MAGNETOM Trio MRI scanner. Subjects inhaled, from FRC, a 1-L volume consisting of a 51mL dose equivalent of hyperpolarized 129Xe. During inhalation, breath-hold, and exhalation, 129Xe free induction decays (FIDS) were collected every 20ms (TE=0.932ms, flip angle≈20°, dwell time=32µs, 512/1024 points). The FIDs were pre-processed using the Spectral Improvement by Fourier Thresholding (SIFT) method2 and then fit using a Voigt model (Equation 1). Each resonance was characterized by 5 spectral parameters: amplitude ($$$a_n$$$), frequency ($$$f_n$$$), phase ($$$\phi_n$$$), and two distinct linewidth parameters — Lorentzian ($$$L_n$$$) and Gaussian ($$$G_n$$$).
$$ s_{fit}=\sum_{n=1}^{3}a_n e^{i \phi_k+2 \pi if_nt} e^{-\pi L_n t} e^{-8 ln2\times G_n^2 t^2}\;\;\;(1)$$
Only the barrier resonance was seeded with both Lorentzian and Gaussian fit parameters. Oscillations in the 129Xe-RBC spectral parameters occurring at the cardiac frequency (~1Hz) were characterized by their percentage change in peak-to-peak amplitude from baseline after correcting for apparent T1 decay during the breath-hold. Any additional slowly varying trends were removed by applying a high-pass filter with 0.5Hz cutoff frequency. The corrected and filtered parameters were then fit to a sinusoid of form:
$$Asin(2\pi f_ct+\phi)\;\;\;(2)$$
where $$$A$$$ is the amplitude, $$$f_c$$$ is the cardiac oscillation frequency, $$$t$$$ is time in seconds, and $$$\phi$$$ is a phase off-set. The cardiac frequency, $$$f_c$$$, was derived from each subject’s RBC amplitude oscillations, and was used as the frequency in the temporal fits of all other RBC spectral parameters (chemical shift, linewidth, and phase). The resulting peak-to-peak variations were then compared between groups using the one-way ANOVA, with post-hoc Tukey HSD test.
Results
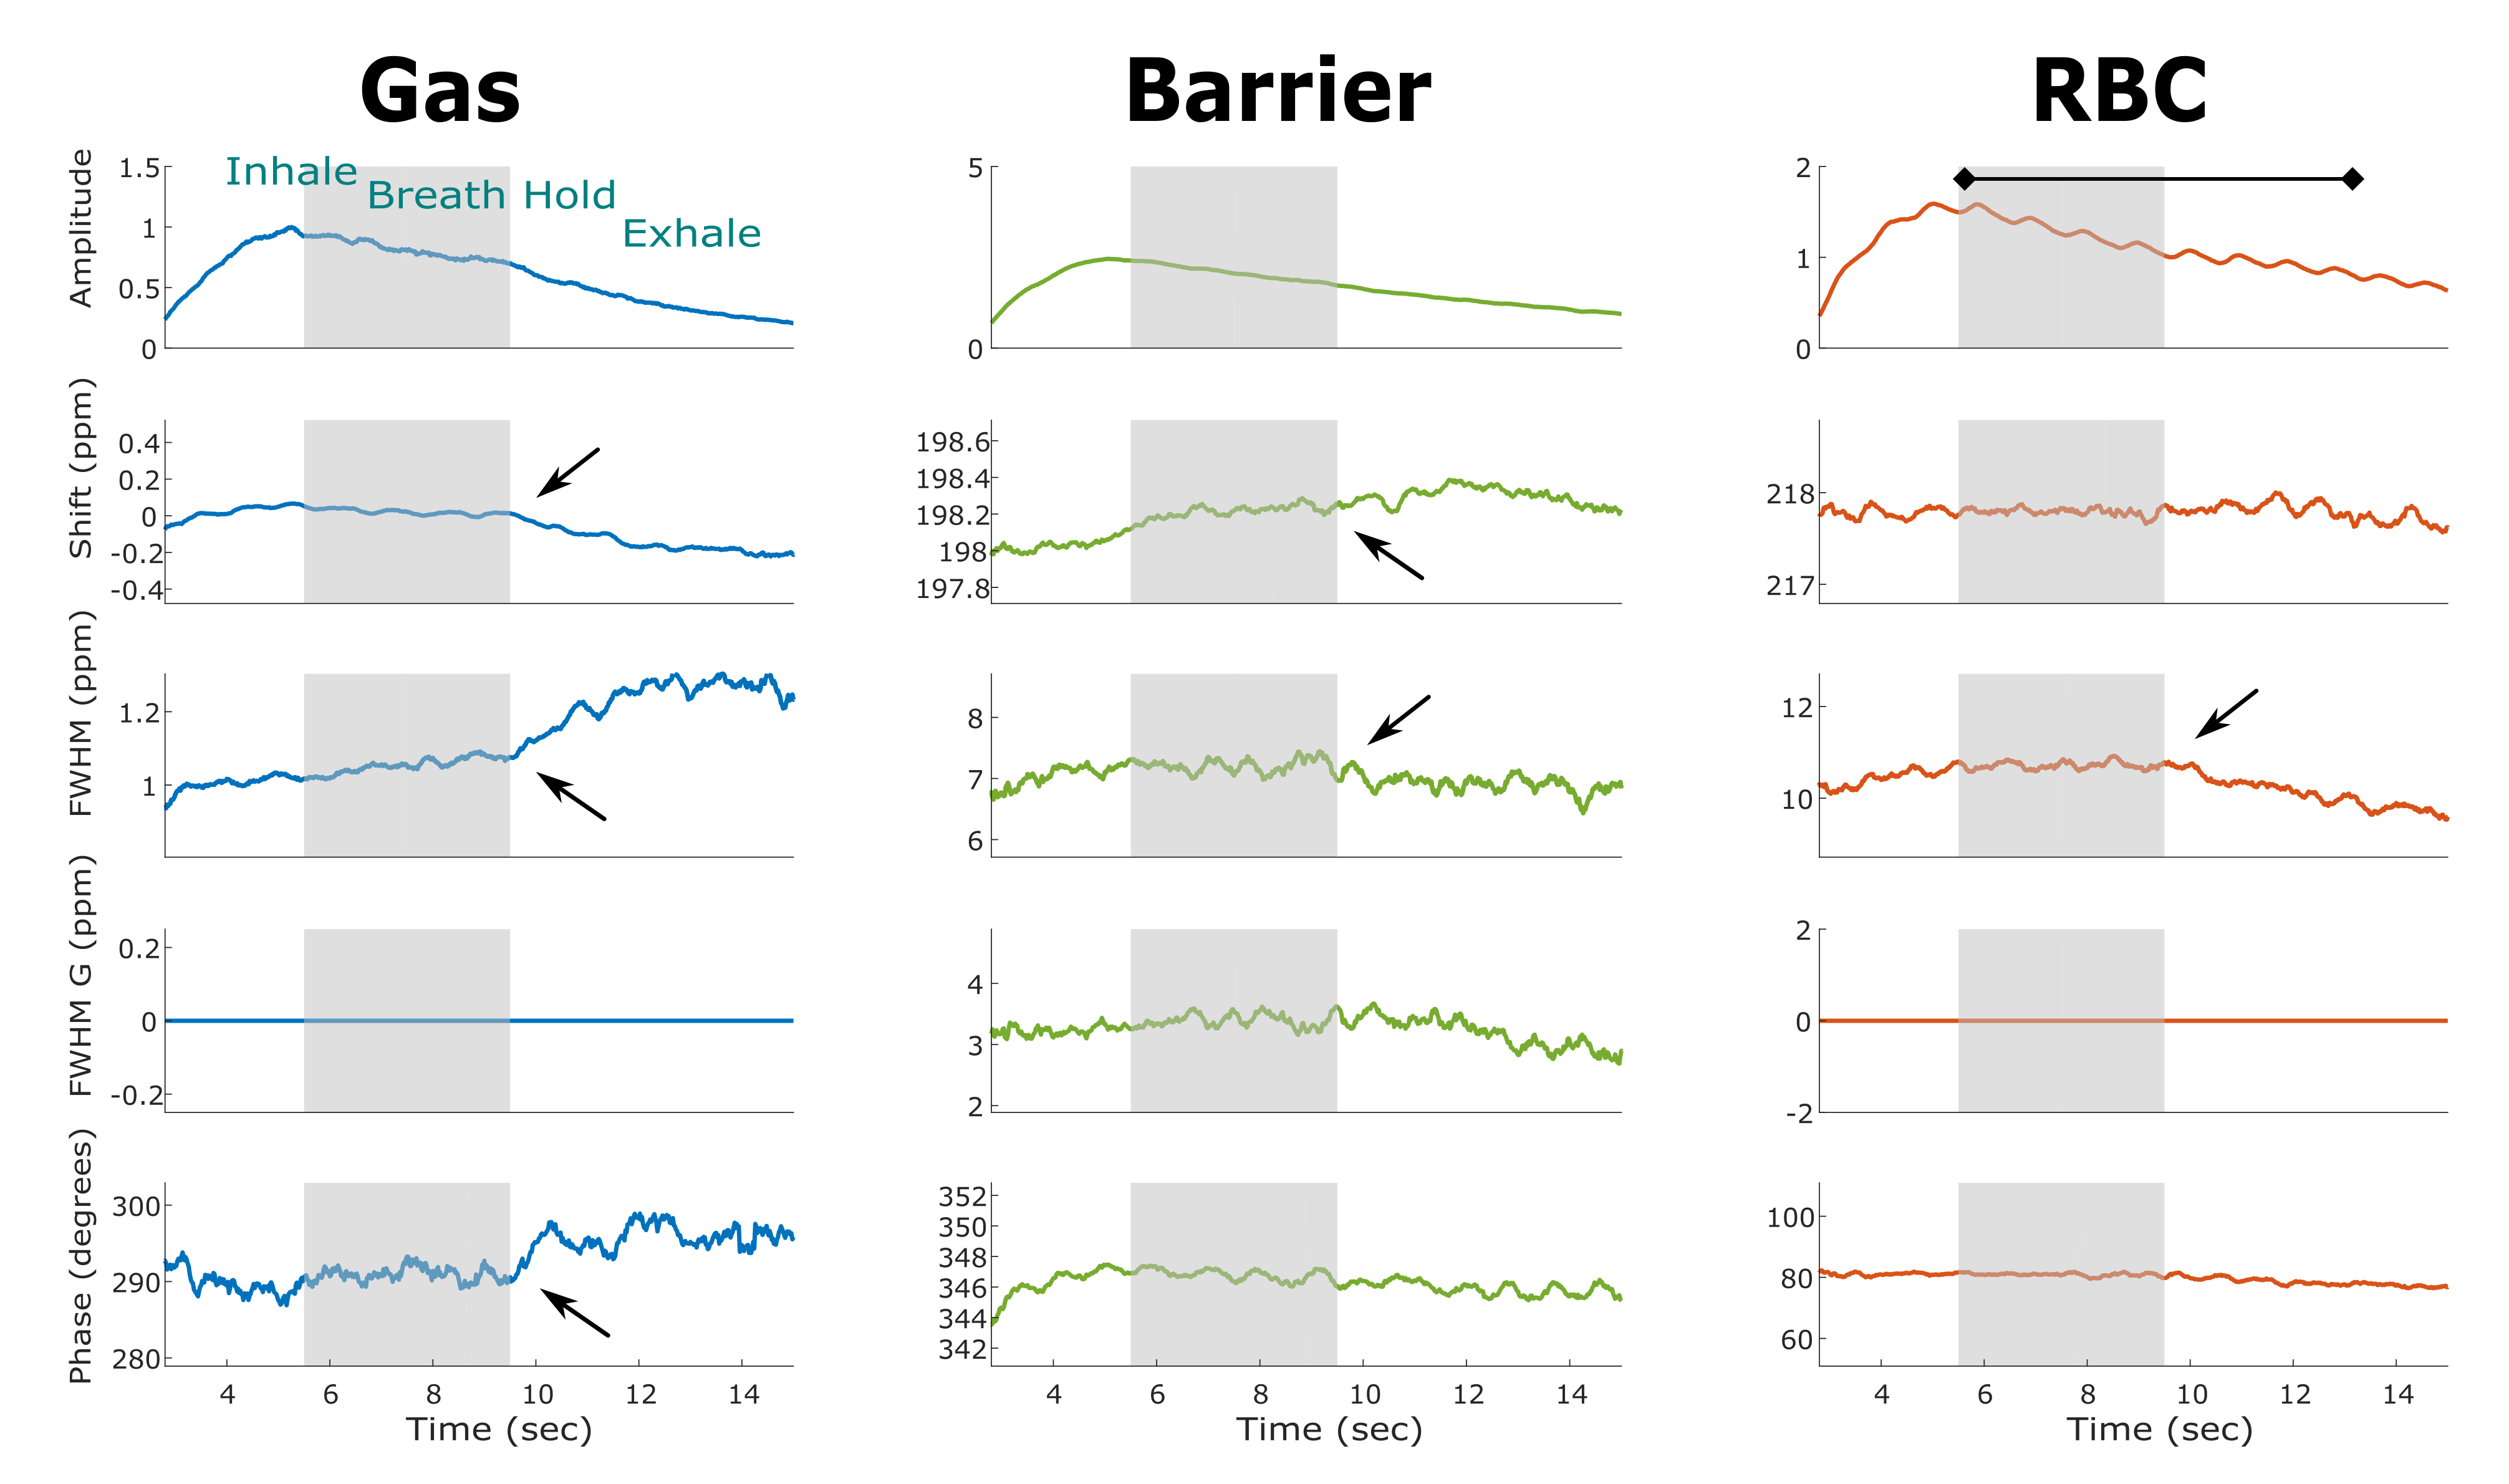
The changes in 129Xe spectroscopic parameters over time are displayed for a representative healthy volunteer in Figure 1. The breathing maneuver is reflected in 4 of the 5 fit parameters readily demarking the inhalation, breath-hold, and exhalation period by a change in the amplitude, chemical shift, Lorentzian linewidth, and phase. Upon exhalation, the gas resonance shifted negatively by 0.12ppm and broadened by 0.15ppm. These effects are also seen, albeit less strikingly, in the barrier and RBC resonances. The chemical shifts and linewidths of the two dissolved-phase peaks remains relatively constant, whereas the RBC amplitude exhibits a prominent periodicity at a frequency of 58 cycles per minute, which is consistent with the subject’s heart rate (63bpm).
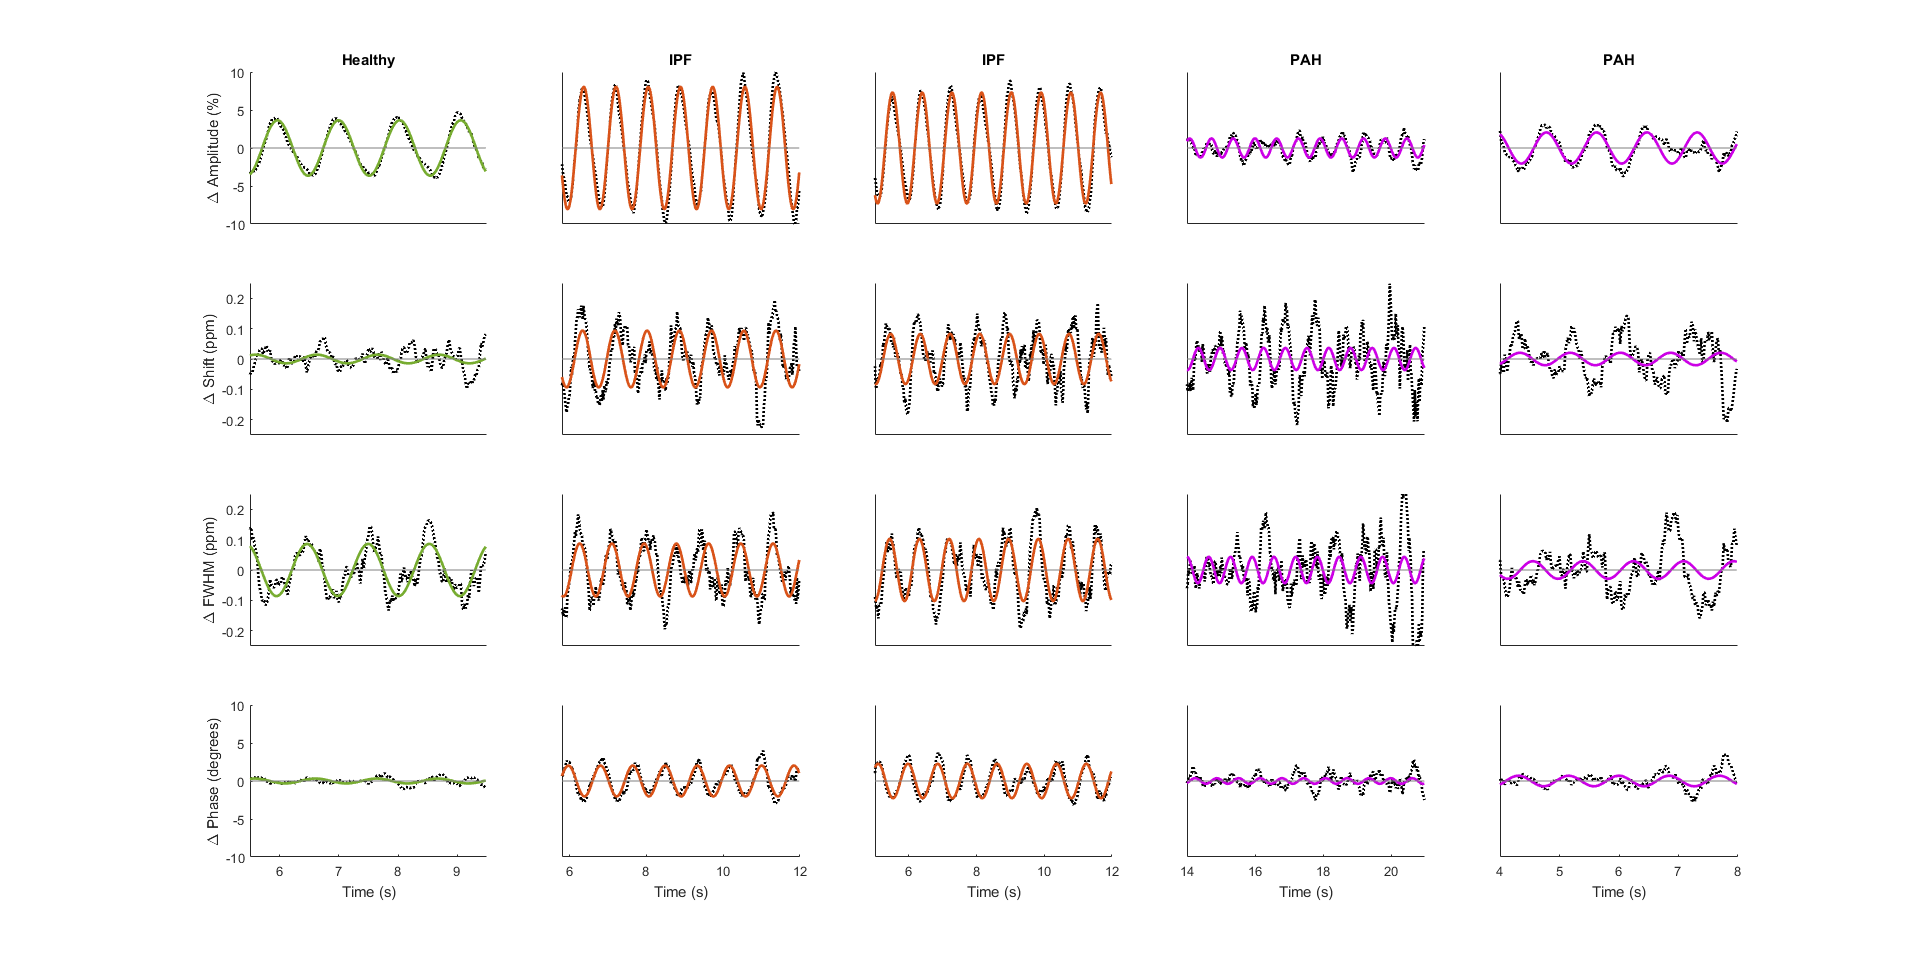
The normalized and detrended higher-frequency dynamics in the RBC resonance are shown for a representative healthy volunteer, two IPF subjects, and two PAH subjects in Figure 2. Notably, the subjects with IPF exhibit not only a large variation in the RBC signal, but also large periodic changes in RBC chemical shift and phase.
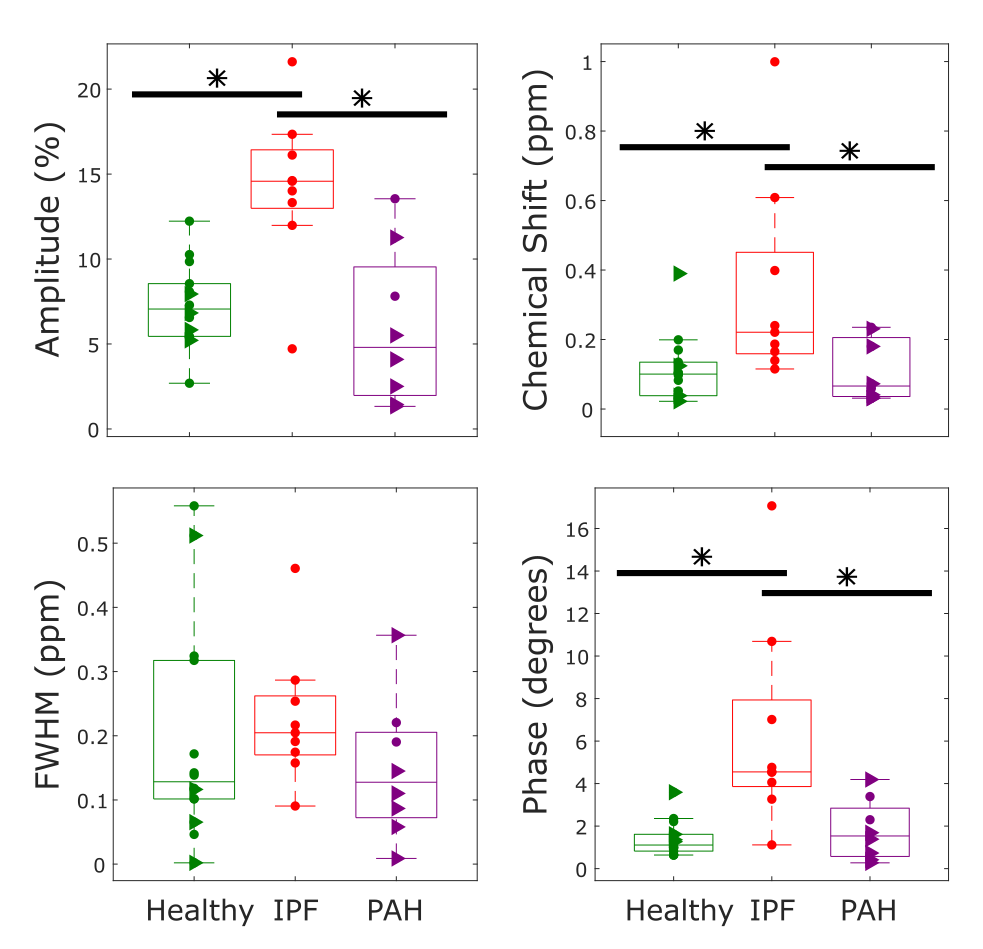
IPF subjects exhibited larger oscillations in the RBC signal, chemical shift, and phase than either healthy volunteers or PAH subjects (p=0.0004/0.002, p=0.01/0.02, p=0.0006/0.005) as shown in Figure 3. There was no statistically significant difference in the linewidth oscillations of the three cohorts (p=0.5).
Discussion
The temporal changes in the 129Xe spectra directly reflect the physiological dynamics of gas exchange in the pulmonary capillaries. While it is striking to find that nearly all of the spectral parameters reflect the breathing maneuver, exhalation is particularly well defined by an increasing gas-phase linewidth, combined with a corresponding narrowing of both dissolved-phase peaks. This suggests an improvement in local field inhomogeneities as the volume fraction of tissue relative to air increases.
The oscillations in the RBC signal amplitude indicate that the number of polarized 129Xe atoms interacting with the RBCs changes over the course of the cardiac cycle. In IPF these oscillations are nearly two-fold larger than in healthy volunteers, suggesting a larger relative change in capillary blood volume. Additionally, IPF subjects exhibit variations in their RBC chemical shift that are more than 3-fold larger than in volunteers or PAH subjects. The RBC frequency is known to depend non-linearly on blood oxygenation levels.3 Thus, the larger chemical shift variation in IPF may reflect delayed oxygen diffusion into deoxygenated blood that enters the capillary beds after systole.
These dynamic metrics provide insight into the temporal variability of pulmonary function and may prove useful in discriminating the different causes of gas exchange impairment.
Acknowledgements
NIH/NHLBI R01 HL105643, NIH/NHLBI R01HL126771, and HHSN268201700001CReferences
- Robertson, S.H., et al., Uncovering a third dissolved‐phase 129Xe resonance in the human lung: Quantifying spectroscopic features in healthy subjects and patients with idiopathic pulmonary fibrosis. Magnetic resonance in medicine, 2017. 78(4): p. 1306-1315.
- Doyle, M., et al., SIFT, a postprocessing method that increases the signal-to-noise ratio of spectra which vary in time. Journal of Magnetic Resonance, Series B, 1994. 103(2): p. 128-133.
- Norquay, G., et al., 129Xe chemical shift in human blood and pulmonary blood oxygenation measurement in humans using hyperpolarized 129Xe NMR. Magnetic resonance in medicine, 2017. 77(4): p. 1399-1408.
Figures