4475
Hyperpolarized 129Xe MR spectroscopy of the human lung in healthy volunteers and patients with chronic obstructive pulmonary disease (COPD): investigation of lung microstructure1Institute of Diagnostic and Interventional Radiology, Hannover Medical School, Hannover, Germany, 2Biomedical Research in Endstage and Obstructive Lung Disease Hannover (BREATH), German Center for Lung Research (DZL), Hannover, Germany, 3Department of Clinical Airway Research, Fraunhofer Institute for Toxicology and Experimental Medicine, Hannover, Germany
Synopsis
The NMR line shape in the lung parenchyma exhibits significant broadening due to numerous jumps in magnetic susceptibility. The purpose of this work was to extract this line shape from the 129Xe dissolved-phase spectrum. Free induction decays were acquired in healthy volunteers and COPD patients and a model function including two resonances and a superimposed frequency distribution was fitted to the time-domain data. Both second moment and skewness of the fitted frequency distribution were significantly elevated in COPD patients. The ratio of 129Xe in red blood cells and lung tissue was significantly reduced in COPD patients.
Introduction
Chronic obstructive pulmonary disease (COPD) involves a complex interaction of structural and functional abnormalities. The human lung possesses a complex, sponge-like microstructure with a large number of jumps in magnetic susceptibility leading to significant broadening of the NMR line shape, i.e. a microscopic Larmor frequency heterogeneity. It has previously been suggested to exploit this line shape for an assessment of lung microstructure using 1H MRI, but a clinical translation has not been achieved. The purpose of this work was to extract the parenchymal frequency distribution from hyperpolarized 129Xe dissolved-phase spectra in healthy volunteers and patients with COPD and compare results with model calculations [1].Methods
28 healthy volunteers (13 females, mean age 35.6 years) and 8 COPD patients (4 females, mean age 68.5 years) were included in this study approved by the institutional ethics review board. Imaging was performed at 1.5T (Avanto, Siemens) using a birdcage transmit and 16-channel phased-array receive coil (Rapid Biomedical). 129Xe hyperpolarization was achieved using a commercially available polarizer (Model 9800, Polarean).
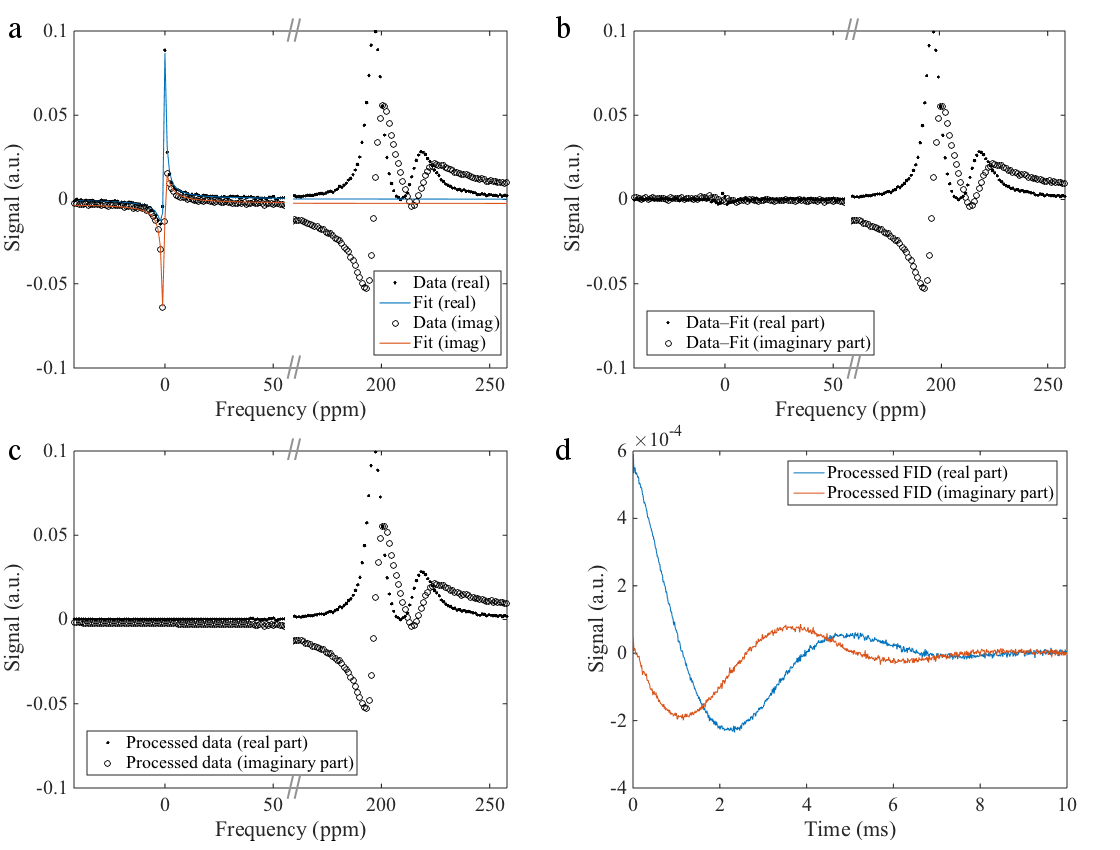
Subjects inhaled a gas mixture containing 1L hyperpolarized 129Xe and a variable air volume to achieve a breathing position of 1/3 of forced vital capacity. After irradiation of a large number of RF pulses on the 129Xe dissolved resonances, one free induction decay (FID) was acquired using a frequency-selective RF pulse with center frequency between the resonances of 129Xe dissolved in lung tissue/blood plasma (TP) and in red blood cells (RBC). A total of 5440 sample points were acquired at a dwell time of 10μs. Since gaseous 129Xe is substantially more abundant than RBC and TP in the lungs, even highly frequency-selective pulses yield contamination from the gas phase (GP), which was removed by data processing, see figure 1a–d.
The following model function was then fitted to the complex time-domain data,
$$S(t)=\left[B_{\mathrm{TP}}\mathrm{e}^{-\mathrm{i}(\omega_{\mathrm{TP}}t+\phi_{\mathrm{TP},0})}\mathrm{e}^{-R_{2,\mathrm{TP}}t}+B_{\mathrm{RBC}}\mathrm{e}^{-\mathrm{i}(\omega_\mathrm{RBC}t+\phi_{\mathrm{RBC},0})}\mathrm{e}^{-R_{2,\mathrm{RBC}}t}\right]V(t)$$
where
$$V(t)=\left[\mathrm{e}^{-\mathrm{i}\omega_1t}+C\mathrm{e}^{\mathrm{i}\omega_1t}\right]\mathrm{e}^{-R_V^2t^2}\frac{1}{1+C}$$
corresponding in frequency domain to two resonances with Lorentzian line shape convolved with a certain, identical frequency distribution (adapted from [2]). To compare the frequency distributions in healthy volunteers and COPD patients, their skew, second moment as well as ratios of RBC/TP signal were calculated for each data set.
Results
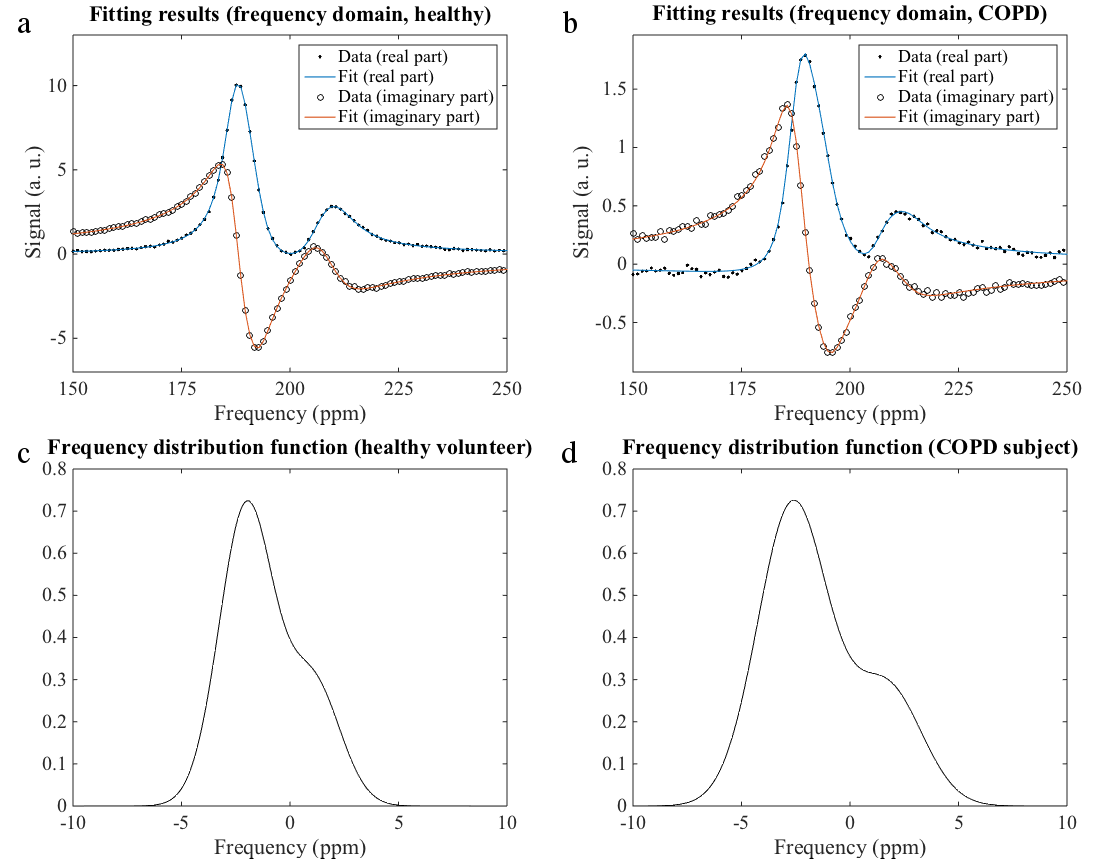
Figures 2a and b show exemplary spectra and fitting results for a healthy volunteer and a COPD patient in the frequency domain. The corresponding frequency distributions are provided in figures 2c and d.
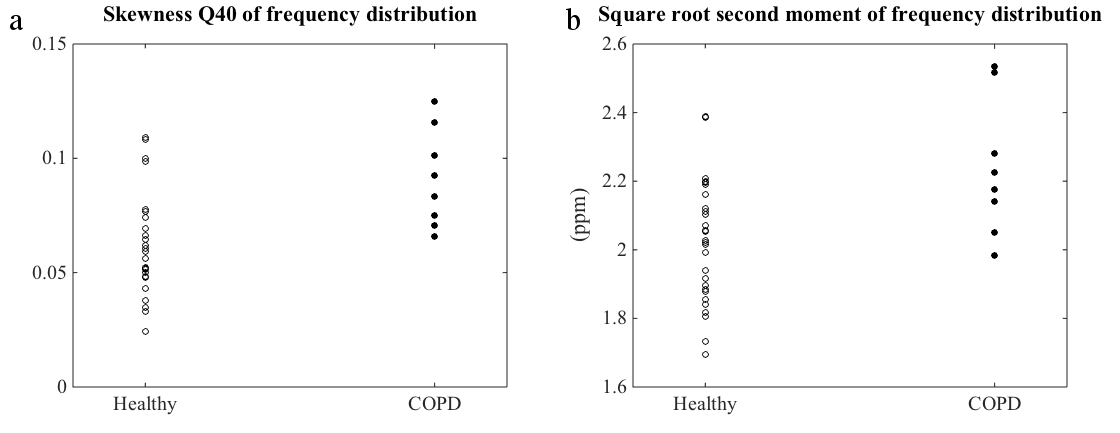
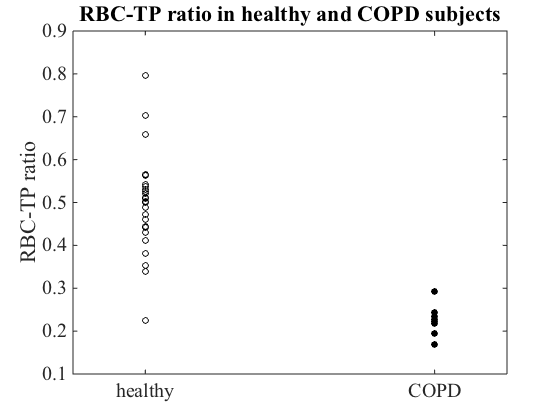
All frequency distribution functions had positive skewness (quantile coefficient Q40 of skewness). Skewness was significantly elevated in COPD subjects (two-sided Wilcoxon rank-sum test: p = 0.0082). Also the square root second moment was significantly elevated in COPD subjects compared to healthy volunteers (p = 0.0141), figure 3. The RBC-TP ratio was significantly decreased in COPD subjects (p = 4⋅10–5), figure 4.
Discussion
Since many RF pulses had been irradiated before the FIDs were acquired, the NMR signal can be expected to originate almost exclusively from parenchymal tissue with only small contributions from larger vessels. The frequency distribution model proposed in [2] was adapted in this work because the Lorentzian’s second moment is ill-defined. Both positive skewness and second moment of the determined frequency distributions are in accordance with previous findings [1]. In the Wigner–Seitz foam model described previously, higher skew and second moment correspond to a higher air fraction, which is a possible explanation for the differences found between healthy volunteers and COPD patients due to the emphysematous changes in lungs affected by COPD.
Using two Lorentzian line shapes to model spectra of 129Xe dissolved in the lung provides moderate fitting results. While in this work the extension of the fit model by assuming a frequency distribution of the two resonances due to local susceptibility changes improved the fitting, alternatively a third resonance in the 129Xe dissolved-phase spectrum of the human lungs was proposed [3]. It is also conceivable that regional variations in chemical shift of the RBC resonance due to different blood oxygenation have influence on the results of this study [4].
Also microstructural changes within the lung parenchyma itself can be assessed with this method. The decreased RBC-TP fraction in COPD patients may be interpreted as capillary loss or dysfunction in the lung parenchyma. As loss of capillaries is thought to occur in early COPD, RBC-TP fraction might be a sensitive marker for patient monitoring in the future [5,6].
Conclusion
The proposed model function for the 129Xe dissolved-phase spectrum in the human lung microstructure delivers results for the parenchymal frequency distribution, which are in accordance with previous numerical predictions and measurements from 1H NMR. The model is sensitive for pathologic alterations of the lung parenchyma and microvasculature in COPD patients.Acknowledgements
This research was funded by the German Center for Lung Research (DZL).References
[1] Christman et al., Magn Reson Med 1996;35:6–13
[2] Mulkern et al., Concepts Magn Reson Part A Bridg Edc Res. 2014;43A:29–53
[3] Robertson et al., Magn Reson Med 2017;78:1306–1315
[4] Wolber et al., Magn Reson Med 2000;43:491–496
[5] Ferrer et al., Eur Repir J 2011;38:617–627
[6] Hueper et al., Am J Respir Crit Care Med 2015;192:570–580
Figures