4474
Voxel-based mapping of lung microstructural parameters using hyperpolarized 129Xe dissolved-phase imaging in healthy volunteers and chronic obstructive pulmonary disease patients1Institute of Diagnostic and Interventional Radiology, Hannover Medical School, Hannover, Germany, 2Biomedical Research in Endstage and Obstructive Lung Disease Hannover (BREATH), German Center for Lung Research (DZL), Hannover, Germany, 3Department of Clinical Airway Research, Fraunhofer Institute for Toxicology and Experimental Medicine, Hannover, Germany
Synopsis
Chemical shift saturation recovery (CSSR) spectroscopy is a method, which is able to assess lung microstructure using 129Xe gas uptake and to discriminate between healthy volunteers and chronic obstructive pulmonary disease (COPD) patients. However, the absent spatial encoding of standard CSSR spectroscopy poses a limitation of the method for detecting early disease. A method for voxel-based mapping of lung microstructural parameters is proposed. Preliminary data from a study in healthy volunteers and COPD patients employing both CSSR mapping and spectroscopy are presented. Whole-lung median wall thickness and surface-to-volume ratio are highly reproducible and correlate significantly with global values from spectroscopy in COPD patients.
Introduction
Lung diseases like chronic obstructive pulmonary disease (COPD) manifest themselves by local deterioration of lung function and pathologic alterations of lung microstructure. The chemical shift saturation recovery (CSSR) MR spectroscopy sequence in combination with models of 129Xe uptake in the lung has been shown to be sensitive for these alterations. However, the lacking spatial encoding of CSSR poses a limitation on the technique in detecting early disease, and efforts have been made to solve this problem [1–4]. The purpose of this work was to test the feasibility of local mapping of lung microstructural parameters in healthy volunteers and to assess its reproducibility and compare the results to those obtained from standard CSSR spectroscopy in COPD patients with GOLD stage 2.Methods
Four healthy volunteers and seven COPD patients were included in this study approved by the institutional review board. The COPD patients underwent the same MR examination twice within one week for assessment of reproducibility of microstructural parameters. Imaging was performed at 1.5T (Avanto, Siemens) using a birdcage transmit and 16-channel phased-array receive coil (Rapid Biomedical). Hyperpolarization of 129Xe was achieved using a commercially available polarizer (Model 9800, Polarean).
For COPD patients, the MR protocol included one breathhold scan with the CSSR spectroscopy sequence and one breathhold scan with the proposed CSSR mapping sequence. For CSSR spectroscopy, subjects inhaled 0.5L of hyperpolarized 129Xe and room air to achieve a breathing position of total lung capacity. For CSSR mapping, subjects inhaled 1L of hyperpolarized 129Xe and a variable amount of air to achieve a breathing position of 1/3 forced vital capacity. Healthy volunteers had only one CSSR mapping scan.
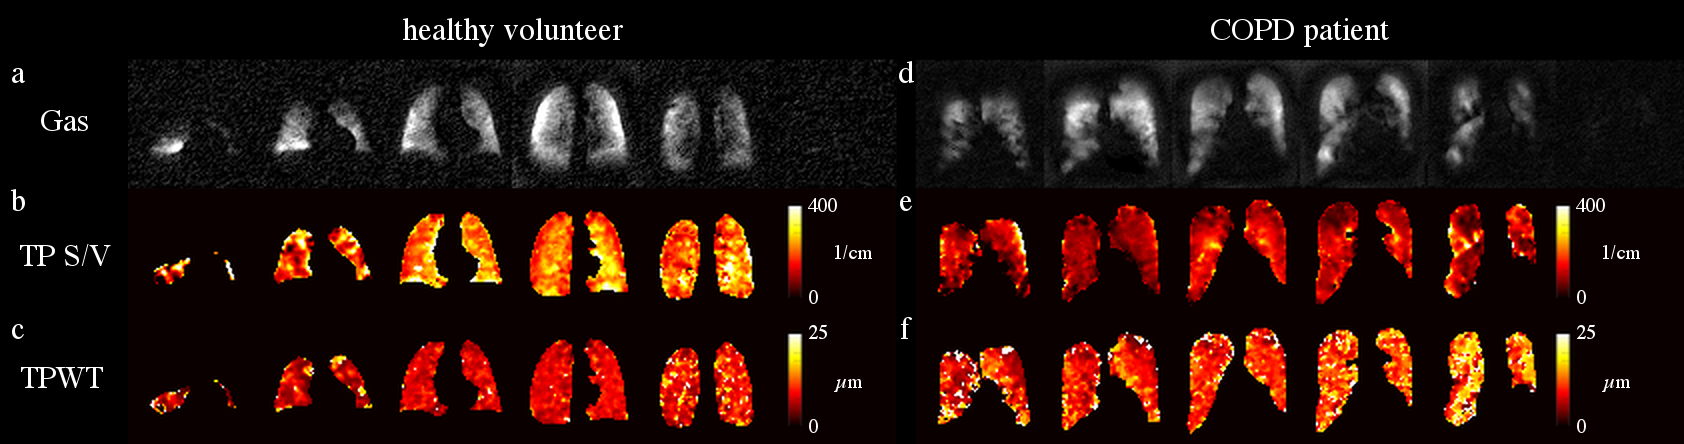
The CSSR mapping sequence featured rectangular RF pulses and spoiler gradients for saturation of the dissolved phase (DP) and a frequency-selective RF pulse for excitation of DP 129Xe only at a flip angle of 11.5°. Excitation and signal readout were performed at delay times between 4 and 194ms and between 9 and 59ms, both with an increment of 10ms, without new interleaved saturation pulses. The sequence further featured low-flip-angle excitations of gas-phase (GP) 129Xe for determination of coil sensitivities and determination of DP-GP ratio maps. A separation of dissolved 129Xe signals into signal originating from red blood cells (RBC) and tissue/plasma (TP) was achieved using 1-point Dixon separation. The k-space for DP reconstruction was highly undersampled, using projections at a golden-angle ratio in a stack-of-stars trajectory for different delay times. Low-rank-plus-sparse matrix decomposition [5] was used for reconstruction of DP images. Reconstructed matrix size was 64×64×6 at a field of view of 350mm×350mm×240mm, measurement time was ~17s. The Patz model was then used to extract lung microstructural parameters from gas uptake to TP [6].
Results
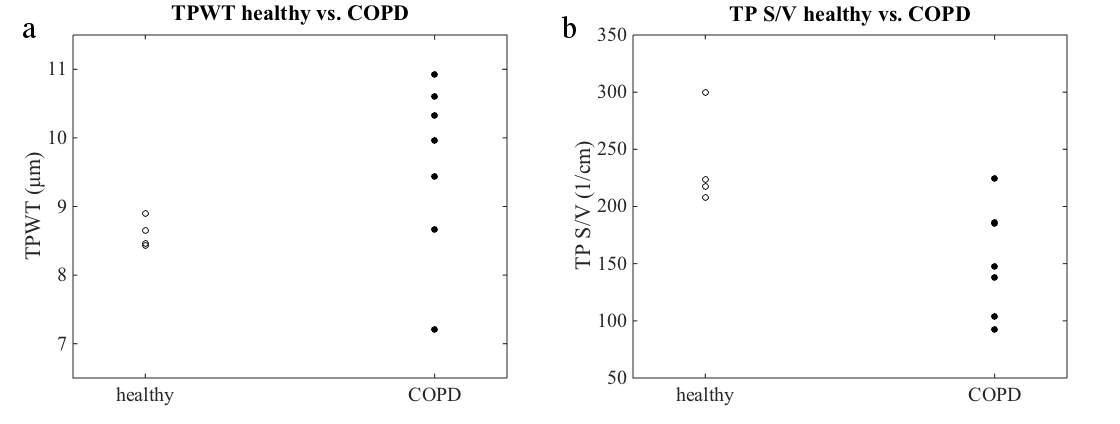
Figure 1 shows exemplary maps of the wall thickness parameter (TPWT) obtained in a healthy volunteer and in one of the COPD patients. In healthy volunteers, a gradient of wall thickness in A-P direction is apparent. The median surface-to-volume (S/V) ratio was significantly reduced in COPD patients compared to healthy volunteers (scan 2 data, two-sided Wilcoxon rank-sum test, p = 0.042). There also was a trend for elevated median wall thickness parameters in COPD patients, although this was not significant (scan 2 data, p = 0.109), figure 2. Both the median wall thickness and surface-to-volume ratio as obtained by CSSR mapping correlated significantly with global CSSR measurements in COPD patients, see figure 3. Comparing results from both study days, the median wall thickness and surface-to-volume ratio as obtained from CSSR mapping and corresponding CSSR spectroscopy measurements had similar coefficients of variation (COV) (mean COV for TPWT, mapping/spectroscopy: 6.62%/9.35%; for TP S/V, mapping/spectroscopy: 8.07%/8.98%).Discussion
Compared to spectroscopic measurements, the proposed technique has the substantial advantage of spatial localization, which makes it a promising candidate for the detection of early disease. The gradient in wall thickness has been described previously [1] and is likely due to gravitational effects in the supine position of the subject. The decreased surface-to-volume ratio in COPD patients is likely due to emphysematous changes of lung microstructure. The strong correlations of results from CSSR spectroscopy and CSSR mapping justify the approximation that the dissolved-phase signal evolution can very well be investigated using small flip-angle excitations, see also figure 4. The reproducibility of the Patz model parameters is comparable to that of CSSR spectroscopy.Conclusion
The proposed CSSR mapping technique is sensitive for microstructural changes associated with COPD and results correlate strongly with those from the previously described CSSR spectroscopy sequence. Given the spatial resolution of the fully quantified microstructural parameters, the proposed technique is a promising candidate for detection of early disease.Acknowledgements
This research was funded by the German Center for Lung Research (DZL).References
[1] Dregely et al., J Magn Reson Imaging 2011;33:1052–1062
[2] Doganay et al., Med Phys 2016;43:2410–2420
[3] Zanette et al., Proc Intl Soc Magn Reson Med 2017;1184
[4] Kern et al., Proc Intl Soc Magn Reson Med 2017;4917
[5] Otazo et al., Magn Reson Med 2015;73:1125–1136
[6] Patz et al., New J Phys 2011;13:015009
Figures