4473
The Effect of Signal to Noise Ratio on Linear-binning and Adaptive k-means Quantification of Hyperpolarized 129Xe Ventilation MRI1Department of Electrical and Computer Engineering, Duke University, Durham, NC, United States, 2Biomedical Engineering Department, Duke University, Durham, NC, United States, 3Department of Medical Physics, University of Wisconsin-Madison, Madison, WI, United States, 4Department of Medical Physics, Duke University, Durham, NC, United States, 5Department of Biomedical Engineering, University of Wisconsin-Madison, Madison, WI, United States, 6Department of Radiology, University of Wisconsin-Madison, Madison, WI, United States, 7Department of Biomedical Engineering, Duke University, Durham, NC, United States, 8Department of Radiology, Duke University, Durham, NC, United States
Synopsis
129Xe ventilation MRI lacks a reference standard. Here, we circumvent this problem in part by comparing and evaluating the robustness of two independent methods for quantifying ventilation – linear-binning and adaptive k-means - by adding MR noise to the source images until the algorithms fail. Results at different noise levels were compared to that quantified using the original high signal-to-noise ratio (SNR) ventilation image. We found that both methods provide robust quantification until SNR is less than 1.7 ± 0.8 for the linear-binning method, and 2.1 ± 1.2 for the uncorrected adaptive k-means method.
Introduction
Quantification and visualization of hyperpolarized 129Xe MRI are critical to its accurate use in diagnosis and monitoring. To date, numerous such methods have been developed and published, with most focusing on the well-known ventilation defect percentage (VDP)1-3. More recently, this has been extended to quantify the entire ventilation distribution, including metrics of heterogeneity and skewness4-6. One challenge in evaluating the performance of these methods is the lack of a gold standard against which to test the veracity of their derived metrics. Here we propose an approach that overcomes the lack of gold standard, by instead testing the robustness of methods against decreasing SNR. We thus seek to use the original high-SNR image as a surrogate gold standard, and test the degree to which methods remain robust as image noise is amplified and SNR degrades. In this initial work, we compare two common techniques - linear-binning and adaptive k-means segmentation. Our objective was to identify the SNR threshold at which the resulting quantification deviated significantly from the high-SNR reference and whether one method was appreciably more robust against diminished SNR than another.Methods
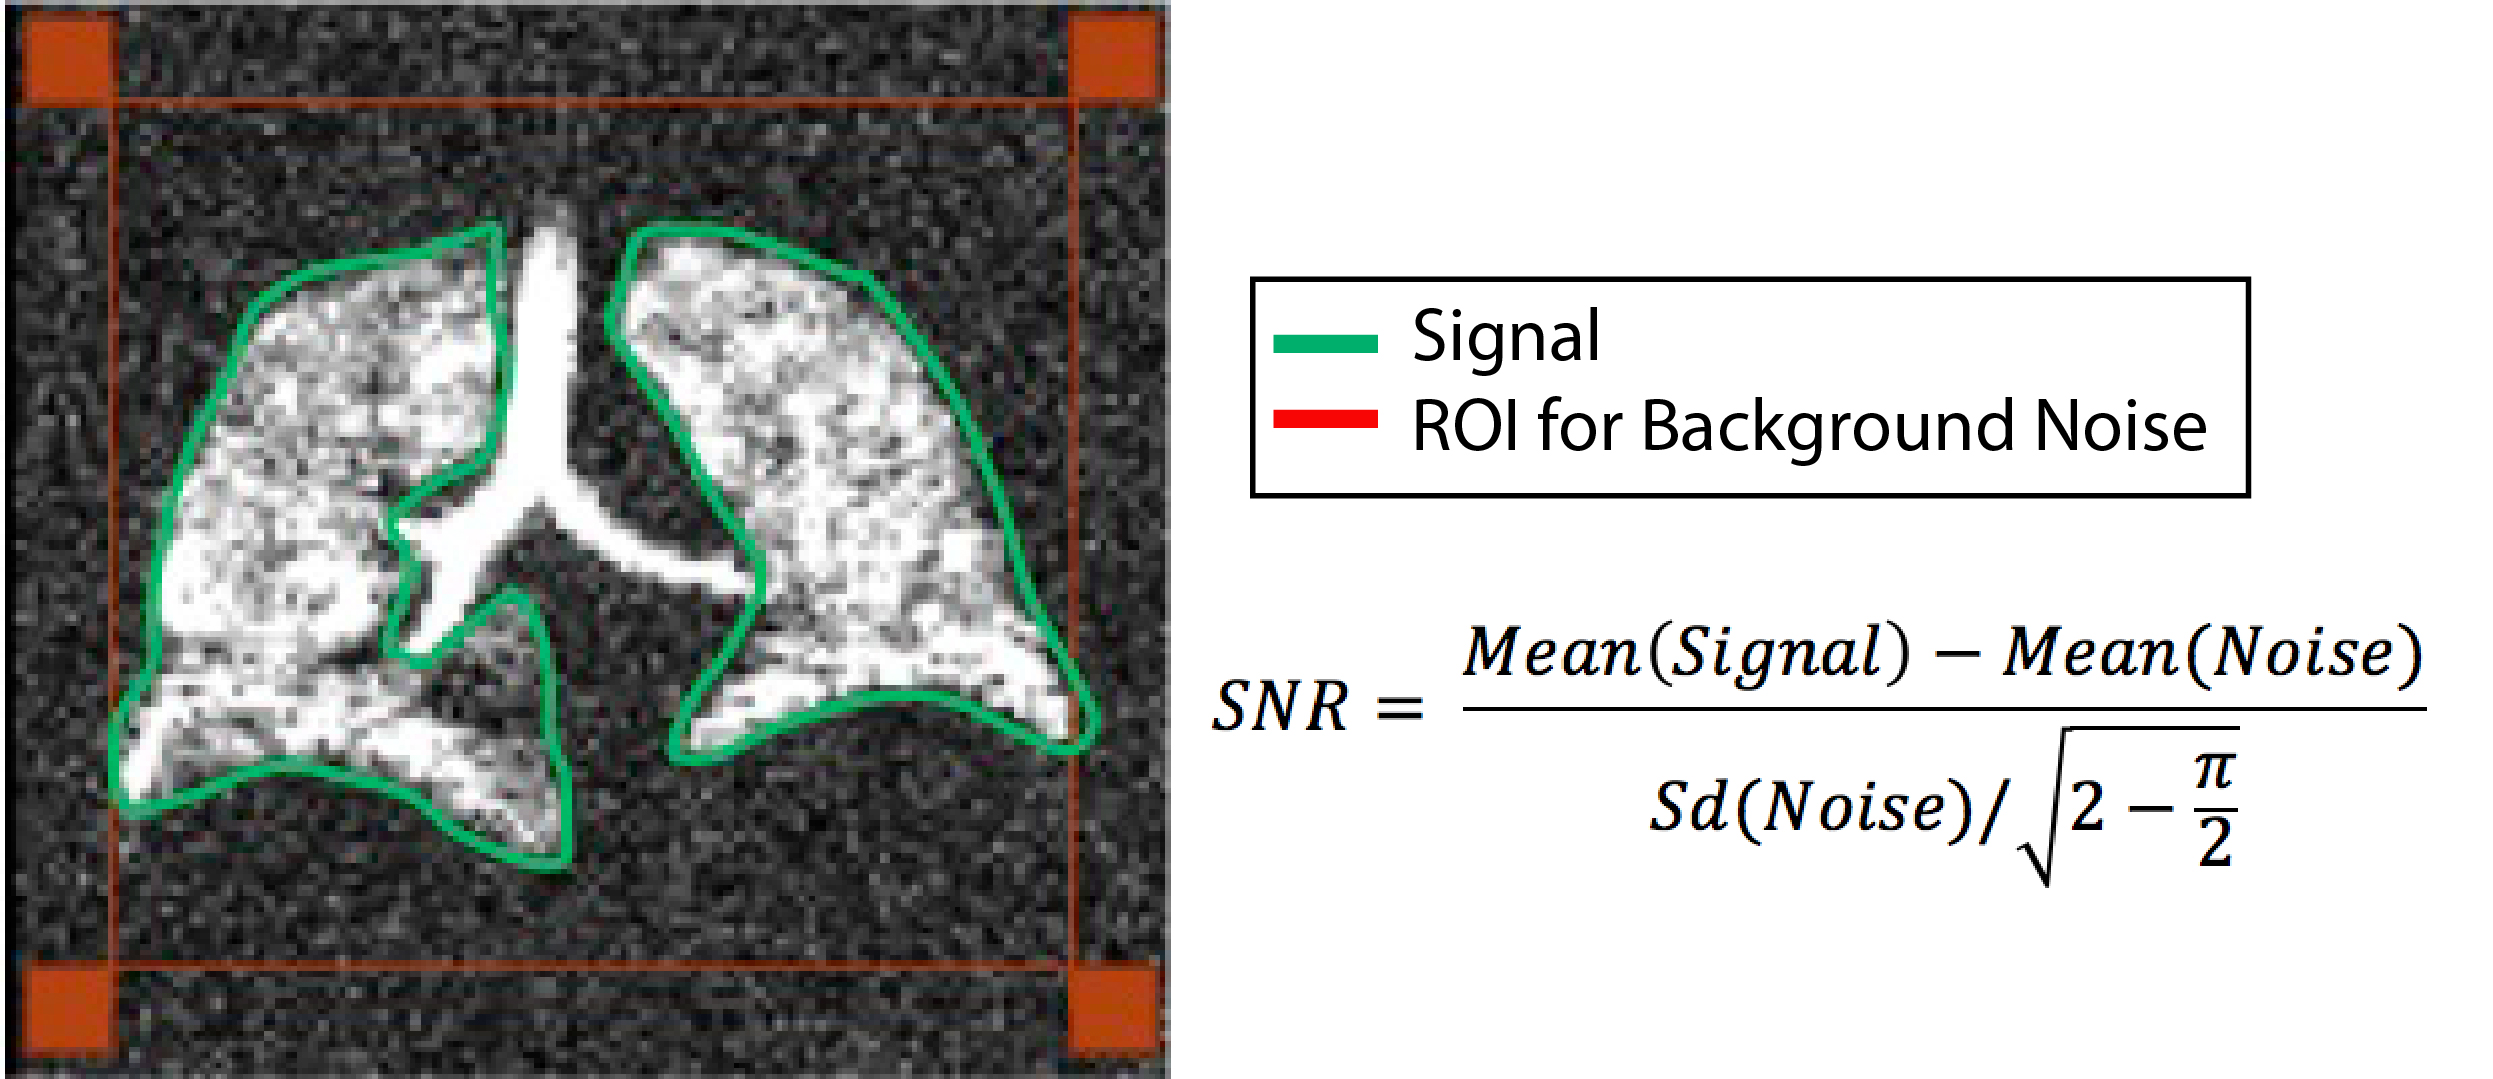
19 asthma subjects (age: 45.1±20.4 years) were retrospectively identified for analysis. All had previously undergone hyperpolarized (HP) 129Xe at 1.5 Tesla7 using a 2D multi-slice GRE sequence with 3x3x12.5 mm resolution. SNR was calculated using signal within the thoracic cavity mask and noise from 4 ROIs (Figure 1), corrected to account for its Rician distribution. From each dataset 7 variants were generated, with progressively lower SNR. This was done by synthesizing complex Gaussian noise with zero mean with 7 different standard deviations. The noise sets were created in the frequency domain and then Fermi filtered identically to the original image reconstruction (radius 64, width 10 matrix units) and inverse Fourier transformed to the image domain. The resulting 7 complex image sets were then added to the original magnitude image to create complex noise-enhanced images and converted to magnitude images for analysis. All images were then analyzed using both the linear binning8 and the adaptive k-means9 methods that quantified each image into four clusters of similar signal intensities. The noise-amplified VDP was then compared for deviation from its to the corresponding original high-SNR dataset. Note that to objectively compare the two methods, an erosion-dilation denoising step that is typically included in adaptive k-means analysis9 was omitted. Each method was characterized by the SNR level at which they were deemed to “fail.” Failure was defined as the SNR at which the reported VDP deviated from that of the original image by >1.8%. This threshold represents the reported VDP standard deviation for a healthy reference cohort8.Results
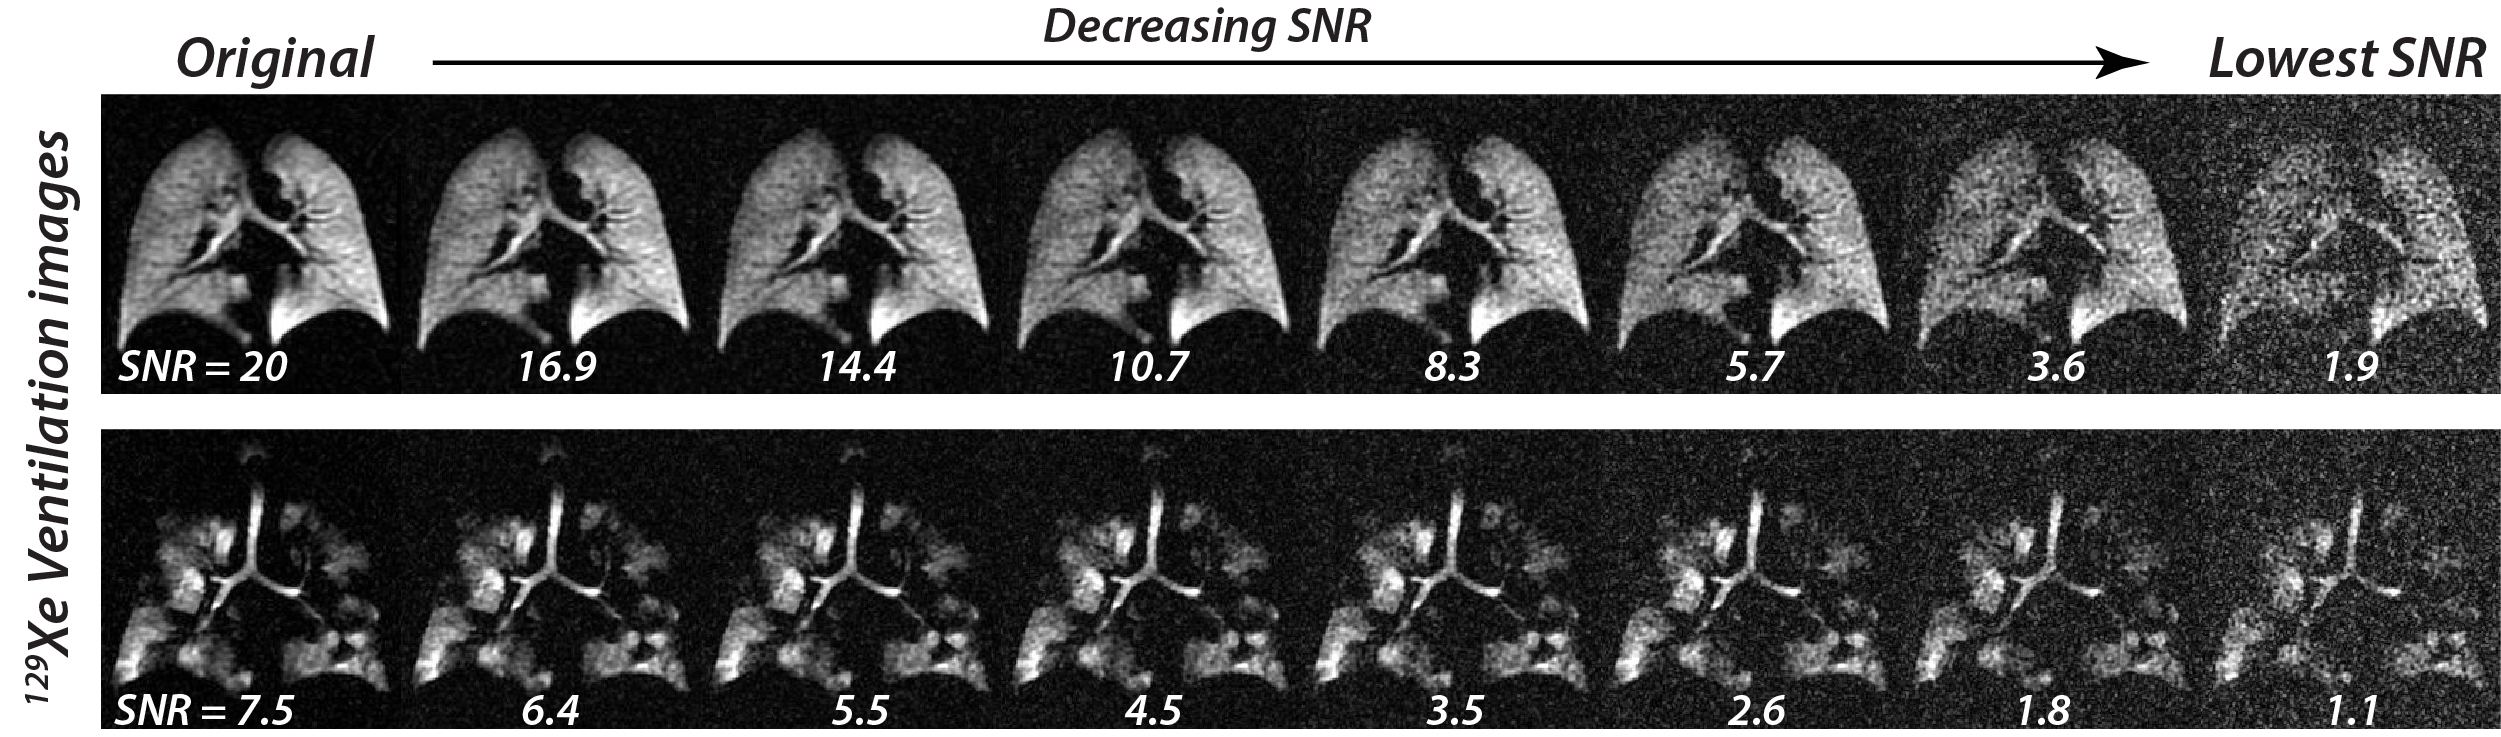
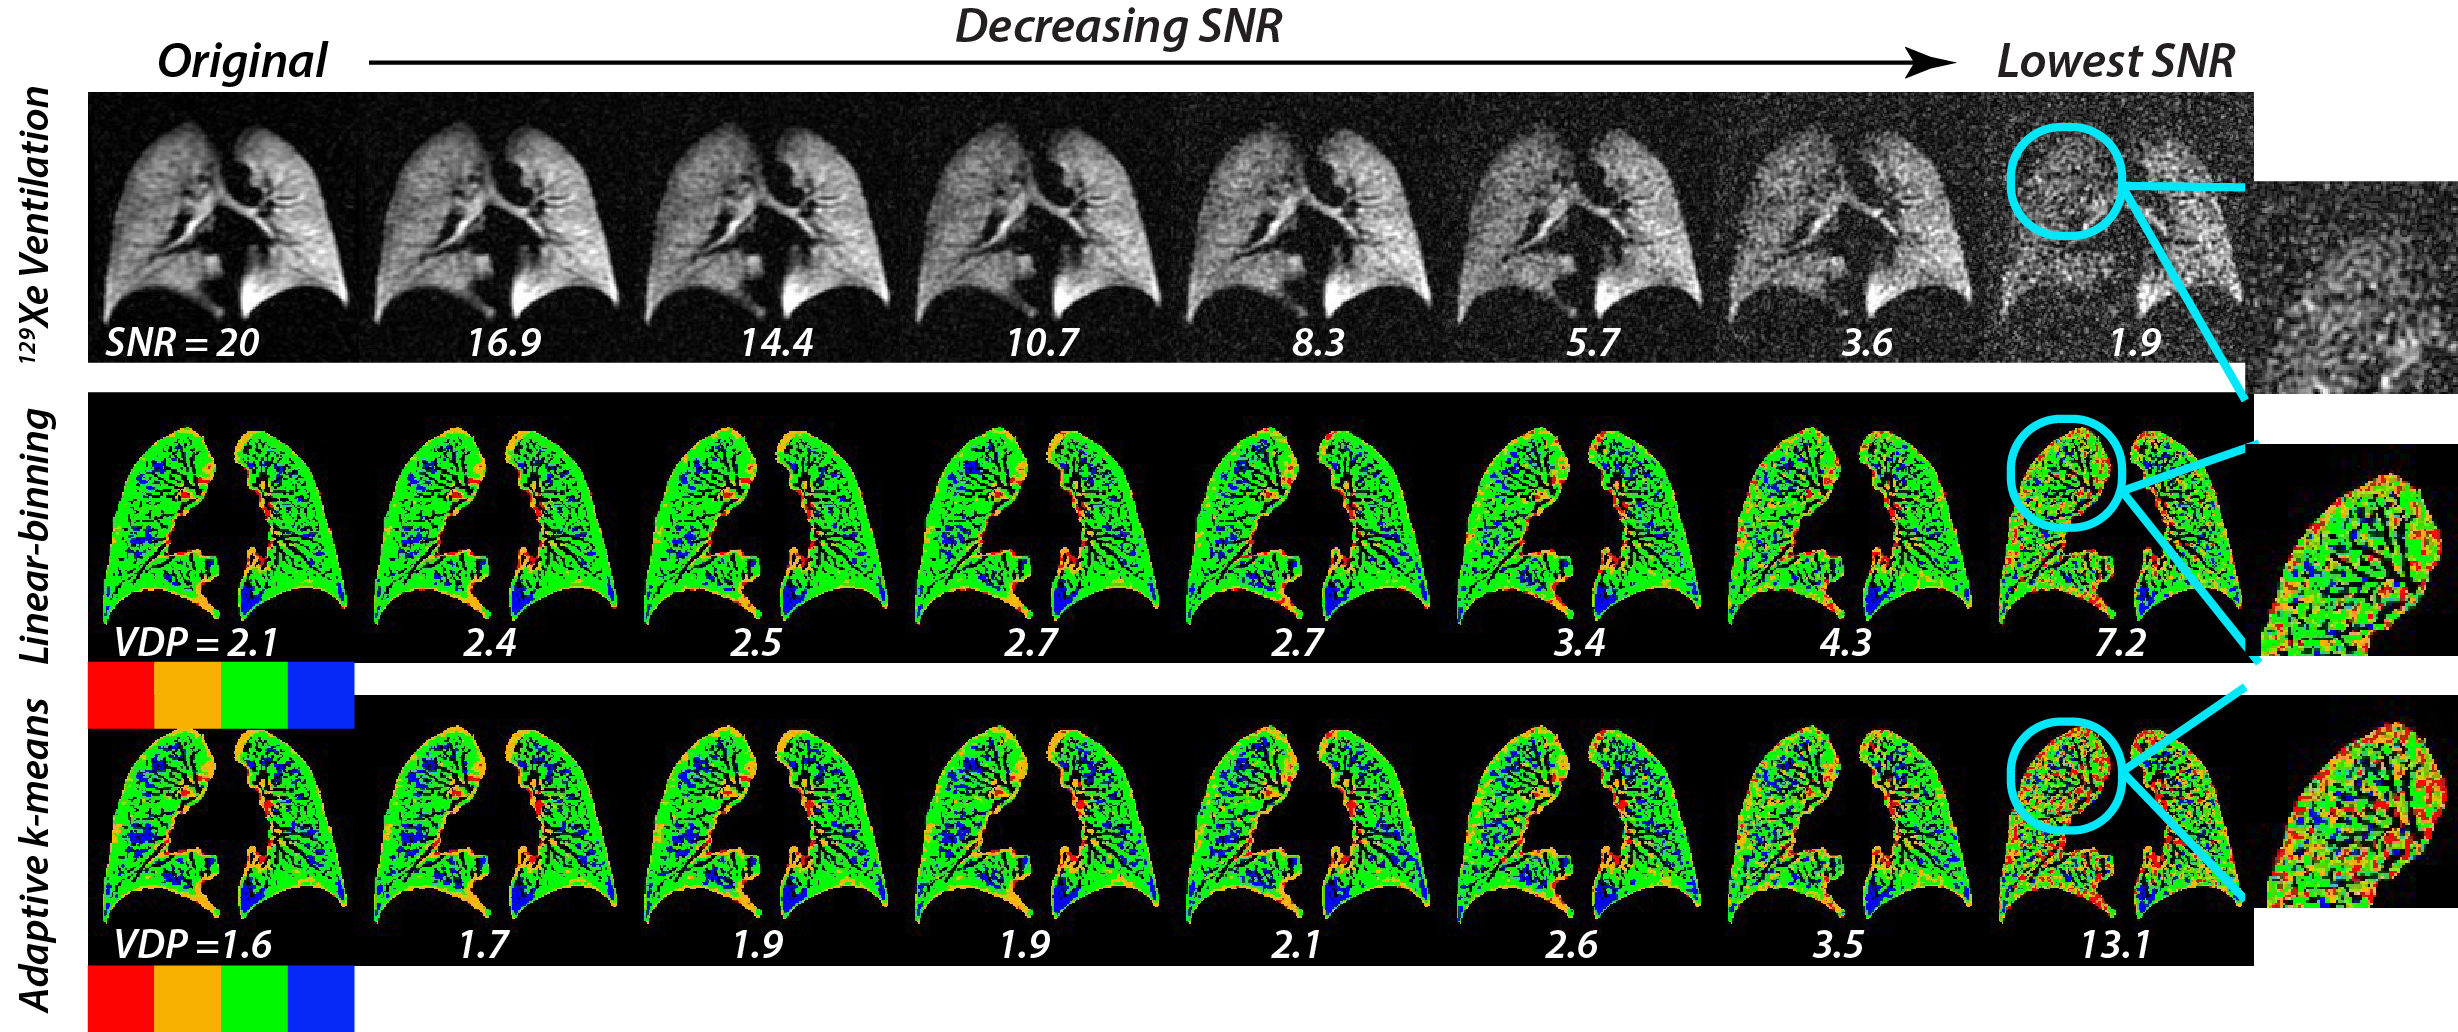
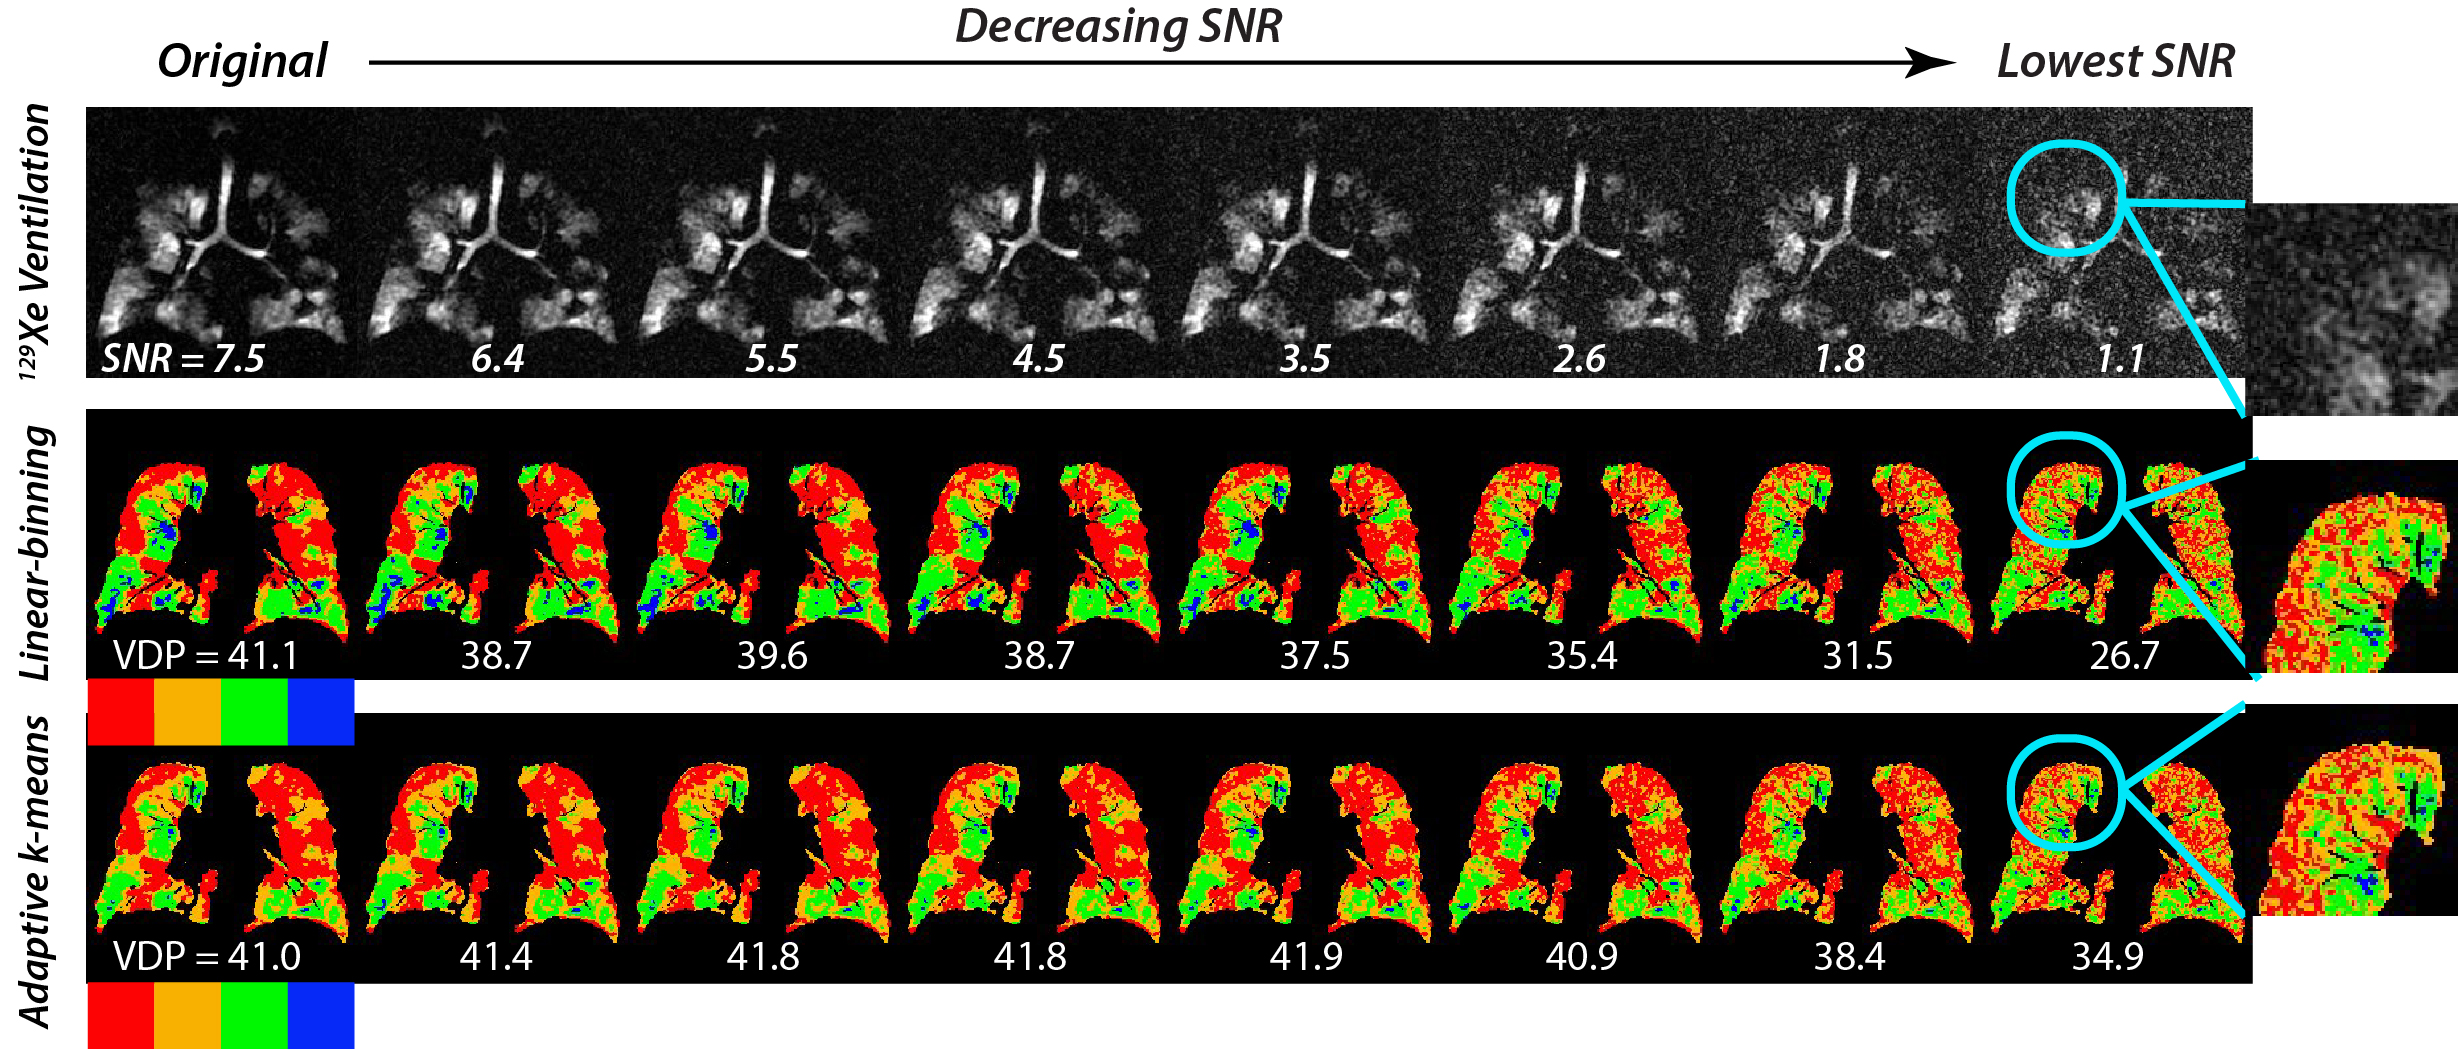
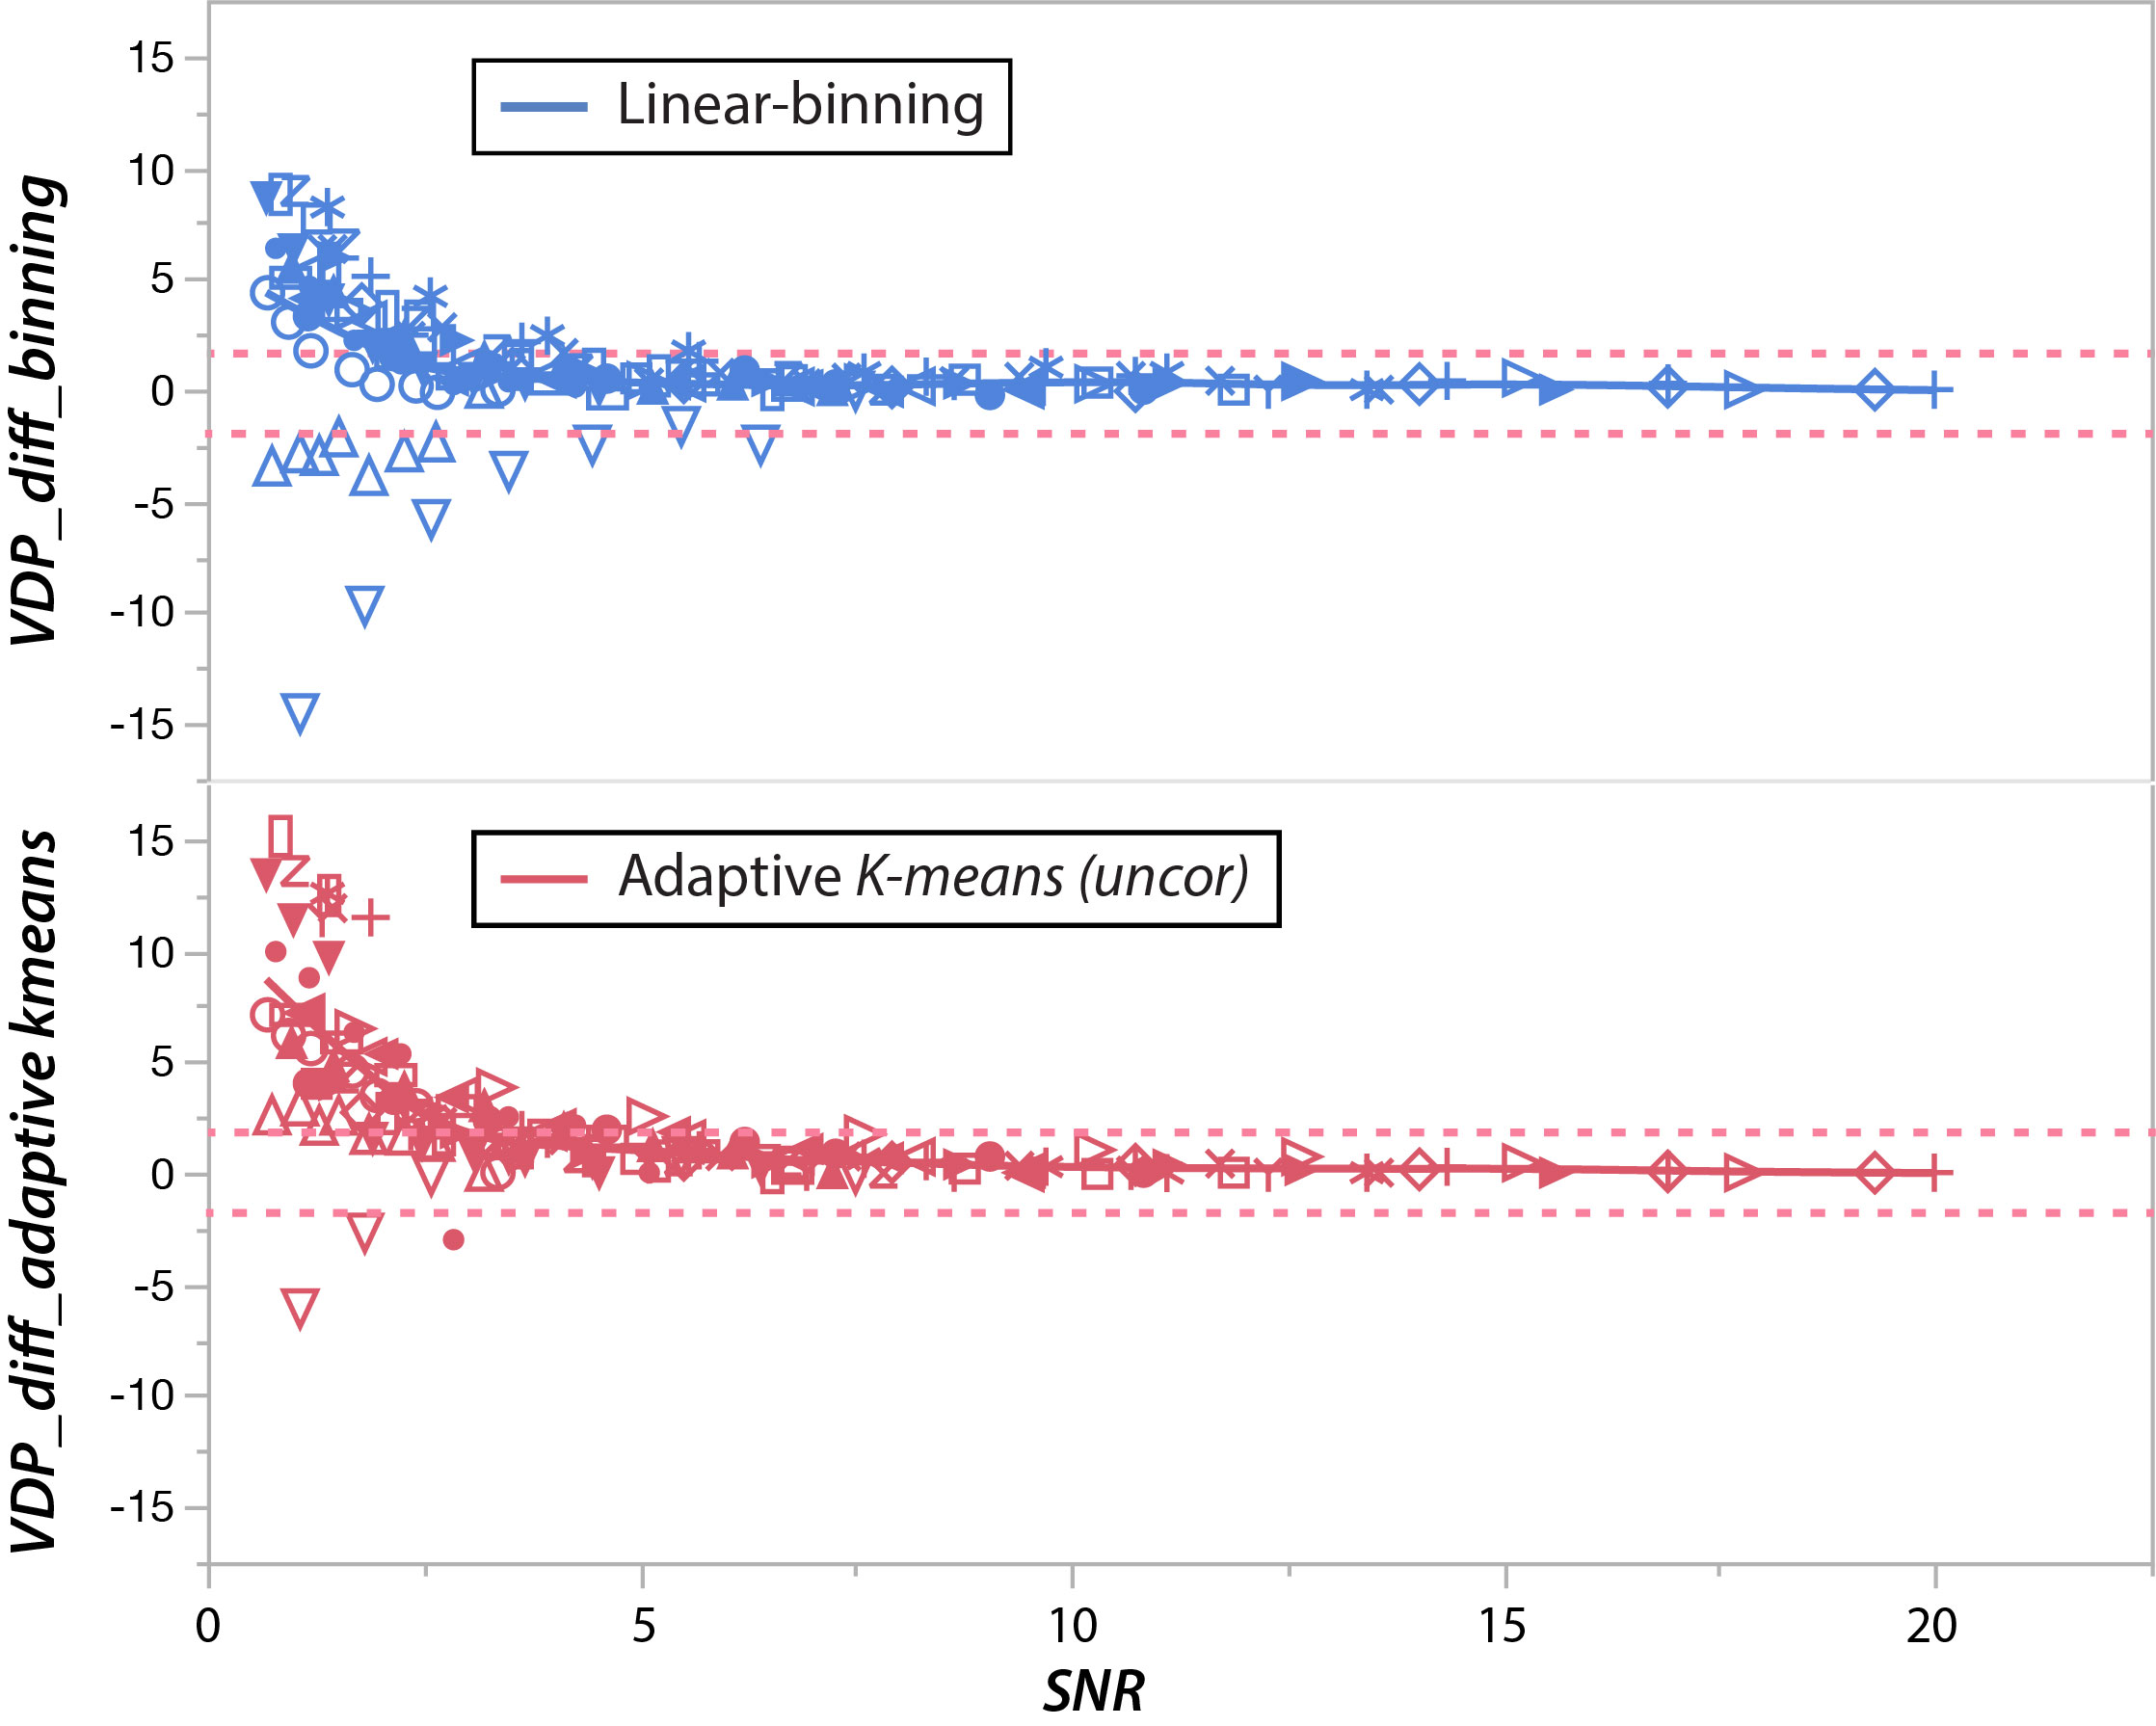
Figure 2 shows the evenly spaced SNR degradation for two representative subjects, one with normal ventilation and one with significant defects. The resulting VDP for the well-ventilated subject is shown in Figure 3 for both linear binning and adaptive k-means. Both methods show relatively similar and stable VDP at high SNR that slowly becomes larger as SNR decreases. Below an SNR of 4, both methods begin reporting significantly increased VDP. Similar analysis is shown in Figure 4 for the subject with high starting VDP. In this case, the increasing noise causes some defects to be mis-classified as ventilated regions and VDP actually decreases. This mis-classification appears to occur at slightly higher SNR for linear binning than adaptive k-means. Figure 5 shows the way in which the VDP varied as a function of SNR across the entire cohort for both the linear-binning method and the adaptive k-means. For this cohort, the original 129Xe ventilation images had a range of 10.2±5.1, and with evenly spaced noise degradation the noisiest images had an SNR of 1.2±0.4. Using 1.8% as the tolerable difference threshold, the SNR values at which VDP deviated significantly from reference were 1.7±0.8 for the linear-binning, and 2.1±1.2 for uncorrected adaptive k-means.Discussion
This study shows that both methods provide robust quantification until SNR is remarkably low. Taking the mean plus two standard deviations for k-means suggests an SNR threshold 4.5. Given this SNR threshold, it becomes possible to now propose the minimum hyperpolarized 129Xe dose required to obtain reliable quantitative ventilation MRI10. Using the previously reported normalized SNR of 1.9 ml-2 but scaling down √(2-π/2) to correct for Rician background noise distribution, yields a required 129Xe dose equivalent of 30.1ml for the 0.12 ml voxel resolution the images used for this analysis. Note that further improvement to the robustness of these methods could be realized by reincorporating the adaptive k-means morphometric correction.Acknowledgements
R01HL105643, R01HL126771, P41 EB015897, Gilead SciencesReferences
1. Woodhouse N, Wild JM, Paley MN, et al. Combined helium-3/proton magnetic resonance imaging measurement of ventilated lung volumes in smokers compared to never-smokers. J Magn Reson Imaging. 2005;21(4):365-369.
2. Kirby M, Heydarian M, Svenningsen S, et al. Hyperpolarized 3He magnetic resonance functional imaging semiautomated segmentation. Acad Radiol. 2012;19(2):141-152.
3. M, Kaushik SS, Robertson SH, et al. Extending semiautomatic ventilation defect analysis for hyperpolarized (129)Xe ventilation MRI. Acad Radiol. 2014;21(12):1530-1541.
4. Tzeng YS, Lutchen K, Albert M. The difference in ventilation heterogeneity between asthmatic and healthy subjects quantified using hyperpolarized 3He MRI. J Appl Physiol (1985). 2009;106(3):813-822. 5. Svenningsen S, Kirby M, Starr D, et al. Hyperpolarized (3) He and (129) Xe MRI: differences in asthma before bronchodilation. J Magn Reson Imaging. 2013;38(6):1521-1530.
6. Virgincar RS, Cleveland ZI, Kaushik SS, et al. Quantitative analysis of hyperpolarized 129Xe ventilation imaging in healthy volunteers and subjects with chronic obstructive pulmonary disease. NMR Biomed. 2013;26(4):424-435.
7. Ebner L, He M, Virgincar RS, et al. Hyperpolarized 129Xenon Magnetic Resonance Imaging to Quantify Regional Ventilation Differences in Mild to Moderate Asthma: A Prospective Comparison Between Semiautomated Ventilation Defect Percentage Calculation and Pulmonary Function Tests. Invest Radiol. 2017;52(2):120-127.
8. He M, Driehuys B, Que L, Huang Y-CT. Using Hyperpolarized 129Xe MRI to Quantify the Pulmonary Ventilation Distribution. Acad Radiol. 2016.
9. Zha W, Niles DJ, Kruger SJ, et al. Semiautomated Ventilation Defect Quantification in Exercise-induced Bronchoconstriction Using Hyperpolarized Helium-3 Magnetic Resonance Imaging: A Repeatability Study. Acad Radiol. 2016;23(9):1104-1114.
10. He M, Robertson SH, Kaushik SS, et al. Dose and pulse sequence considerations for hyperpolarized (129)Xe ventilation MRI. Magn Reson Imaging. 2015;33(7):877-885.
Figures