4471
Hyperpolarized 129Xe Gas Exchange Imaging of the Human Lung using IDEAL with Spiral k-space Sampling1Department of Oncology, University of Oxford, Oxford, United Kingdom, 2Department of Radiology, The Churchill Hospital, Oxford, United Kingdom, 3Division of Cardiovascular Medicine, University of Oxford Centre for Clinical Magnetic Resonance Research, Oxford, United Kingdom
Synopsis
This proof of concept study describes implementation and analysis of an IDEAL (Iterative Decomposition of water and fat with Echo Asymmetry and Least-square estimation) based imaging technique for imaging hyperpolarized Xenon-129 (HPX) gas ventilation and dissolved phase compartments in human lungs. The time-series IDEAL imaging approach was tested in a healthy subject corroborating with Bloch equations and a numerical gas-exchange model showing that HPX gas ventilation and dissolved phase compartment images can be obtained, and the gas-transfer dynamics can be measured, in a single breath-hold interval of 8 seconds using 1L of HPX gas with polarization of ~10%.
Introduction:
Hyperpolarized Xenon-129 (HPX) gas MRI is a promising technique for the imaging of gas ventilation within the alveolar airways and the gas-transfer from alveolar airspaces to pulmonary tissue and capillaries(1, 2). Previously, HPX MR Spectroscopy techniques were employed to assess the gas-transfer dynamics temporally from the whole lung by measuring the HPX signal in the gas, Pulmonary Tissue and Blood Plasma (PTBP) and Red Blood Cells (RBCs) compartments(3-5). Recent studies have reported Dixon, IDEAL (Iterative Decomposition of water and fat with Echo Asymmetry and Least-square estimation) and MR spectroscopy based-imaging techniques as valuable for imaging the gas, PTBP, and RBCs compartments of the HPX in the lungs(6-9). In this study, we extended the IDEAL imaging approach from small animal imaging(8) to clinical imaging which generated three sets of time-series images including gas, PTBP and RBCs compartments in human lungs, with the additional advantage of capturing gas-transfer dynamics in a single breath-hold.Theory:
Temporal signal dynamics for the gas and dissolved phase compartments were investigated in corroboration to the analytical solution of Bloch Equation:
SGas = Mi exp(-t/T1) cos(αGas)n-1 sin(αGas) (1)
SDis = Mi λ exp(-t/T1) cos(αGas)n-1 [M(TRmin) + M(∆)] sin(αDis) + Mi λ cos(αDis)n-1[M(TRmin) + M(∆)] sin(αDis) +Sbuildup (2)
Where Mi is a scaling factor that is dependent on the polarization, amount of HPX gas, and coil sensitivity; T1 is the longitudinal relaxation time; αGas and αDis are the flip angles in the gas and PTBP phase, respectively; n is the number of RF pulses; λ is a scaling factor determined by the solubility and concentration of HPX in PTBP and RBCs compartments; M(TRmin) is the constant percentage replenishment of dissolved phase signal during a minimum pulse repetition time, TRmin, between each RF pulse. M(∆) is the percentage replenishment of dissolved phase signal that was replenished during the additional time delay, ∆, in the beginning of each echo image in time-series IDEAL acquisition. Sbuildup is the buildup dissolved phase signal accumulated during the time between inhalation and the time-series IDEAL images starting.
Methods:
A healthy subject was scanned using a 1.5T MR scanner and a proton-blocked vest-shaped RF coil in two different imaging sessions using 1L of enriched xenon gas with ~10% polarization. The conventional proton MR images and time-series IDEAL images were acquired from the same subject. Time-series IDEAL images were acquired with ∆ = ∆spoil, 300, 200, 100, 50, 30, 25, 20 ms. Regions of interests (ROIs) were selected from the time-series gas, PTBP, and RBCs images covering the left and right lungs. The gas-transfer curves were obtained by fitting Mansson’s exponential model(10) to the normalized data points from ROIs of time-series IDEAL images. Mansson’s fitting parameters: So, S1 and τ1, and measured imaging parameters (Mi, T1, αGas and αDis in Eq. (1-2)) were compared in a healthy subject.Results:
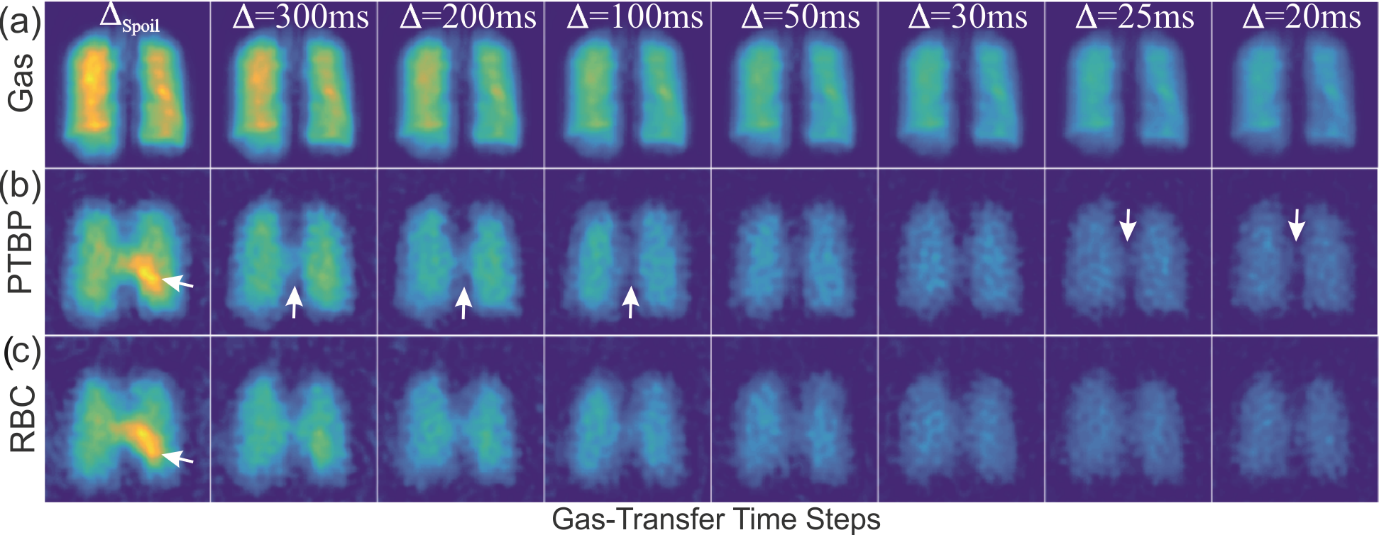
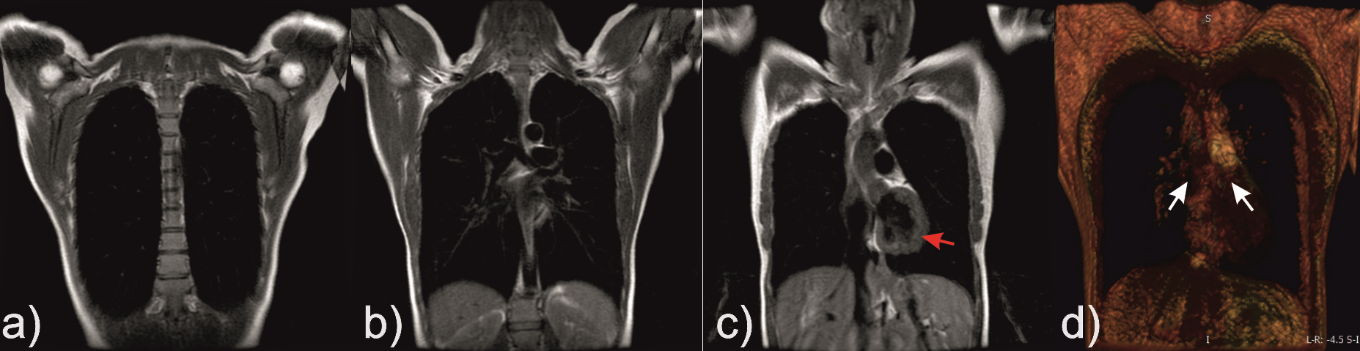
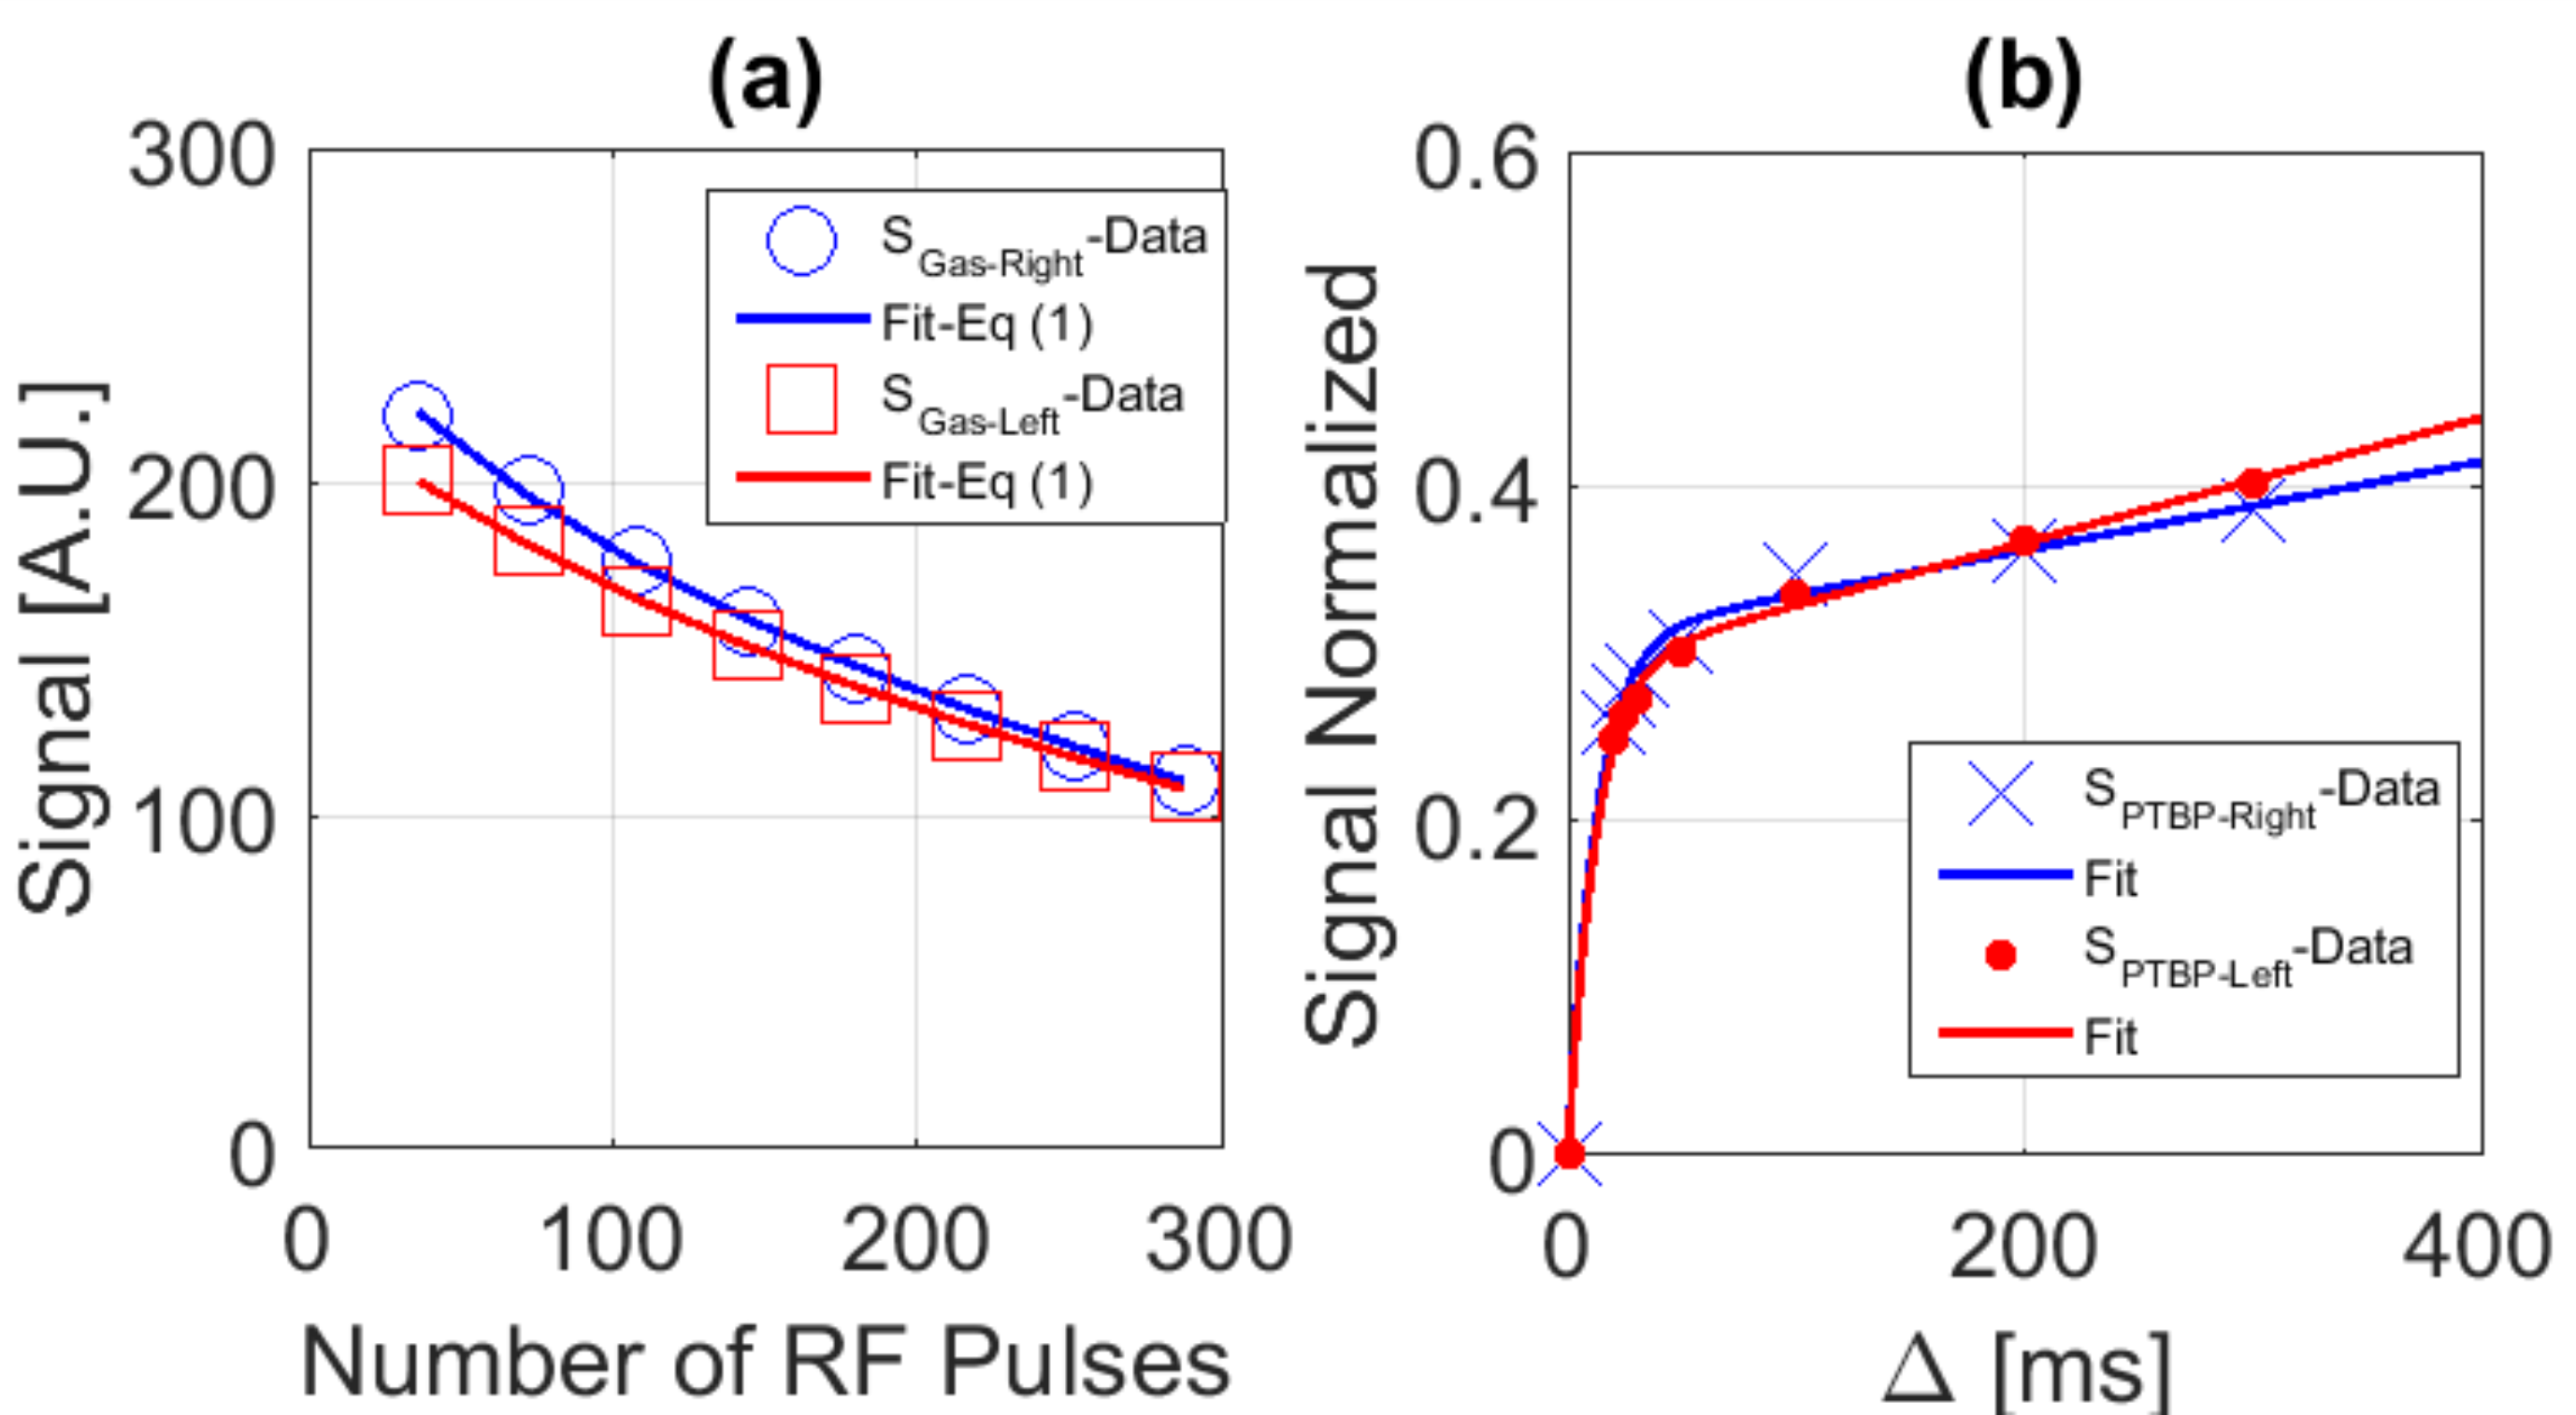
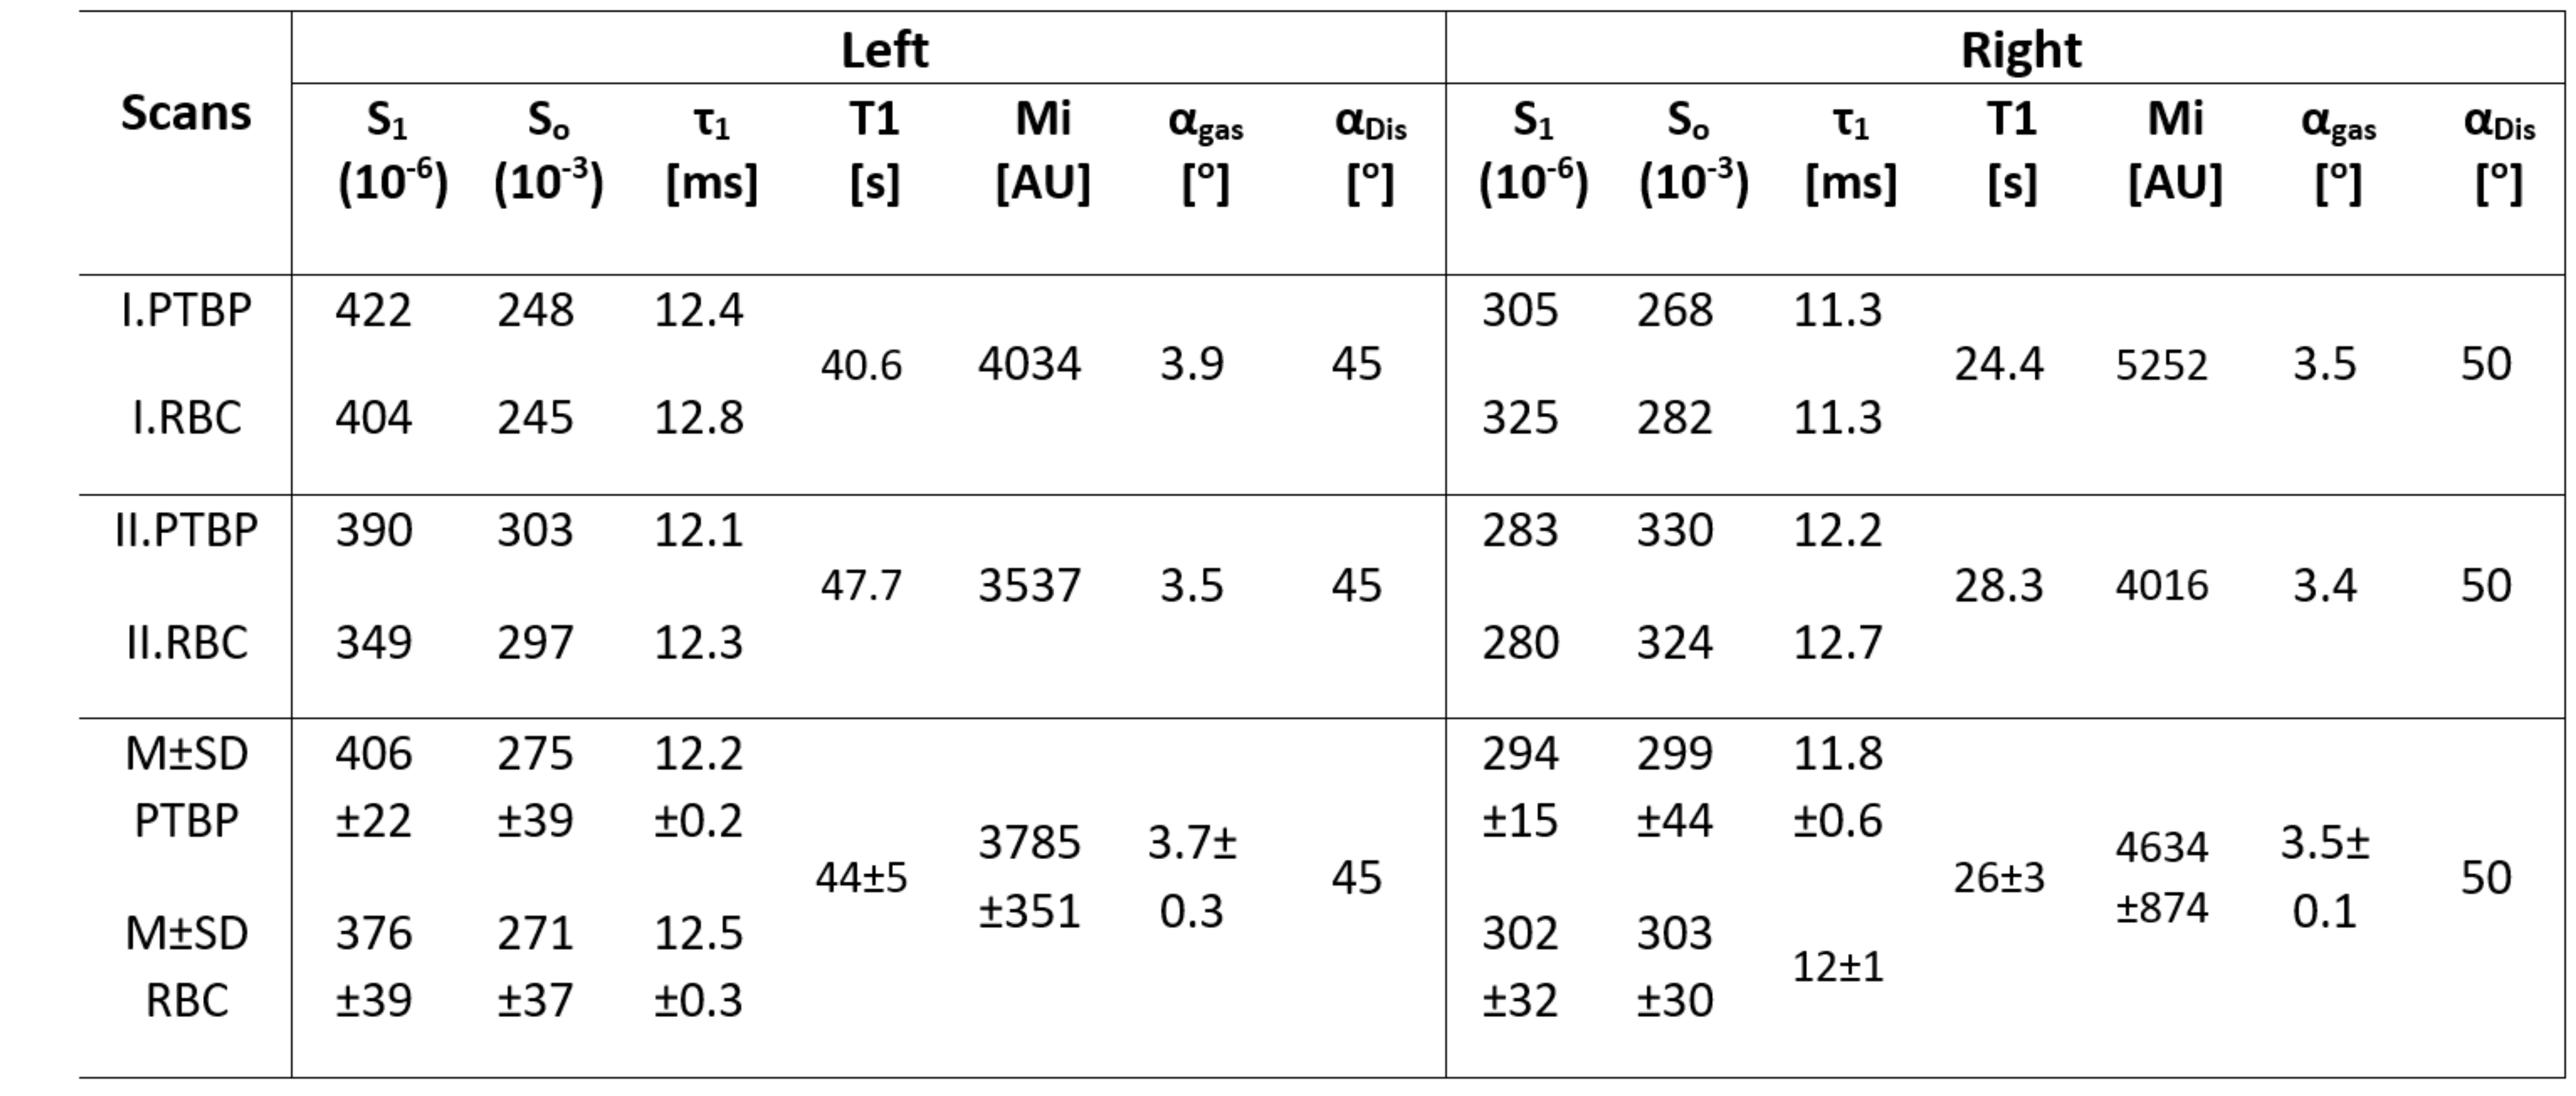
Time-series IDEAL images of gas, PTBP and RBC compartments from a healthy subject are shown in Figure 1(a-c) as a function of ∆, respectively. The signal from the central region in Figure 1(b-c) was strongest at the spoiling acquisition, ∆spoil, corresponding to the dissolved phase HPX in the left heart ventricle and pulmonary arterial vasculature as shown in Figure 2(a-d). The gas signal with respect to the number of RF pulses (in Figure 1a) is shown in Figure 3a for the left (SGas-Left) and right (SGas-Right) lungs and the corresponding fit from Eq. (1). Gas-transfer data points including the Mansson’s fitting are shown in Figure 3b. The imaging parameters (Mi, T1, and αGas) from fit in Figure 3a and the Masson’s fitting parameters from Figure 3b are reported in Table 1.Discussion:
The signal intensity variation in time-series PTBP and RBC images showed similar gas-transfer dynamics as those measured in MR spectroscopy with the advantage of regional information. In particular, the fitting parameter τ1 was the gas-transfer time constant associated to the exponential increase in the dissolved phase xenon concentration. The mean τ1 from the PTBP for the left lung was found to be 12.2±0.2 ms. ∆=12 ms in Fig.3b corresponded to a signal amplitude of 0.2. This was approximately 50% of the signal amplitude (i.e. the concentration of HPX in the PTPB compartment) compared to the signal amplitude at ∆=300 ms, thus showing the feasibility of measurement of gas-transfer dynamics.Conclusion:
This novel technique has enabled simultaneous imaging of gas, PTBP and RBC compartment in the lungs and measurement of gas-transfer dynamics within a single breath-hold interval of 8 seconds. For a proof-concept demonstration, the mean τ1 were found to vary less than 10% in a healthy subject.Acknowledgements
The authors are thankful to Claire Trumper, and Kenneth Jacob for assistance with the gas production and delivery. We also acknowledge Alexandra Eves and other MRI radiographers from the Churchill Hospital for their kind help with MR scans.References
1. Ruppert K, Brookeman JR, Hagspiel KD, Mugler JP, 3rd. Probing lung physiology with xenon polarization transfer contrast (XTC). Magn Reson Med. 2000;44:349-57.
2. Driehuys B, Cofer GP, Pollaro J, et al. Imaging alveolar-capillary gas transfer using hyperpolarized Xe-129 MRI. Proc. Natl. Acad. Sci. U.S.A. 2006;103:18278-83.
3. Mugler JP, 3rd, Driehuys B, Brookeman JR, et al. MR imaging and spectroscopy using hyperpolarized 129Xe gas: preliminary human results. Magn Reson Med. 1997;37:809-15.
4. Chang YLV, Quirk JD, Ruset IC, et al. Quantification of Human Lung Structure and Physiology Using Hyperpolarized Xe-129. Magn Reson Med. 2014;71:339-44.
5. Stewart NJ, Leung G, Norquay G, et al. Experimental validation of the hyperpolarized Xe chemical shift saturation recovery technique in healthy volunteers and subjects with interstitial lung disease. Magn Reson Med. 2015;74:196–20.
6. Kaushik SS, Robertson SH, Freeman MS, et al. Single-breath clinical imaging of hyperpolarized (129)Xe in the airspaces, barrier, and red blood cells using an interleaved 3D radial 1-point Dixon acquisition. Magn Reson Med. 2016;75:1434-43.
7. Qing K, Ruppert K, Jiang Y, et al. Regional mapping of gas uptake by blood and tissue in the human lung using hyperpolarized xenon-129 MRI. J Magn Reson Imaging. 2014;39:346-59.
8. Doganay O, Wade T, Hegarty E, et al. Hyperpolarized (129) Xe imaging of the rat lung using spiral IDEAL. Magn Reson Med. 2016;76:566-76.
9. Zanette B, Stirrat E, Jelveh S, et al. Detection of regional radiation-induced lung injury using hyperpolarized 129 Xe chemical shift imaging in a rat model involving partial lung irradiation: Proof-of-concept demonstration. Advances in Radiation Oncology. 2017;2:475-84.
10. Mansson S, Wolber J, Driehuys B, et al. Characterization of diffusing capacity and perfusion of the rat lung in a lipopolysaccaride disease model using hyperpolarized Xe-129. Magn Reson Med. 2003;50:1170-9.
Figures