4466
Mapping of pseudo-compliance using hyperpolarized 129Xe morphometry in the rat lungAndras Lindenmaier1,2, Brandon Zanette1,2, Elaine Stirrat1, Brian Kavanagh1,3,4, and Giles Santyr1,2
1Translational Medicine, Hospital for Sick Children, Toronto, ON, Canada, 2Medical Biophysics, University of Toronto, Toronto, ON, Canada, 3Anesthesia, University of Toronto, Toronto, ON, Canada, 4Critical Care Medicine, Hospital for Sick Children, Toronto, ON, Canada
Synopsis
Performing 129Xe morphometry at multiple pressures allows for direct mapping of microstructural changes and micromechanical properties of the lung (eg. pseudo-compliance) in both health and disease. In the present study, the effects of posture and gravity on the linear portion of lung pseudo-compliance are investigated using this approach in healthy mechanically-ventilated rats. Spatial gradients in lung pseudo-compliance due to gravity and posture are shown to vary, consistent with the expectations that the lungs are denser dorsally due to the weight above. Scaled regional pseudo-compliance is shown to be in agreement with whole lung compliance measured using 1H MRI.
Introduction
Hyperpolarized (HP) gas apparent diffusion coefficients (ADC) and morphometry have been demonstrated for the microstructural characterization of various lung diseases, both preclinically and clinically.1 Several studies2,3,4 have used ADC imaging of HP 3He and 129Xe in rats and humans to infer microstructural changes due to different ventilation pressure schemes. This tool could be useful for the early detection and monitoring of treatment of diseases affecting lung micromechanics. In the present study, we use MRI morphometry to quantify the regional response of the acinar microstructure, specifically the surface-to-volume ratio (SVR), to changes in peak inspiratory pressure (PIP) in ventilated healthy rats. In this way, we present the mapping of pseudo-compliance (CXe), which we believe reflects regional microelastic and micromechanical properties of the lung.5 We compare pseudo-compliance maps with whole-lung compliance obtained using conventional multislice 1H MRI performed concurrently at the same PIPs.Methods
Twelve week old Sprague-Dawley rats were anesthetized, tracheostomized, and continuously ventilated in the supine position with air and given four pre-breaths of HP 129Xe followed by a 13 second breath-hold during which diffusion-weighted MRI was performed (3T Prisma, Siemens).5 To allow for imaging of the gravitational gradient, sagittal images were acquired in addition to coronal images. Six b-value images ranging 0- 30.2 s/cm2 were acquired and averaged 2-4 times (Gmax = 7.9G/cm, diffusion time of 2.65 ms, TE = 8.25 ms, TR = 16ms, FA = ~4°, FOV = 70mm, and a matrix = 64 x 64, and a partial echo of 62.5%) to ensure adequate SNR. This was repeated at PIP of 6, 9 and 12 cmH2O respectively, to span the linear region of the compliance curve.3 Images were zero-padded, Hanning, and moving-average filtered using MATLAB 2014a (MathWorks). Acinar SVR maps were calculated as previously described6 and co-registered using a deformable registration algorithm to account for lung expansion (imtransform.m), based on the corresponding ventilation images (b = 0) at each PIP. SVR maps were then pixel-wise fitted as a function of PIP to obtain CXe, defined as the slope of the SVR vs. PIP fits. Only fits with R2>0.5 were included in the CXe map.Results
Figure 1 shows typical CXe maps for a representative rat in the coronal and sagittal projection of the whole lung, demonstrating that the spatial distribution of the pseudo compliance values is quite different along both views. Regions of increased and decreased SVR with pressure are visible in all maps; however, in Fig. 1a the dorsal regions show "truly" compliant lungs (ie. decreased SVR with pressure), while the ventral areas show predominantly increases in SVR. Maps similar to Fig. 1 were obtained for all animals (n=8; data not shown). Total lung compliance values scaled by average alveolar density values (~1.2 cm3/cmH2O) compare favorably with values measured using ex-vivo microscopy (~0.35-0.90 cm3/cmH2O)7,8 as well as with compliance from the multi-slice 1H data obtained in this study (0.44 cm3/cmH2O).Discussion
Figure 1 shows regional variability in CXe, which agrees with the high heterogeneity also seen in CT scans in human and animal studies of lung regional ventilation and elasticity.9 Furthermore, Fig. 1d also shows evidence of a gradient along the dorso-ventral axis in the direction of gravity, as previously established.10 Since CXe is the change in SVR as a function of PIP, CXe is affected by two major factors: expansion of terminal airways resulting in a decrease in SVR with increasing pressure (showing compliance), and alveolar recruitment resulting in an increase in SVR with increasing pressure. Areas with positive CXe have no distensibility while those with negative CXe have normal distensibility. Regions of null CXe are present where there is no change in the SVR with pressure (mostly seen in the airways). While the dorsal regions are measuring "true" lung compliance, the peripheral areas may be suffering from atelectasis (closed alveoli) and hence biasing the compliance characterization; changing its linearity and posing a limitation to the presented method. Atelectasis is commonly seen in the peripheral parts of the lung and can be recruited with increased pressure, thus potentially explaining an increased SVR and positive pseudo-compliance in these regions. This effect may also explain whole-lung compliance differences derived from CXe as compared to 1H. Positive end-expiratory pressure maneuvers are often used to re-recruit alveoli3, and this process could potentially be tracked by mapping CXe to avoid over-distention or injury to the lungs. This new tool provides regional compliance information that can potentially be very useful in early detection and guiding treatment for patients suffering from lung injury, where compliance is known to change.11Acknowledgements
The authors are grateful to N. Kanhere, Y. Friedlander and F. Morgado for 129Xe gas polarization and help with experiments, to Dr. M. Couch for helpful discussion on pulse-programming and software development and to the funding sources: CIHR operating grant (MOP 123431) and NSERC Discovery grant (RGPIN 217015-2013). AL was supported by an NSERC PGSD award.References
1. Yablonskiy, et al. Diffusion lung imaging with hyperpolarized gas MRI. NMR Biomed 2015; doi: 10.1002/nbm.3448. 2. Chan HF, et al. Exploring Lung Inflation Mechanisms with 3D 3He and 129Xe Whole Lung Morphometry Mapping. Proc. of The 25th International Society for Magnetic Resonance in Medicine Annual Meeting. Honolulu, USA: poster # 3315; 2017. 3. Cereda M, et al. Positive End-expiratory Pressure Increments during Anesthesia in Normal Lung Result in Hysteresis and Greater Numbers of Smaller Aerated Airspaces. Anesthesiology 2013; 119(6): 1402–1409. 4. Xin Y, et al. Hyperpolarized gas diffusion MRI of biphasic lung inflation in short- and long-term emphysema models. Am J Physiol Lung Cell Mol Physiol 2017; 313: L305–L312. 5. Lindenmaier AA, et al. Pseudo-Compliance Mapping of the Rat Lung Using Hyperpolarized 129Xe Morphometry at Varying Pressures. Proc. of The 2017 International Workshop on Pulmonary Imaging. Philadelphia, USA: University of Pennsylvania; 2017. 6. Sukstanskii AL, et al. Lung morphometry with hyperpolarized 129Xe: theoretical background. Magnetic Resonance in Medicine 2012; 67(3): 856-866. 7. Fox MS, et al. Comparison of hyperpolarized He and Xe MRI for the measurement of absolute ventilated lung volume in rats. Magnetic Resonance in Medicine 2014; 71: 1130–1136. 8. Lai YL, et al. Respiratory mechanics in the anesthetized rat. Journal of Applied Physiology 1978; 45: 255–260. 9. I. Galvin, et al. Distribution of blood flow and ventilation in the lung: gravity is not the only factor. British Journal of Anaesthesia 2007; 98(4): 420–8. 10. Kaneko K, et al. Regional distribution of ventilation and perfusion as a function of body position. Journal of Applied Physiology 1966; 21: 767–777. 11. Kuethe DO, et al. Magnetic resonance imaging provides sensitive in vivo assessment of experimental ventilator-induced lung injury. American Journal of Physiology-Lung Cellular and Molecular Physiology 2016; 311: L208–L218.Figures
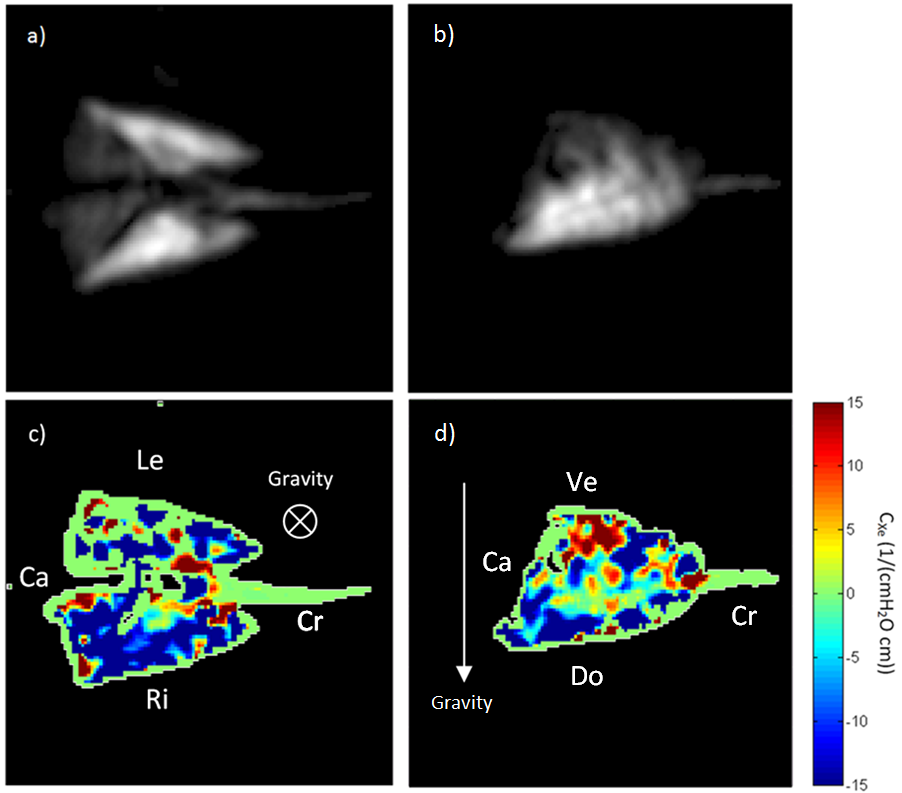
Figure 1. a) Coronal and b) sagittal 129Xe
ventilation images and corresponding CXe images c) and d)
respectively, averaged over the entire lung to show the total gravitational
gradient. Cranial (Cr), caudal (Ca), left (Le), right (Ri), dorsal (Do), and
ventral (Ve) regions are marked for orientation. The arrows show the
corresponding direction of gravity with respect to the imaging performed.