4465
Comparison of CT ventilation and Hyperpolarised Gas MRI: Effects of breathing manoeuvreBilal A. Tahir1,2, Helen Marshall1, Paul J. Hughes1, Guilhem Collier1, Rob H. Ireland2, and Jim M. Wild1
1Polaris, University of Sheffield, Sheffield, United Kingdom, 2Academic Unit of Clinical Oncology, University of Sheffield, Sheffield, United Kingdom
Synopsis
Image registration of lung CT images acquired at different inflation levels has been proposed as a surrogate method to map lung ‘ventilation’. However, this technique requires validation against established ventilation imaging modalities such as hyperpolarized gas MRI. Variations in lung inflation may affect regional lung function as imaged with the two modalities. Here, we evaluate the impact of the lung inflation level during MRI when comparing gas MRI and CT ventilation for a cohort of 7 patients with asthma.
Introduction
Image registration of lung CT images acquired at different inflation levels has been proposed as a surrogate method to map lung ‘ventilation’, based on the assumption that expansion and change in signal intensity of a given lung unit equates to ventilation. However, this technique requires validation against established ventilation modalities. Initial work has indicated the potential for clinically validating CT ventilation against hyperpolarised (HP) gas MRI1, a direct measure of gas ventilation. However, variations in lung inflation have been shown to affect the ventilation distribution observed in HP gas images2,3.Purpose
To evaluate the impact of lung inflation levels when comparing CT ventilation imaging to gold-standards of ventilation from HP gas MRI.Methods
7 patients with moderate-to-severe asthma underwent breath-hold CT at total lung capacity (TLC) and functional residual capacity (FRC). In addition, 3He-MRI and a same breath 1H-MRI4 were acquired at two lung inflation levels, FRC+1L and TLC, and spirometry was performed. MRI was performed within 6 days of spirometry and CT with a mean±SD interval of 1.5±0.8 days and range of 1 to 4 days. For the CT ventilation calculation, FRC-CT was registered to TLC-CT via a diffeomorphic transform5. Next, TLC-CT and registered FRC-CT were used to compute a surrogate ventilation image from voxel-wise intensity differences in Hounsfield unit values6. The lung ventilation surrogate was then thresholded at the 10th and 20th percentiles, above which the lung was assumed to be ventilated. For direct comparison of CT and 3He-MRI ventilation, FRC+1L and TLC 3He-MRI were registered to TLC-CT indirectly via the corresponding same-breath 1H-MRI data7 (figure 1). To test for variations in FRC+1L and TLC 3He-MRI, the percentage ventilated volume (%VV) was calculated for each patient by taking the ratio of binary segmented 3He-MRI and 1H-MRI volumes8. %VVs for FRC+1L and TLC 3He-MRI and both CT ventilation percentiles were correlated via the Spearman correlation coefficient against the clinically established measure of forced expiratory volume in 1 second (FEV1) reported as percentage of predicted value. For spatial comparison of 3He-MRI and CT ventilation, Dice similarity coefficients (DSCs) were computed separately for the binary segmentations of CT ventilation with those of FRC+1L and TLC 3He-MRI, respectively. Statistical significance of differences was tested using the Wilcoxon signed-ranks test.Results
The median (range) of %VV for FRC+1L and TLC 3He MRI were 90.5 (54.9-93.6) and 91.8 (67.8-96.2), respectively (p=0.018) (figures 2 and 3). Spearman correlation coefficients between FEV1 and %VV were 0.75 (p=0.05) for FRC+1L 3He-MRI, 0.82 (p=0.023) for TLC 3He-MRI, 0.86 (p=0.014) for the 10-100th CT percentile and 0.86 (p=0.014) for the 20-100th CT percentile. For the MRI versus CT ventilation comparison, visual evaluation of ventilation distributions (figure 4) and quantitative analysis via DSCs (figure 5) demonstrated improved correlation between CT and TLC 3He MRI when compared with FRC+1L 3He MRI with median (range) values of 0.93 (0.86-0.93) and 0.86 (0.68-0.92), respectively, for the 10-100th percentile (p=0.017) and 0.87 (0.83-0.88) and 0.81 (0.66-0.87), respectively, for the 20-100th percentile (p=0.027).Discussion
Qualitative visual evaluation and quantitative analysis of 3He-MRI demonstrated increased and more homogenous ventilation at TLC when compared with FRC+1L. In several cases, ventilation defects depicting airway closures at FRC+1L opened up at TLC. Inflation-related variations in ventilation led to improved spatial agreement of CT ventilated volumes with 3He MRI at TLC. CT ventilation purports to measure local air volume change between two lung inflation states, whilst static ventilation-weighted 3He MR images represent a snapshot of the concentration of 3He gas within the air in the lungs at a given inflation level. As the CT-based surrogates of ventilation were derived from breath-hold CT acquired at FRC and TLC, they more closely depicted the distribution of 3He gas at TLC. High correlations with FEV1 were observed for all four MRI- and CT-derived %VV measurements studied. The slightly higher correlation of %VV derived from TLC 3He MR images when compared to FRC+1L images (0.82 vs 0.75) may be due to the breathing manoeuvre used for imaging at TLC which was more similar to that performed during measurement of FEV1, leading to similar patterns of airway opening. The higher correlation of CT ventilation with FEV1 than MRI with FEV1 may be attributable to the fact that PFTs were performed on the same day as CT.Conclusion
This study demonstrates that comparison of CT ventilation and HP gas MRI varies with inflation state during HP gas MRI. If CT is acquired at FRC and TLC, a higher degree of spatial correlation with HP gas ventilation imaging can be achieved if the latter is acquired at TLC.Acknowledgements
University of Sheffield James Morrison Fund, Sheffield Hospitals Charity, Weston Park Hospital Cancer Charity, National Institute of Health Research, Airprom and Novartis.References
[1] Mathew L et al. Acad Radiol 2012;19:1546-53, [1] Sun Y et al. Respir Physiol Neurobiol 2009;169:44-9, [3] Marshall H et al. ATS 2013, [4] Wild J et al. NMR Biomed 2011;24:130-4, [5] Avants B et al. Neuroimage 2011;54:2033-44, [6] Int J Radiat Oncol Biol Phys 2005;62:630-634, [7] Tahir B et al. Phys Med Biol 2014;59:7267-77, [8] J Magn Reson Imaging 2017 doi: 10.1002/jmri.25804.Figures
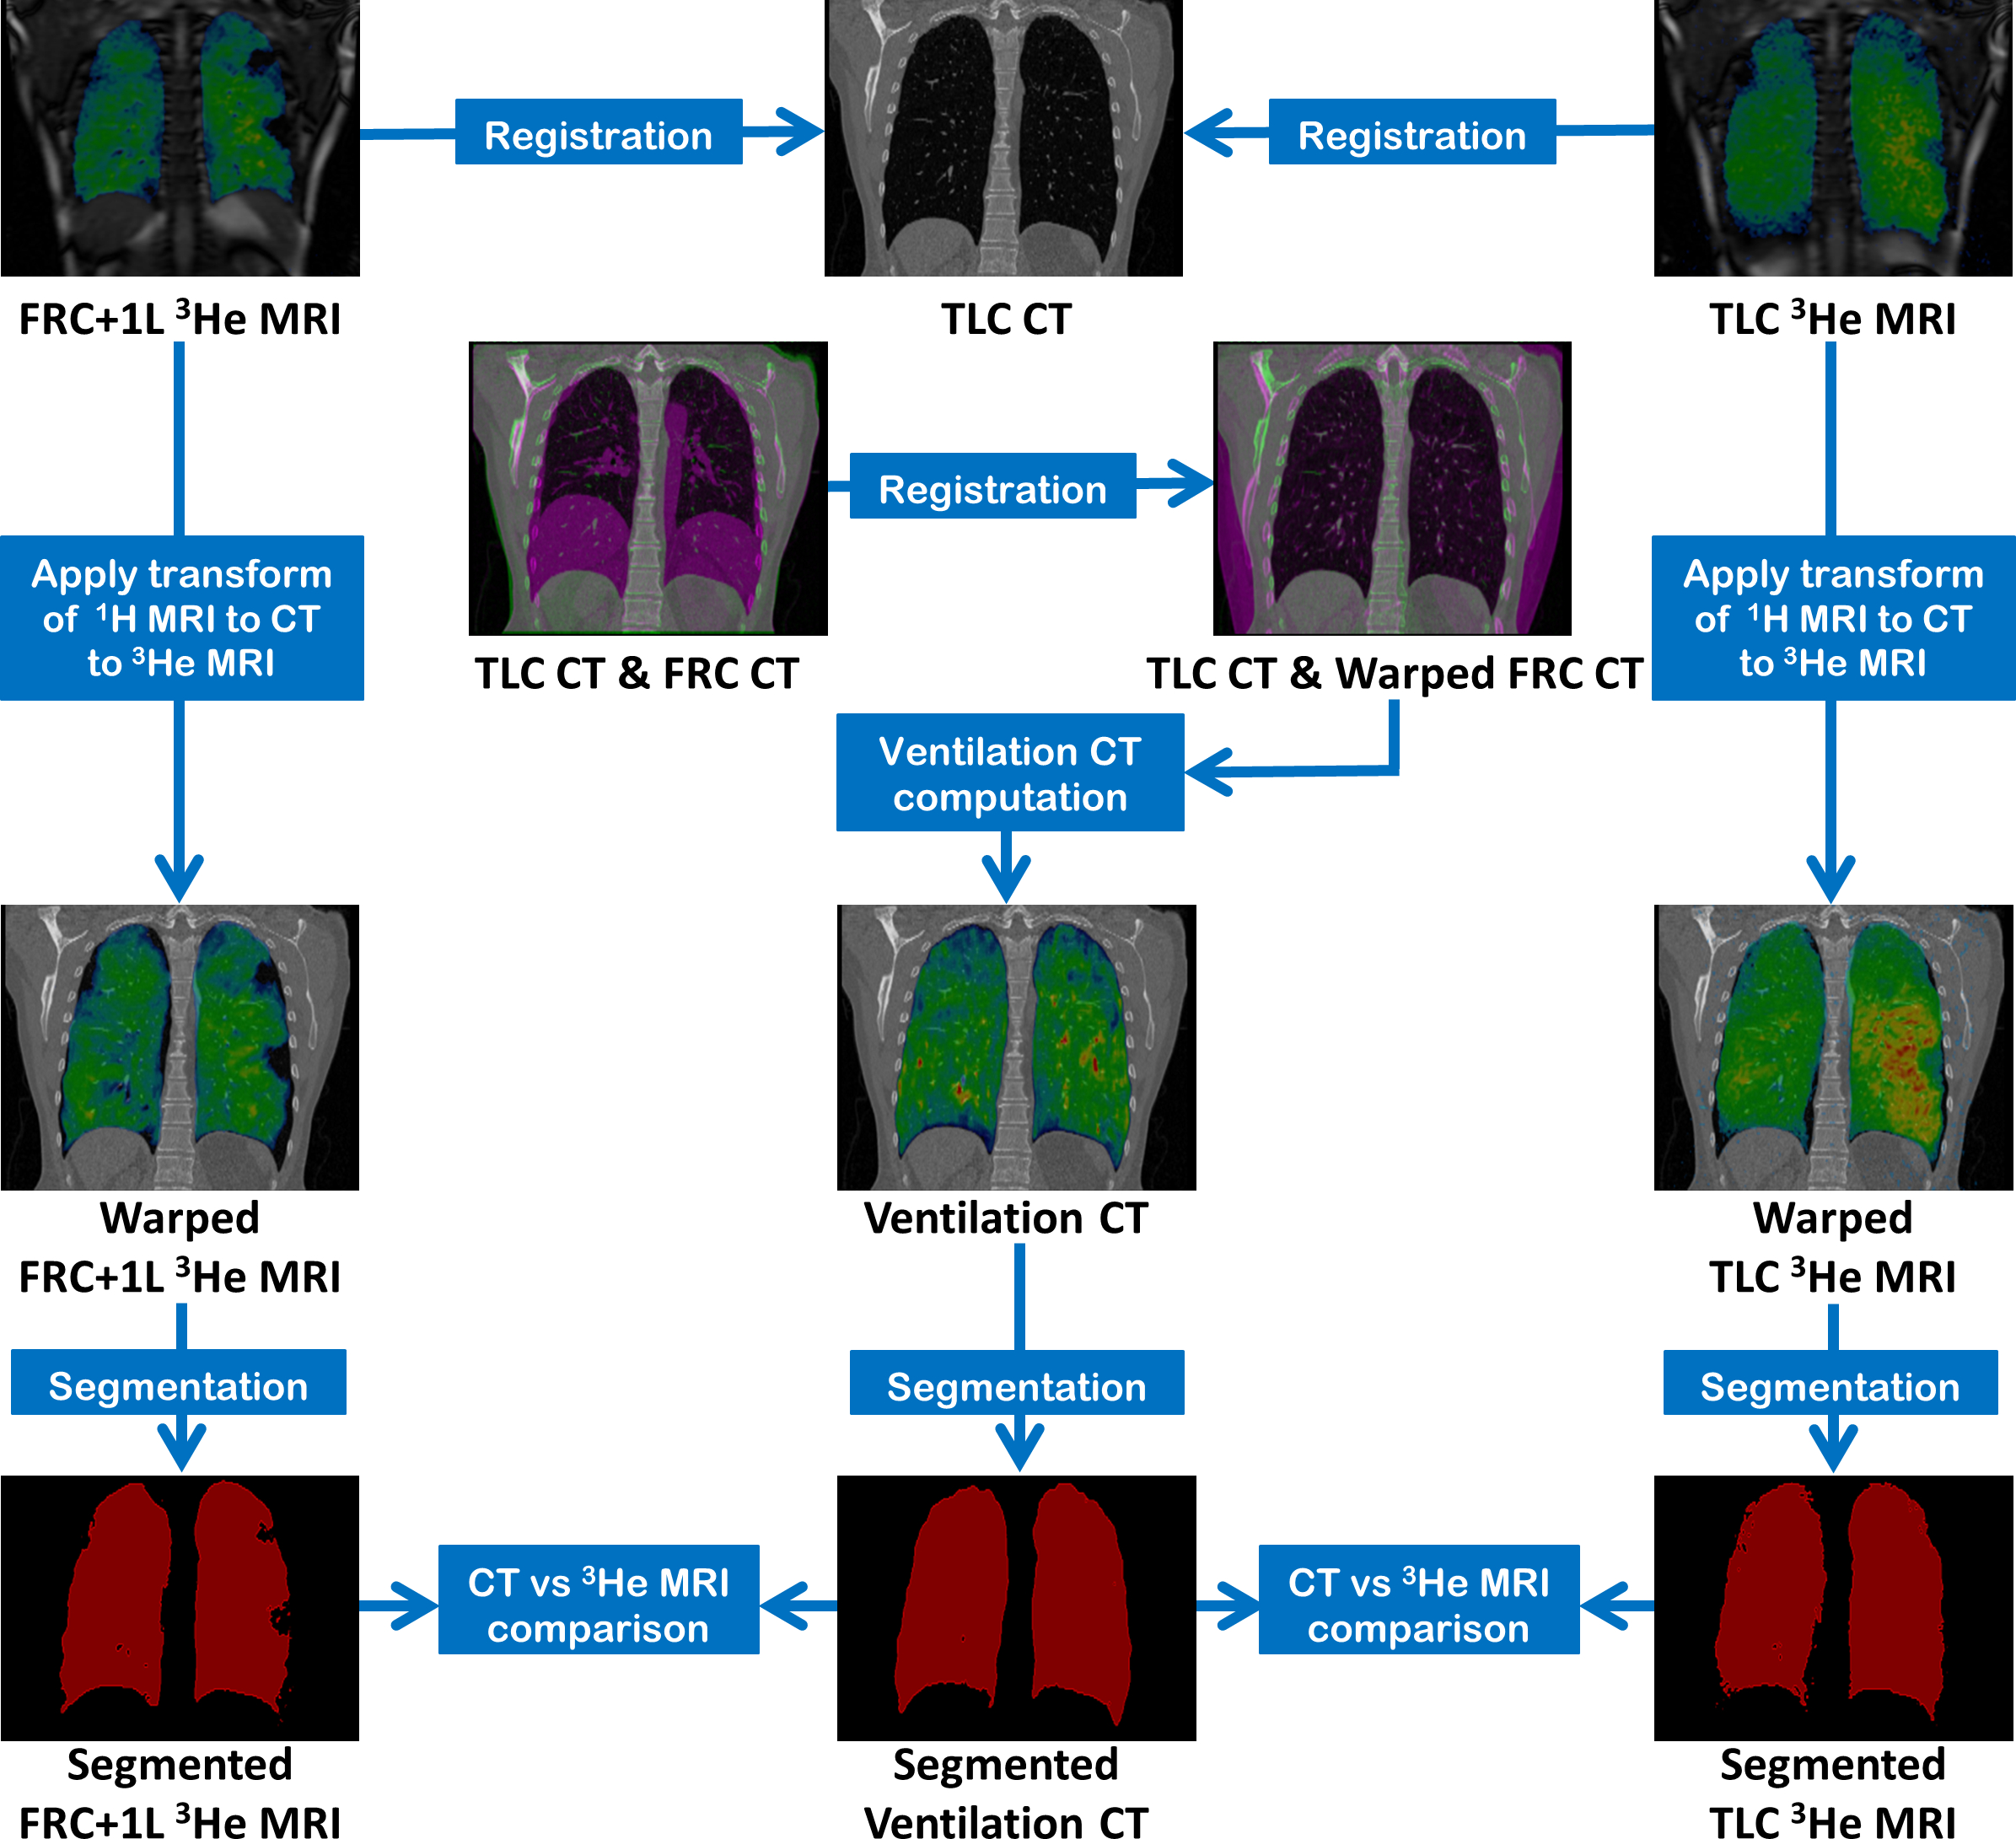
Workflow for comparison of FRC+1L and TLC 3He-MRI
with CT ventilation.
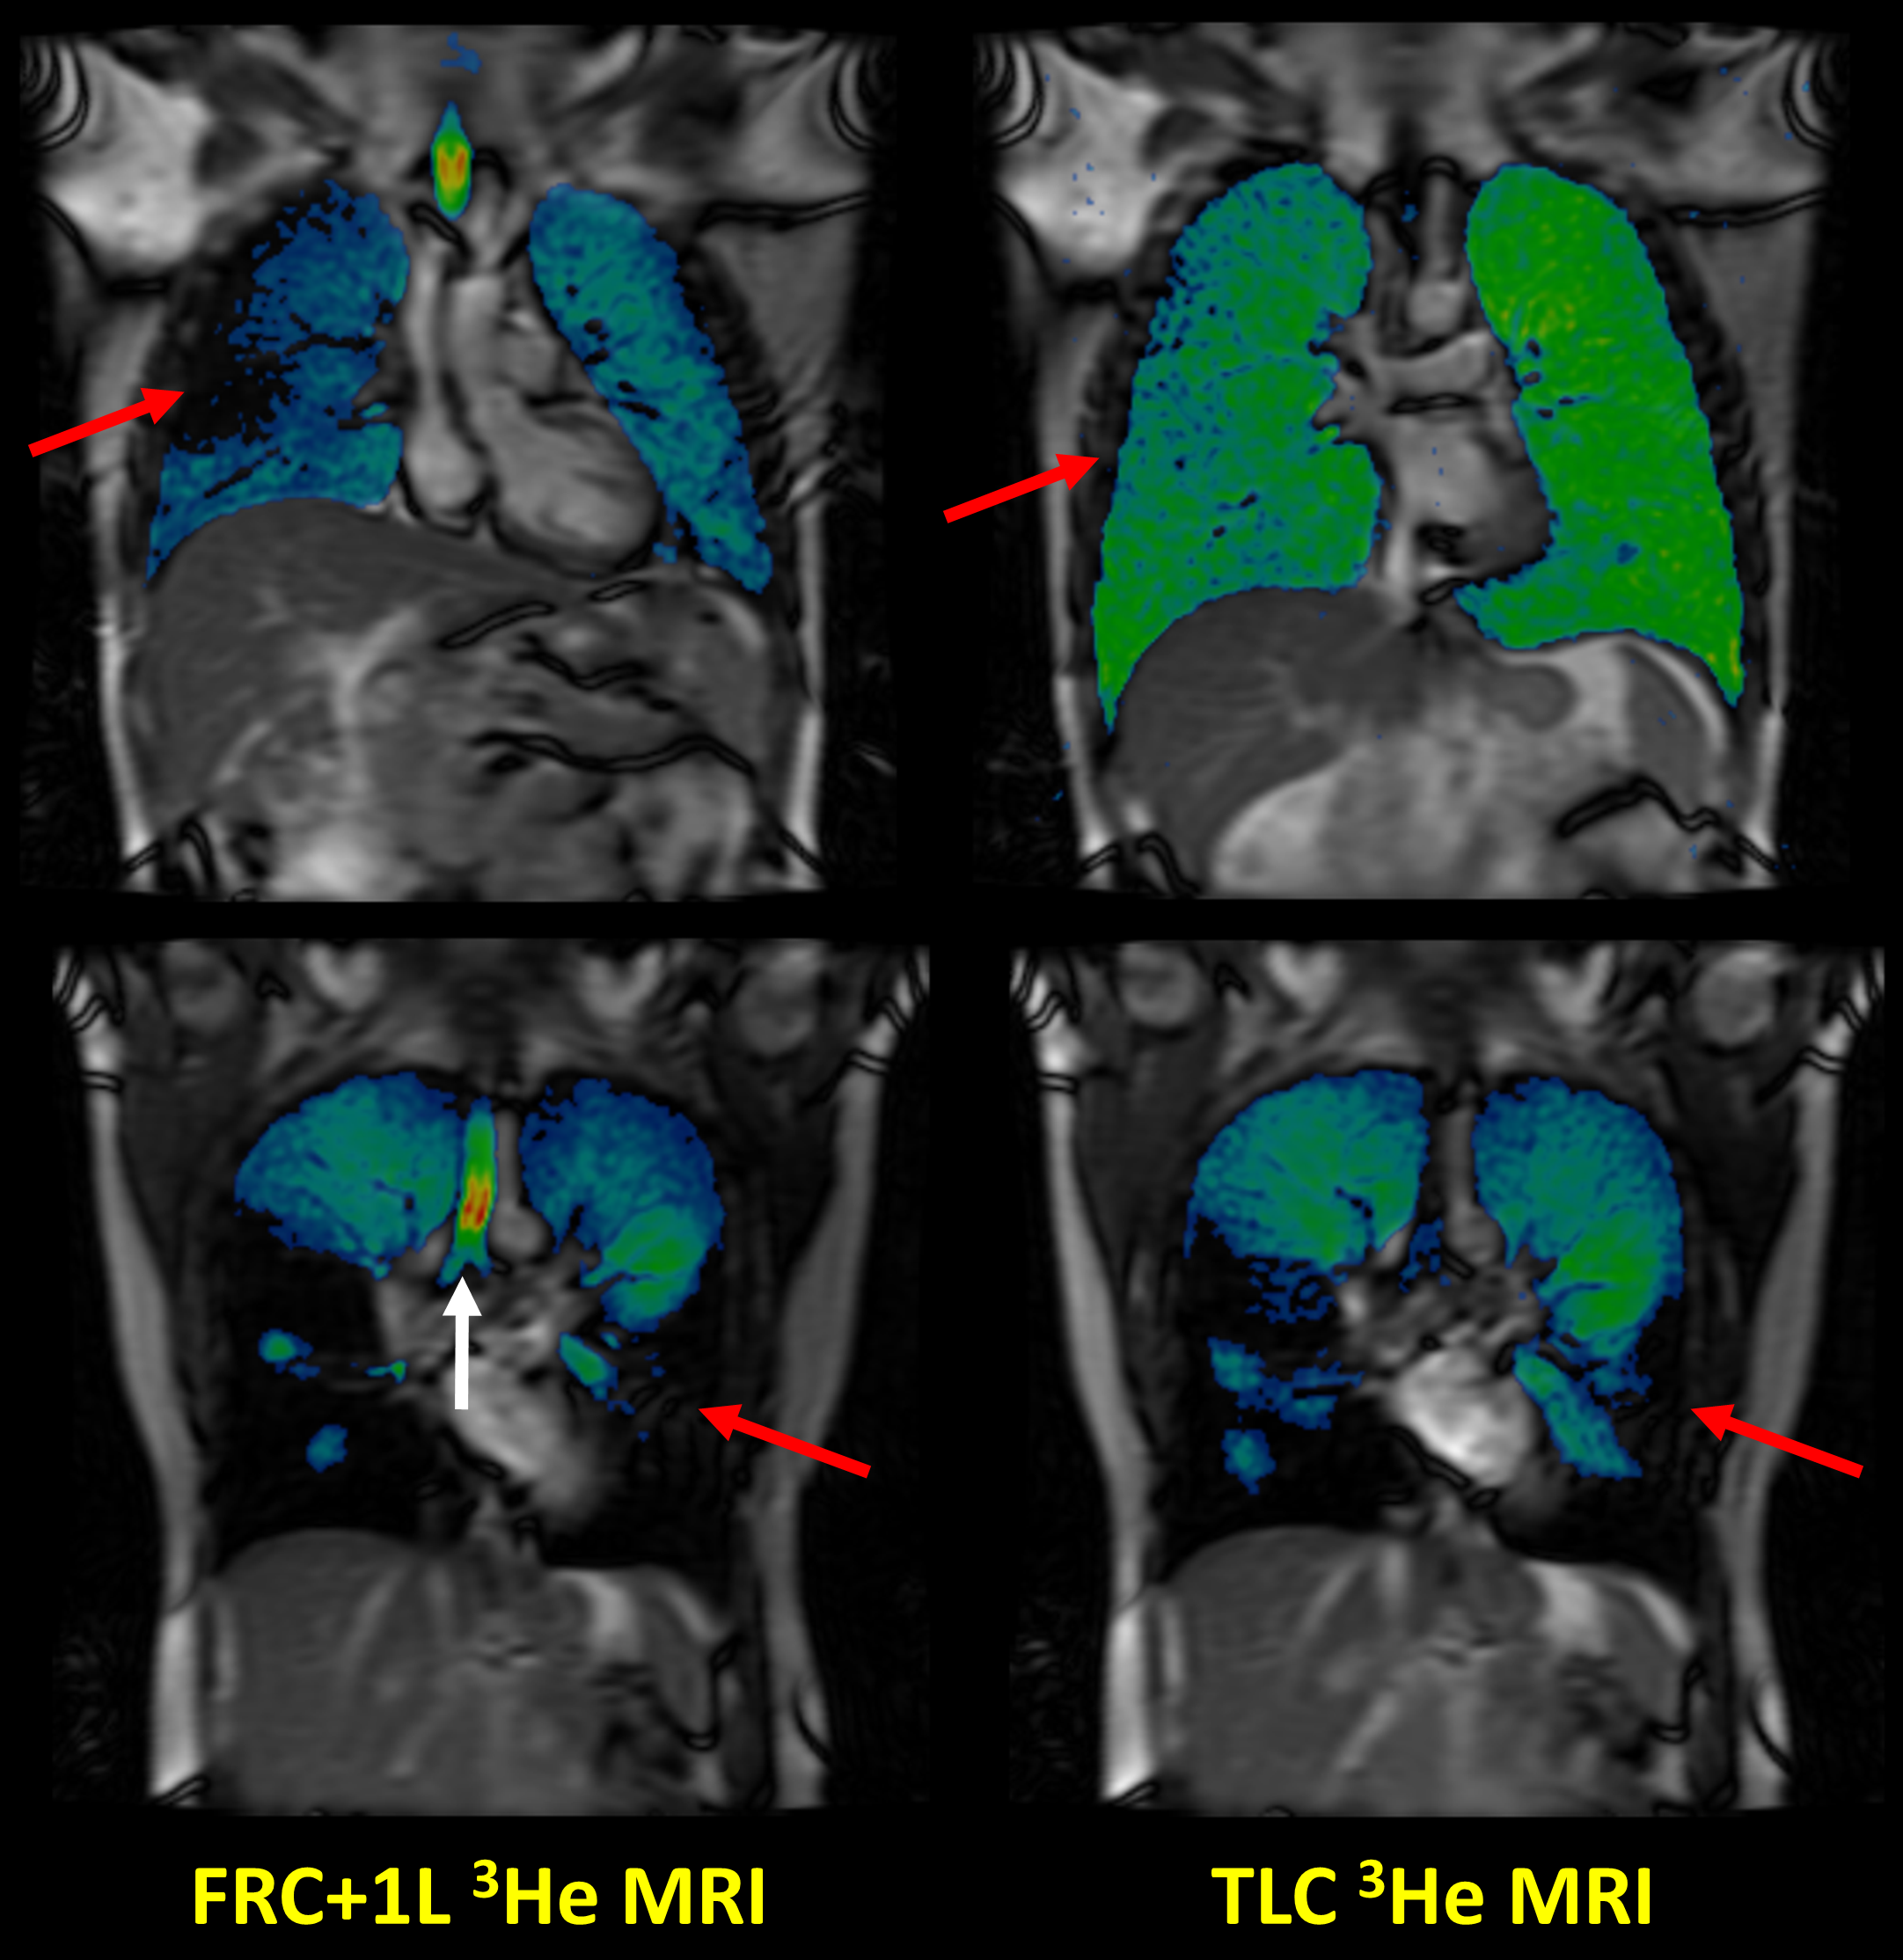
Corresponding coronal slices of patient 1 (top)
and patient 2 (bottom) showing 3He-MRI acquired at FRC+1L (left) and
TLC (right) fused with same-breath anatomical 1H MRI. Some
ventilation defects observed at FRC+1L resolve at TLC (red arrows), indicating
increased airway opening at the higher inflation state.
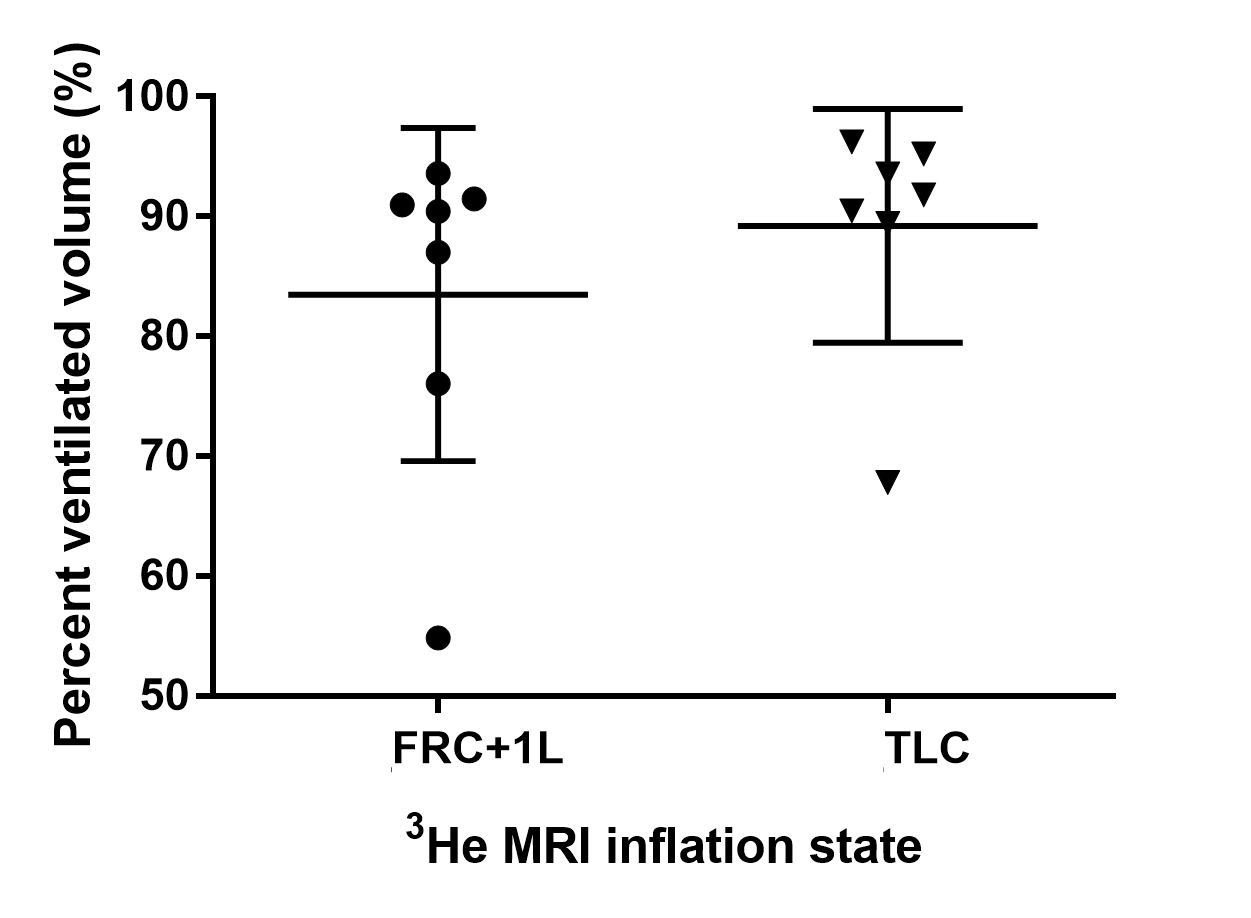
Figure 3. Box plot of %VVs of 3He-MRI
acquired at FRC+1L and TLC. Individual data points are shown for all patients
along with the mean±SD across inflation state.
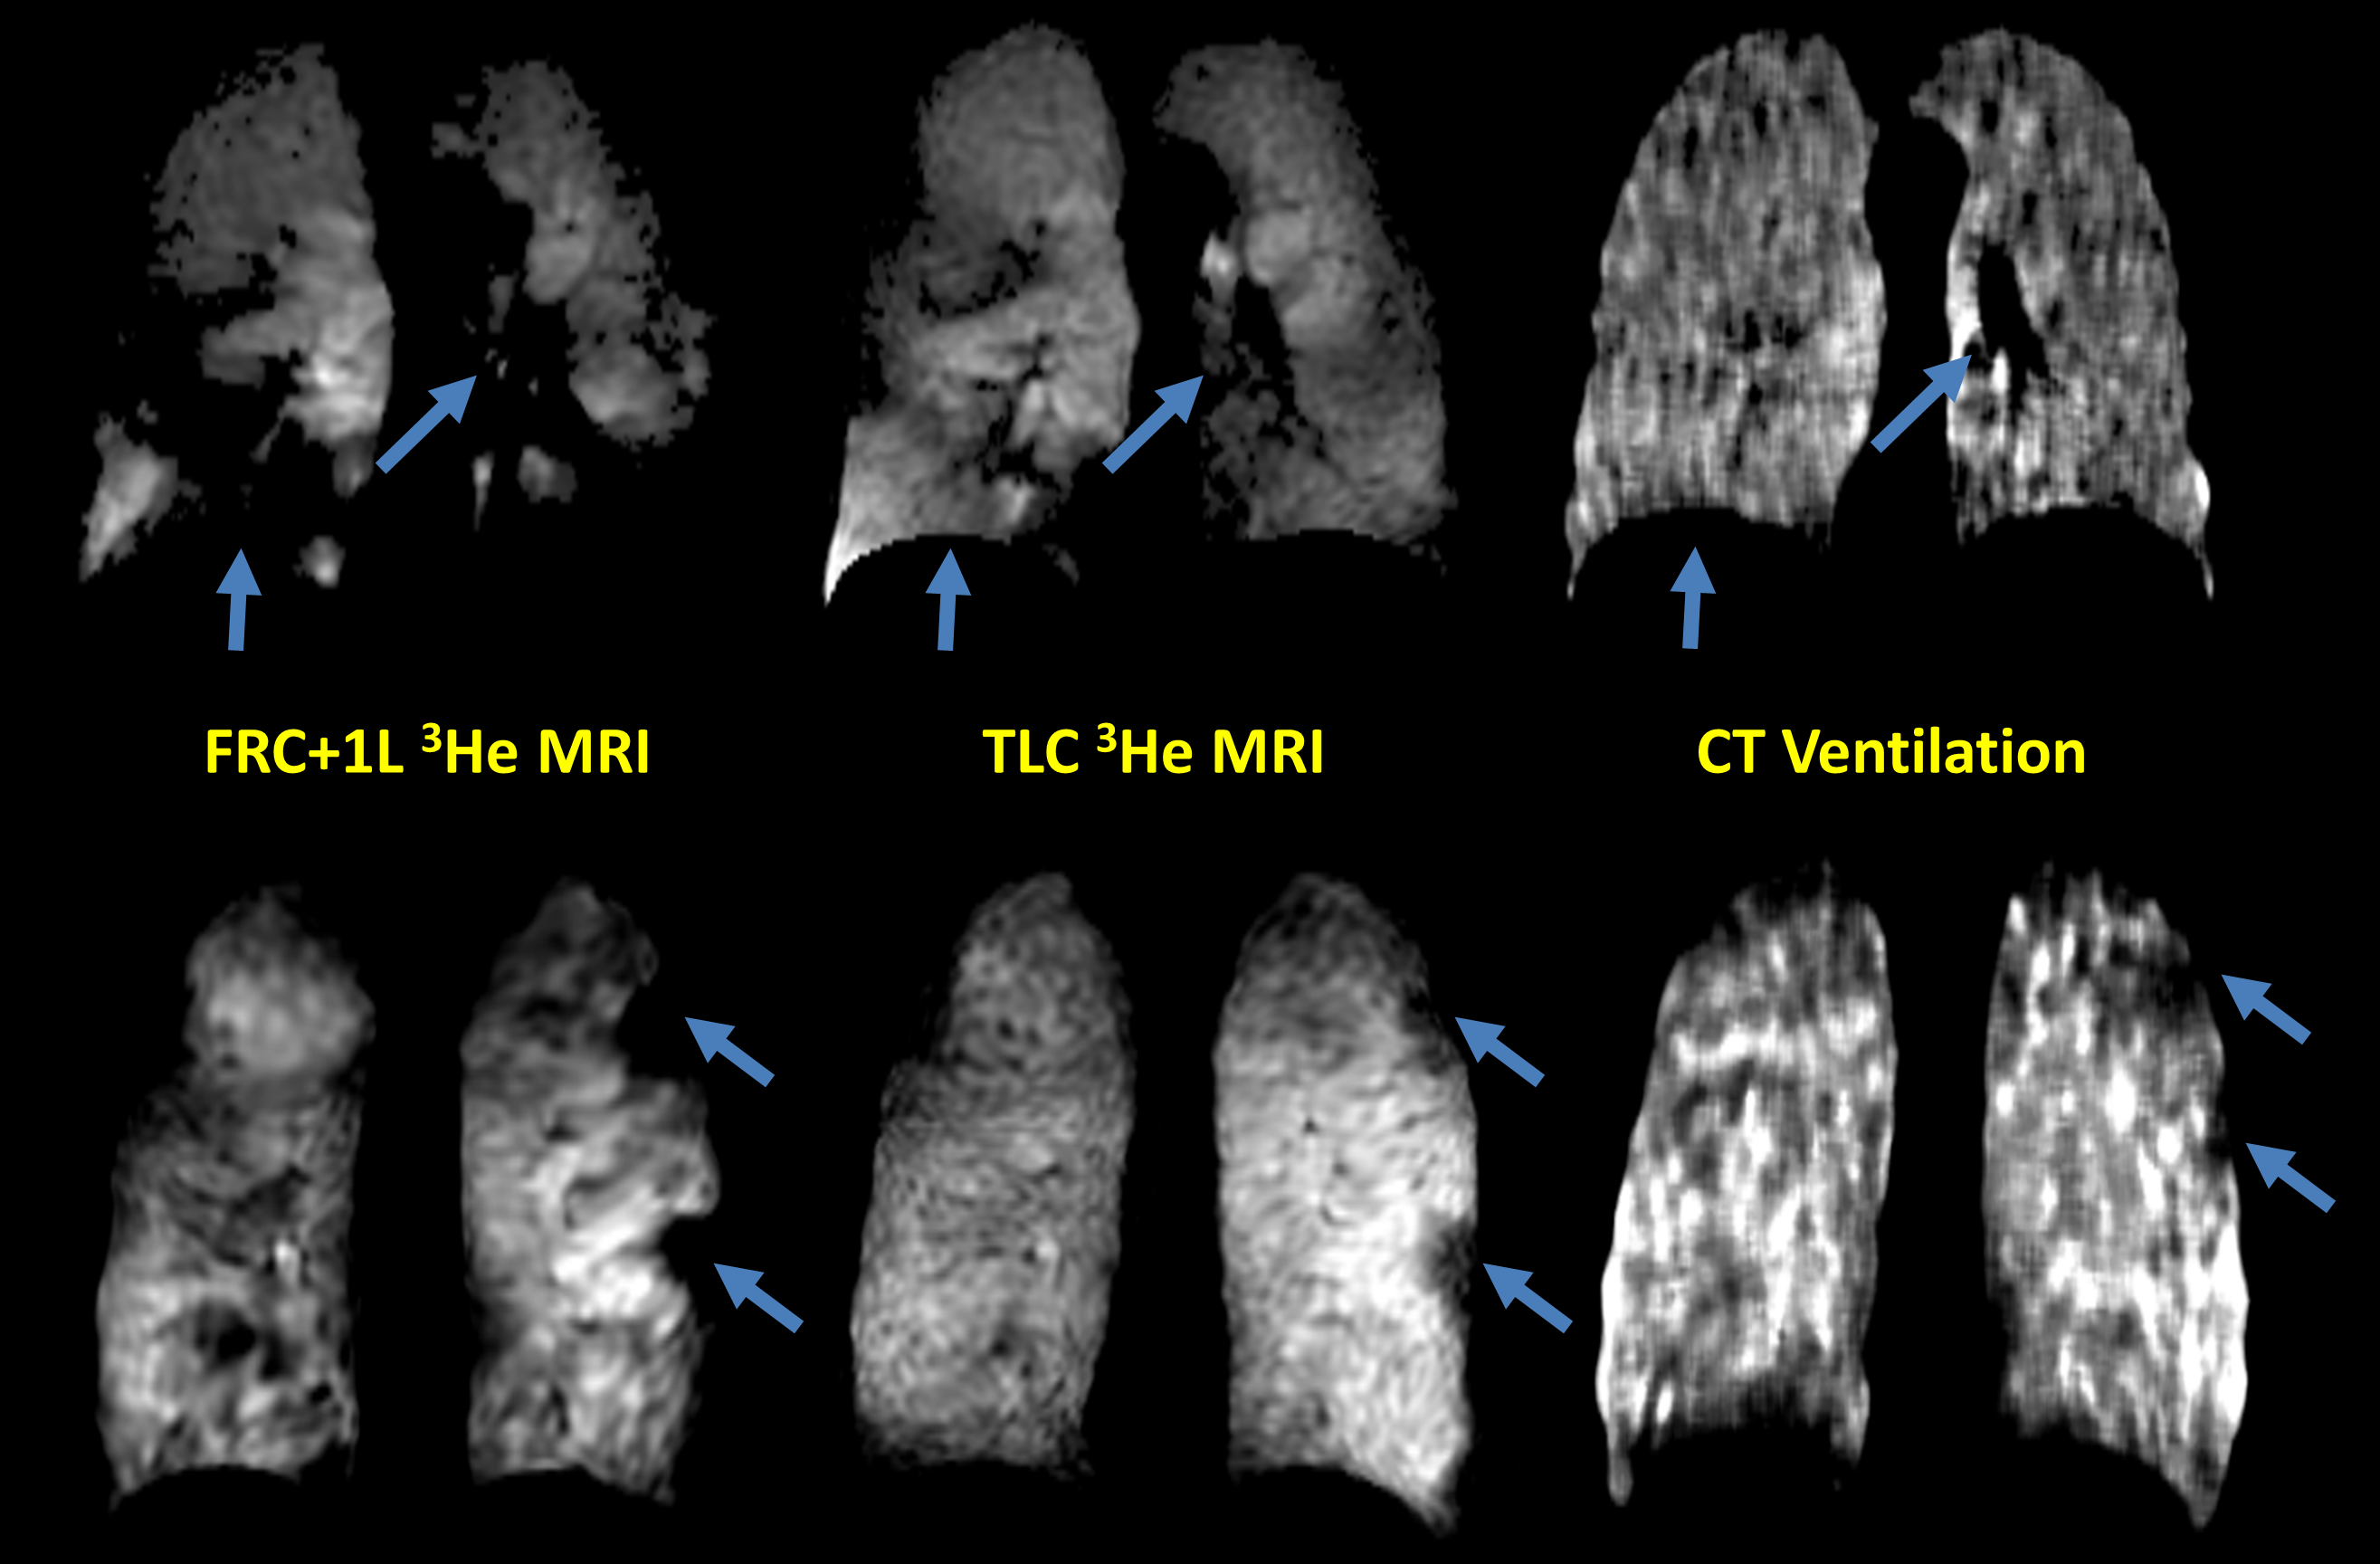
Figure 4. Corresponding
coronal slices for two representative patients of registered FRC+1L 3He
MRI, TLC 3He MRI and CT ventilation. The blue arrows depict defects
and regions that are more visually similar for CT ventilation and TLC 3He
MRI compared with FRC+1L 3He MRI.
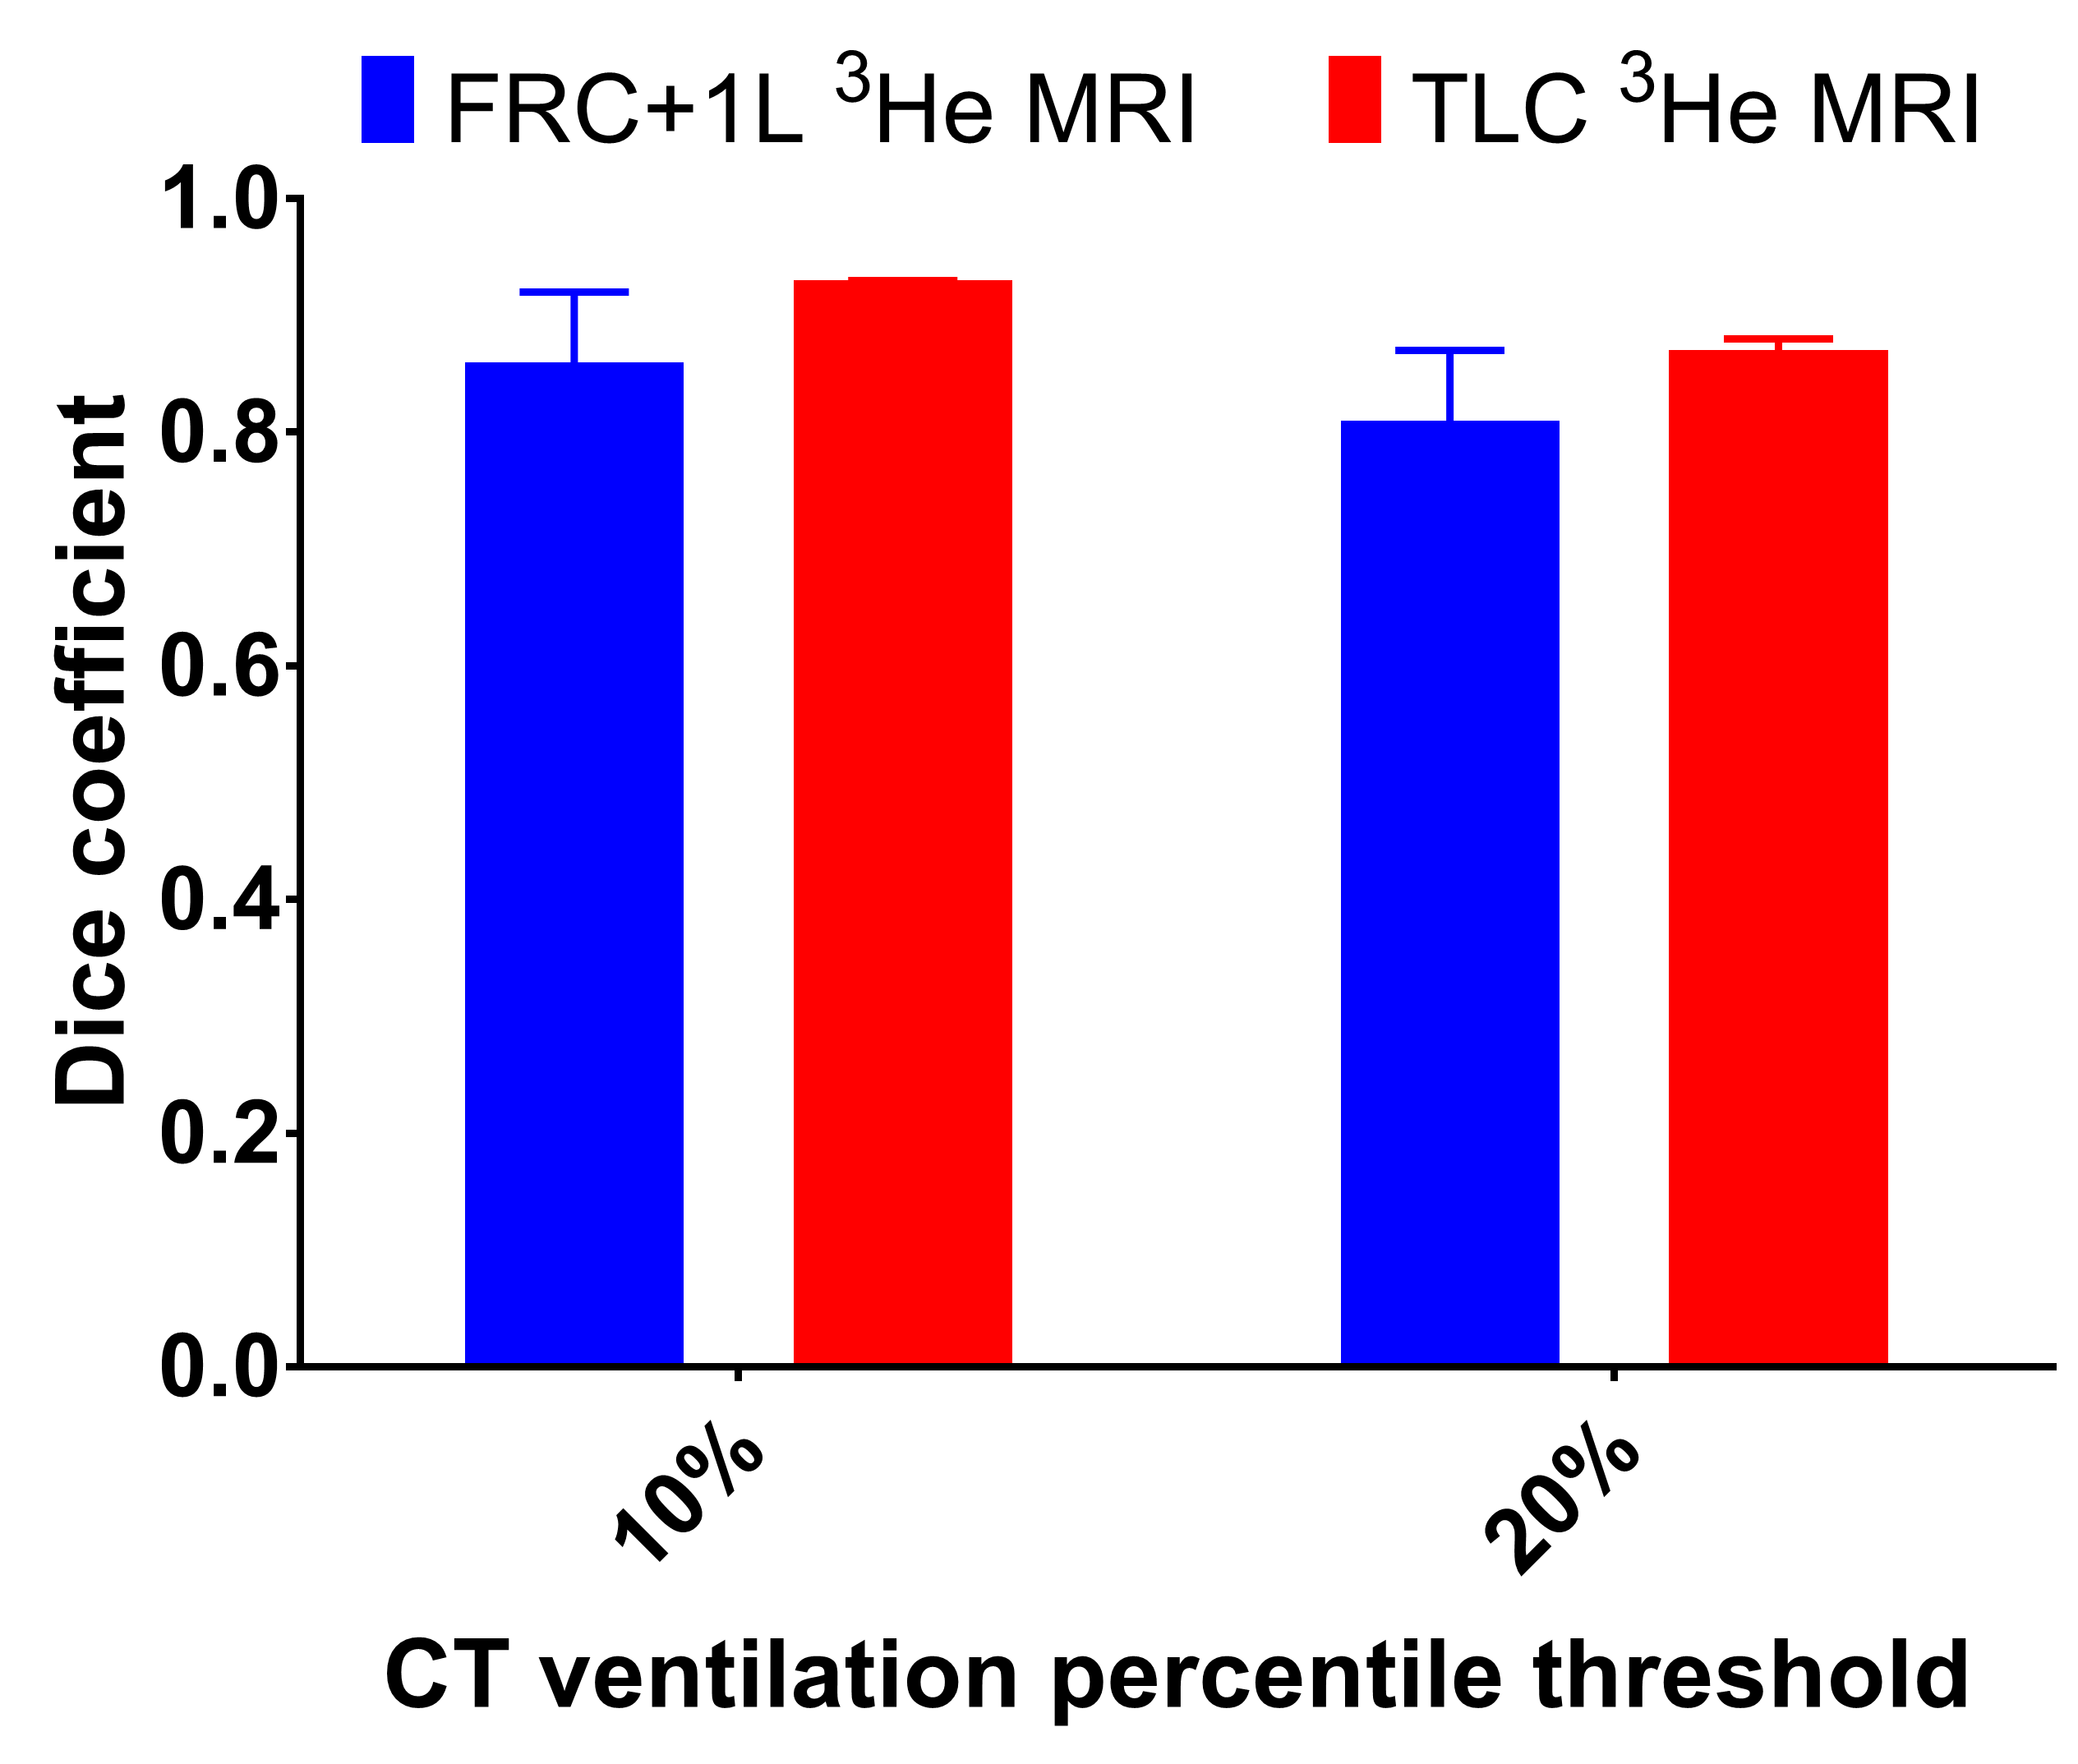
Figure 5. Bar graph of Dice coefficients of ventilation CT thresholded at the 10th and 20th percentiles against 3He MRI acquired at FRC+1L (blue) and TLC (red). The data is summarised with median and upper limit of the range (small bar).