4463
High Ventilation Percent on Hyperpolarized Helium-3 MRI is Associated with Reduced One-Year Risk of Asthma Exacerbation1Biomedical Engineering, University of Wisconsin -- Madison, Madison, WI, United States, 2Medical Physics, University of Wisconsin -- Madison, Madison, WI, United States, 3Kinesiology, University of Wisconsin -- Madison, Madison, WI, United States, 4Neurobiology, University of Wisconsin -- Madison, Madison, WI, United States, 5Pharmacy, University of Wisconsin -- Madison, Madison, WI, United States, 6Allergy, Pulmonary & Critical Care Medicine, University of Wisconsin -- Madison, Madison, WI, United States, 7Pediatrics, University of Wisconsin -- Madison, Madison, WI, United States, 8Radiology, University of Wisconsin -- Madison, Madison, WI, United States, 9Biostatistics and Medical Informatics, University of Wisconsin-Madison, Madison, WI, United States
Synopsis
We assessed the high ventilation percent (HVP) as well as the ventilation defect percent (VDP) on hyperpolarized (HP) 3He MRI and found that both measures were associated with exacerbation in the year following imaging, with the HVP exhibiting the stronger association. Both measures were strong predictors relative to other measures of lung function. These findings suggest that HVP is sensitive to one-year risk of asthma exacerbation and is a potential biomarker of asthma instability.
Purpose
HP 3He MRI may be useful in identifying asthma patients susceptible to severe outcomes and requiring additional surveillance or intervention. The ventilation defect percent (VDP) on HP 3He MRI has been associated retrospectively with severe clinical outcomes in asthma1. We hypothesize that the high ventilation percent (HVP) measured on HP 3He MRI may be sensitive to asthma instability and risk of exacerbation. In this work, we test the association between HVP and exacerbation in the year following imaging in a cohort of asthma subjects.Methods
50 subjects (24M/26F, median age [min – max] 47.2 years [8.7 – 72.7]) were recruited as part of the Severe Asthma Research Program III (SARPIII)2, and included mild/moderate (N=20, 40%) and severe (N=30, 60.0%) asthmatics as determined by the SARP severity classification, which uses dosage and frequency of corticosteroid use as a major criterion3. Subjects were stable when imaged and at least 6 weeks removed from any exacerbation event or respiratory infection, and they maintained standard of care asthma therapies prior to imaging. HP 3He MRI, spirometry, fraction inhaled nitric oxide (FeNO), and blood and sputum samples were obtained. MRI and spirometry were performed after the administration of an inhaled bronchodilator.
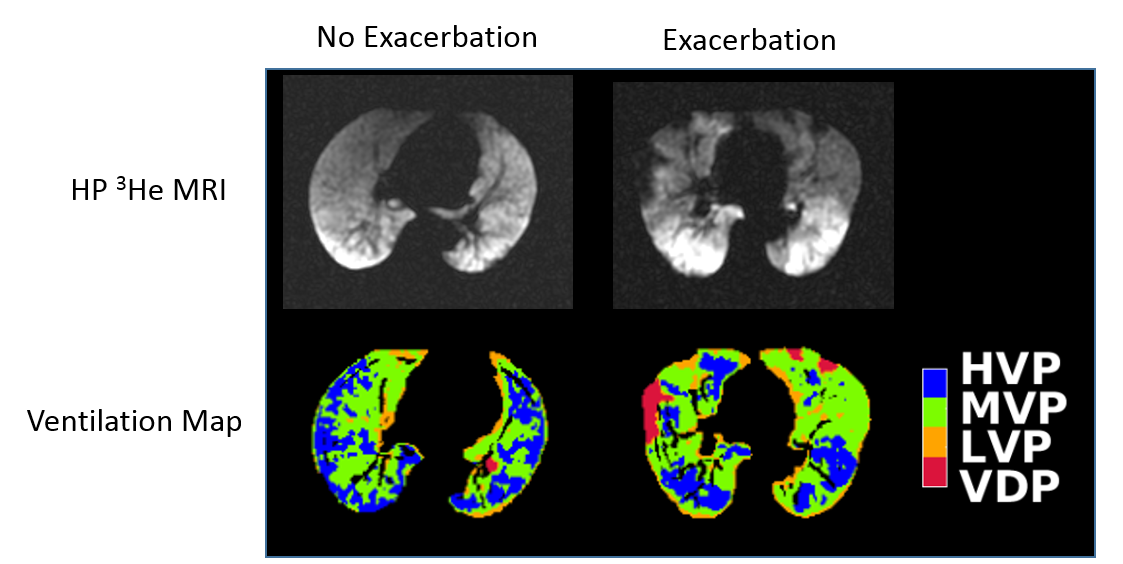
A comprehensive analysis of ventilation was performed using an adaptive K-means algorithm4 written in MATLAB (The Mathworks, Natick, MA) by classifying the HP gas image volume into four signal intensity levels, with the lowest intensity bin defining VDP and the uppermost intensity bin defining HVP. In an inter-method comparison study5 between this method and an independent linear binning method6, both approaches to characterizing ventilation produced comparable results in a cohort of asthma subjects.
Receiver operating characteristic (ROC) analysis and the Wilcoxon rank-sum test were used to evaluate a suite of biomarkers (HVP, VDP, blood eosinophil and neutrophil counts, sputum eosinophil and neutrophil differentials, forced expiratory volume in one second (FEV1) percent predicted (PP), forced vital capacity (FVC) PP, FEV1/FVC PP, and FeNO) as predictors of one or more exacerbations in the year following imaging. Correlations between HVP and these same biomarkers were assessed using Spearman’s rank correlation. Statistical analyses were performed in R version 3.2.3 using a threshold for statistical significance of p < 0.05.
Results
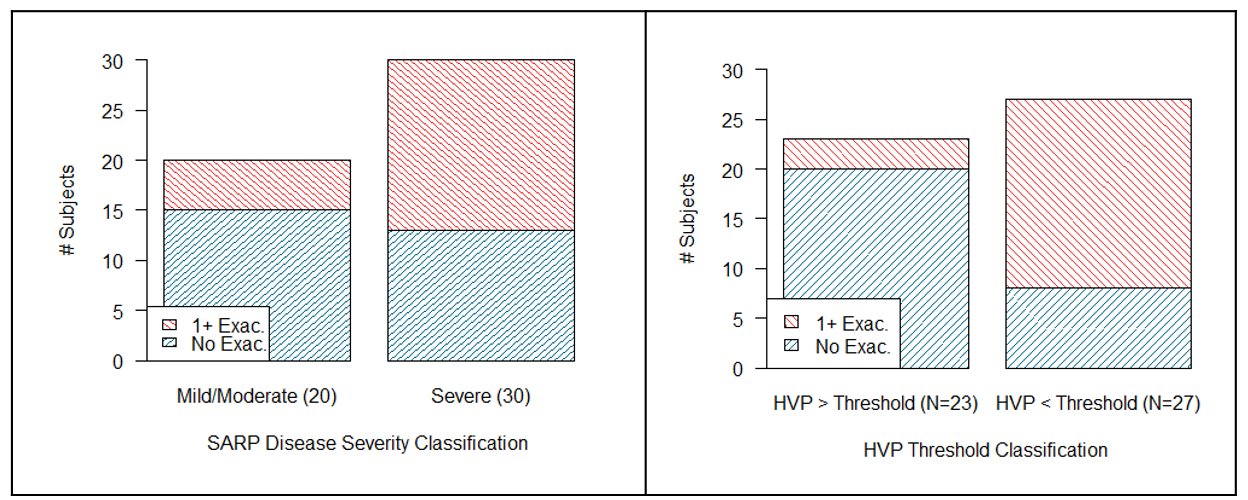
Typical examples of HP 3He MRI of subjects with and without exacerbation are shown in Figure 1. Twenty-two subjects (44.0%) had at least one exacerbation in the year following imaging: 5/20 (25.0%) of mild/moderate and 17/30 (56.7%) of severe subjects as classified by the SARP criteria (Figure 2, left). Overall median HVP in the study population was 20.2%, with medians of 26.6% and 16.7% in the mild/moderate and severe subgroups respectively (p < 0.001). Median HVP in the non-exacerbation group was 22.4% vs. 16.9% in the exacerbation group (p < 0.01).
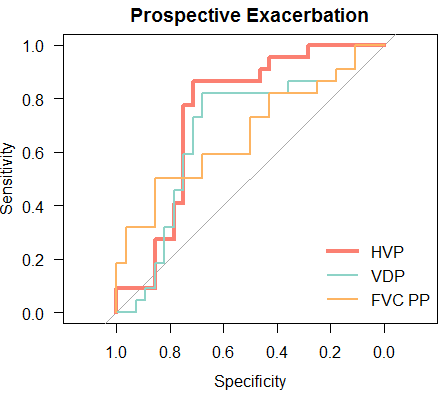
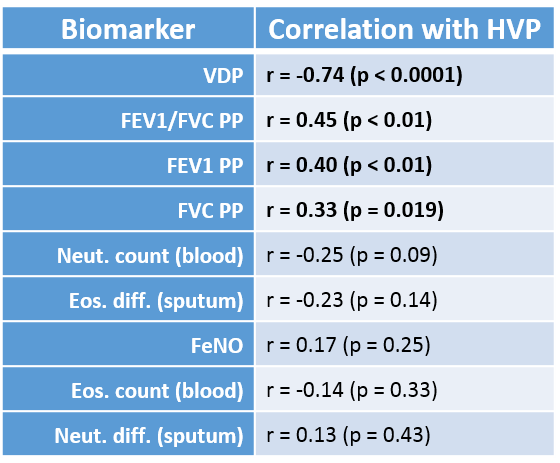
HVP was associated with exacerbation in the year following imaging (ROC area under curve [AUC] = 0.75, p < 0.01). The optimal threshold HVP value for maximizing both sensitivity and specificity in the ROC model was 21.0%. Of the 28 subjects above the HVP threshold, 3 (13.0%) experienced an exacerbation vs. 19/27 (70.4%) of those below the threshold (Figure 2, right). Among the other potential predictors, both VDP and FVC PP were also predictive of exacerbation, with ROC AUC values of 0.68 (p = 0.035) and 0.67 (p = 0.044) respectively (Figure 3). None of the other biomarkers assessed in this population were significant predictors of exacerbation. HVP was correlated with spirometry, but not with any of the other biomarkers (Table 1).
Discussion
Both HVP and the more established VDP on HP 3He MRI appear to be moderate to strong predictors of prospective exacerbation relative to other biomarkers of lung function and inflammation. HVP reflects the percentage of highly-ventilated lung, free of both ventilation defects (i.e. the VDP) and of lower-intensity regions not classified as outright defects but which may still indicate milder regional airway limitation or obstruction. Somewhat surprisingly, HVP was the better predictor vs. VDP and was reduced in the exacerbation group, suggesting that this measure may be capturing additional information about lung ventilation distinct from the more binary VDP measure. These results further suggest that characterizing regional lung function via HP gas imaging may be a useful tool for identifying subjects with unstable asthma.Acknowledgements
The authors thank the nurses, recruiters, and patient volunteers who made this project possible, the scientists who operated the helium polarizer during the period of these studies, the Data Coordinating Center of the Severe Asthma Research Program (SARP), and the UW Pulmonary Imaging Center, NIH S10 OD016394. This work was supported by NIH/NHLBI R01 HL080412, NIH/NHLBI U10 HL109168, and a Wisconsin Alumni Research Foundation (WARF) Technology Transfer Research AssistantshipReferences
1. Mummy, D.G., et al., Ventilation Defect Percent in Helium-3 MRI as a Biomarker of Severe Outcomes in Asthma. Journal of Allergy and Clinical Immunology, 2017 [in press].
2. Jarjour, N.N., et al., Severe asthma: lessons learned from the national heart, lung, and blood institute severe asthma research program. American journal of respiratory and critical care medicine, 2012. 185(4): p. 356-362.
3. Moore, W.C., et al., Characterization of the severe asthma phenotype by the national heart, lung, and blood institute's severe asthma research program. Journal of Allergy and Clinical Immunology, 2007. 119(2): p. 405-413.
4. Zha, W., et al., Regional Heterogeneity of Lobar Ventilation in Asthma Using Hyperpolarized Helium-3 MRI. Acad Radiol 2017 [in press].
5. Zha, W., et al., Comparison of quantitative algorithms for calculating VDP from hyperpolarized 129Xe MRI – testing reproducibility of a biomarker of airway obstruction. ISMRM 2017, abstract #1807.
6. He, M., et al., Using Hyperpolarized 129Xe MRI to Quantify the Pulmonary Ventilation Distribution. Acad Radiol 2016. 23(12): p. 1521-1531.
Figures