4462
Highly Accelerated Dynamic Acquisition of 3D Grid-Tagged He-3 Lung Images Using Compressed Sensing1Department of Biomedical Engineering, University of Virginia, Charlottesville, VA, United States, 2Department of Radiology and Medical Imaging, University of Virginia, Charlottesville, VA, United States, 3Department of Physics, University of Virginia, Charlottesville, VA, United States, 4Department of Medicine, University of Virginia, Charlottesville, VA, United States, 5Department of Health Technology and Informatics, Hong Kong Polytechnic University, Kowloon, Hong Kong
Synopsis
Radiotherapy in the context of lung cancer can become less effective if lung biomechanics are not well-characterized. MRI of grid-tagged, inhaled hyperpolarized He-3 gas provides images with strong signal at the tag locations, allowing time-resolved tracking of regional lung motion that can be used to inform strategies for precision radiotherapy. The present work demonstrates rapid acquisition of high-quality 3D grid-tagged images obtained with 8-fold under-sampling and reconstructed using compressed sensing. The dramatic imaging acceleration inherent in this technique allows multiple 3D image sets to be acquired during a single breath-hold, effectively permitting 4D-MRI of lung motion during exhalation.
Introduction
Radiotherapy of pathologies such as cancer can become less effective if unexpected changes in the position and orientation of a patient’s anatomical features occur during treatment. In the context of lung cancer treatment using radiotherapy, it is imperative to accurately characterize regional physiological lung deformation occurring during respiration in order to provide the most effective treatment.
MRI of grid-tagged, inhaled hyperpolarized He-3 gas provides images with strong signal at the tag locations, allowing time-resolved tracking of regional lung motion that can be used to inform strategies for precision radiotherapy1,2. The purpose of the present work is to develop and demonstrate a method for highly accelerated acquisition of 3D grid-tagged images based on compressed-sensing reconstruction of significantly under-sampled k-space data, in which the under-sampling scheme is tailored to the specific properties of the applied tag pattern.
Methods
MR imaging was performed in three healthy subjects using a 1.5T whole-body scanner (Siemens Avanto) and vest-shaped RF coil. He-3 gas was polarized to approximately 60% using a home-built system. He-3 images were acquired using a Cartesian readout with 3D isotropic voxel size of 4 mm using a balanced steady-state free precession pulse sequence. Following inhalation of a 1 L mixture of ~400 mL hyperpolarized He-3 and ~600 mL nitrogen, 3D tagging grids were created at breath-hold, by applying sinc-modulated RF-pulse trains consecutively along each of the three principal axes. Tag width and spacing were 11 mm and 24 mm, respectively, in each principal direction. Sequence parameters included: TR = 1.72 ms, TE = 0.86 ms, FOV = 288×448×176 mm, and matrix size = 72×112×44. Images of the tagged He-3 gas were collected at end-of-inhalation (EOI) and end-of-exhalation (EOE) for all subjects, and additionally at four intermediate phases between EOI and EOE for subjects being imaged using k-space under-sampling. Under-sampled images were reconstructed by finding minimal solutions of terms combining the L1 norm of the total variance and the wavelet transform, using adapted routines from the SparseMRI toolbox, as previously described3,4.
For a slice taken orthogonal to the readout direction, the image-space representation of the described tagging profile can be approximated as follows:
$$ I(y,z) = C_{1}\cdot \sqcap(\frac{y}{w_{tag,y}},\frac{z}{w_{tag,z}}) * III(\frac{y}{\triangle y_{tag}},\frac{z}{\triangle z_{tag}}) \cdot \sqcap(\frac{y}{w_{lung,y}},\frac{z}{w_{lung,z}}) $$
The k-space data can then be approximated as the
two-dimensional Fourier transform of the approximate image data, which is as
follows:
$$ \check{I}(k_{y},k_{z}) = C_{2}\cdot sinc({w_{tag,y}k_{y}},{w_{tag,z}k_{z}}) \cdot III({\triangle y_{tag}k_{y}},{\triangle z_{tag}k_{z}}) * sinc({w_{lung,y}k_{y}},{w_{lung,z}k_{z}}) $$
This expectation of where energy will be located in k-space can be used to inform the
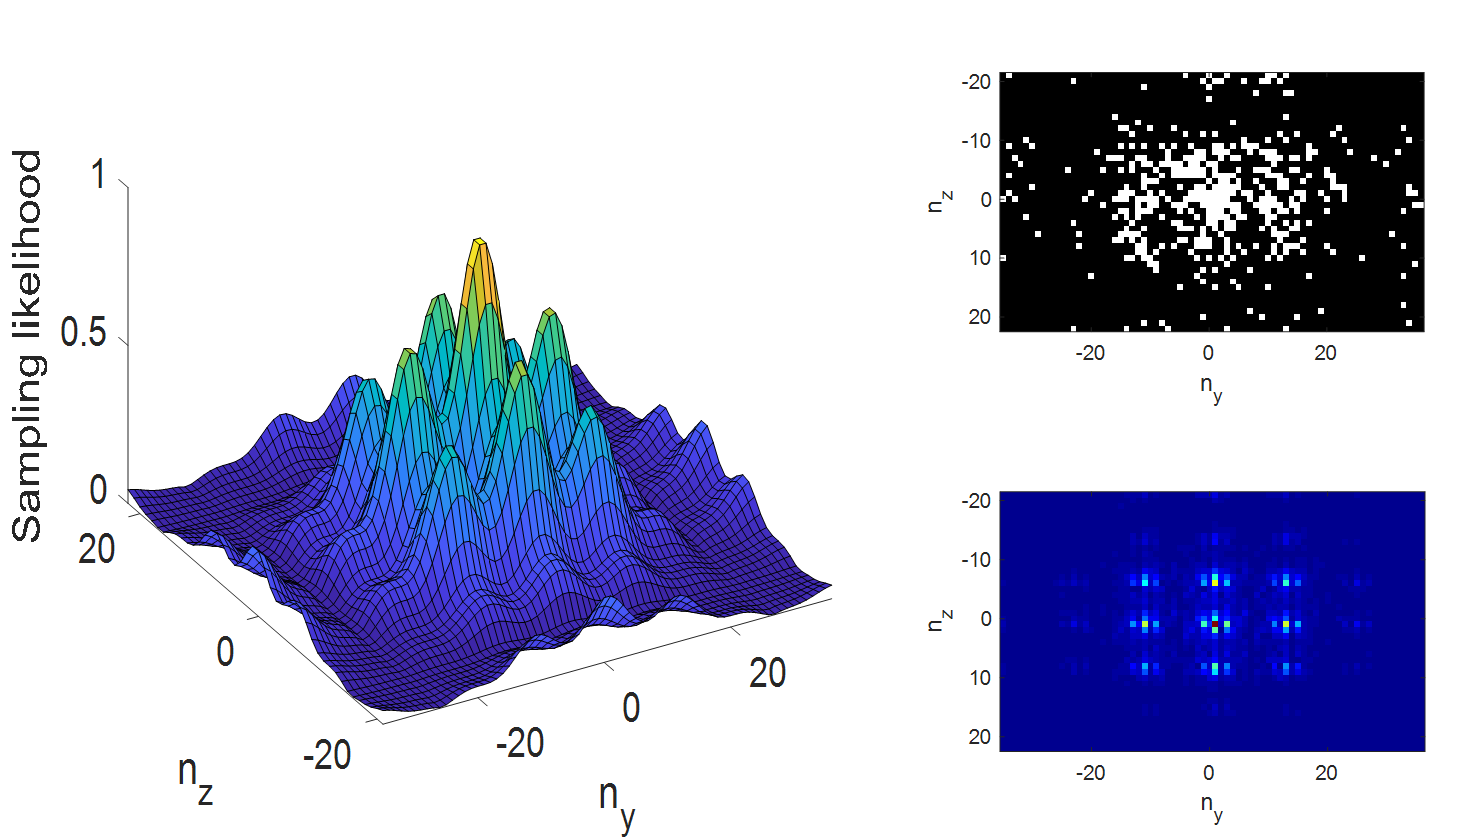
creation of a pseudo-random under-sampling pattern. The likelihood of sampling
a given phase-encode line is given as follows:
$$ p(k_{y},k_{z}) = sinc({w_{tag,y}k_{y}},{w_{tag,z}k_{z}}) \cdot III({\triangle y_{tag}k_{y}},{\triangle z_{tag}k_{z}}) * exp(-[\frac{k_{y}^{2}}{2\sigma_{ky}^{2}}+\frac{k_{z}^{2}}{2\sigma_{kz}^{2}}]) $$
This sampling likelihood generally mirrors the shape of the rough expected distribution of energy in k-space, so that regions of higher energy will tend to be sampled preferentially over regions of lower energy. The amplitudes of the Gaussian and sinc functions are chosen such that the under-sampling factor for each 3D image is approximately 8. Fig. 1a shows the profile of the sampling likelihood with respect to Ny and Nz. Fig. 1b shows an example of a k-space under-sampling pattern generated using this sampling likelihood, which may be compared with the representative slice of fully-sampled k-space data shown in Fig. 1c.
Results
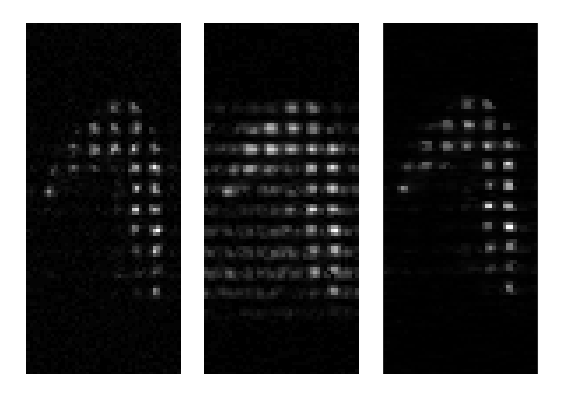
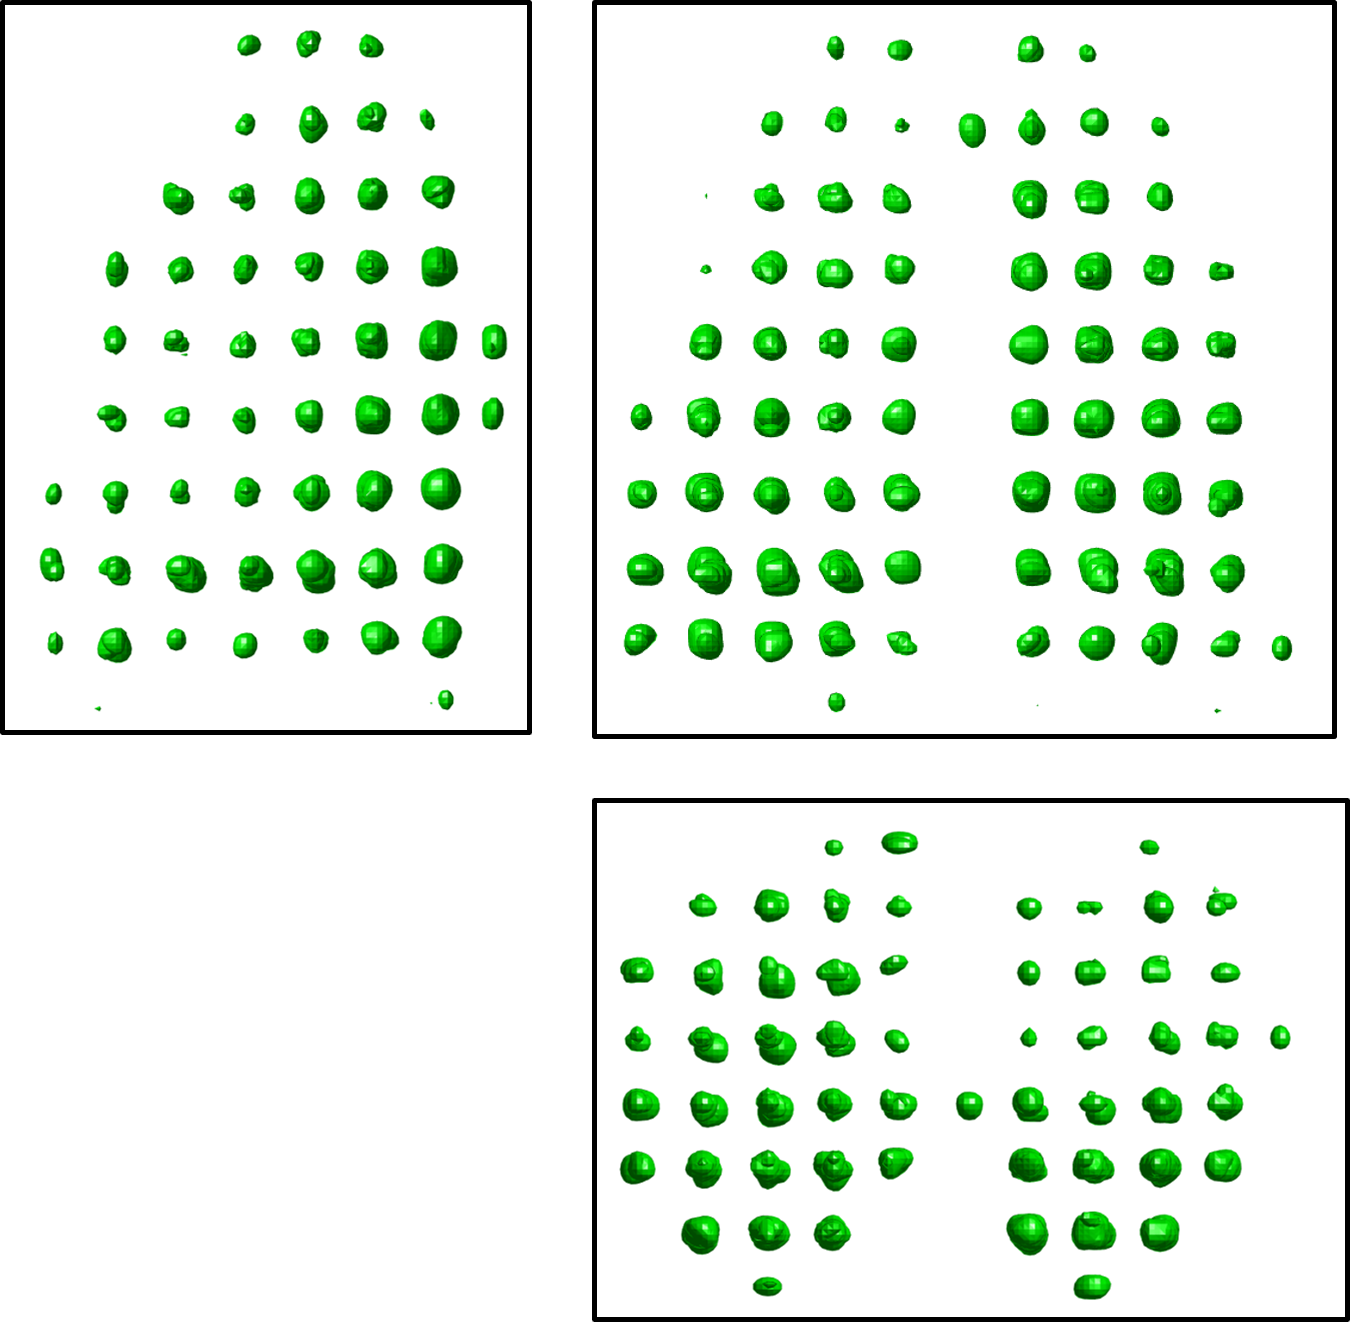
Fig. 2 shows the results of enforcing the under-sampling routine on a fully-sampled patient data set. Reconstructing the data using a traditional Fourier transform, as shown in Fig. 2b, produces image artifacts and replicas of the tags in spatial locations where no gas is present. Fig. 2c shows reconstruction of the artificially under-sampled data set using a compressed sensing method; this reconstruction produces an image very similar to that produced by performing a Fourier transform on the original, fully-sampled data set. Fig. 3 shows a 3D rendering of image data reconstructed from k-space data collected with an under-sampling factor of 8.Conclusion
This work demonstrates rapid acquisition of high-quality 3D grid-tagged images obtained with 8-fold under-sampling. Whereas a similar fully-sampled acquisition would require roughly six seconds to complete, our under-sampled images require less than one second. This dramatic acceleration allows multiple 3D image sets to be acquired during a single breath-hold maneuver, effectively permitting 4D-MRI of lung motion during the exhalation phase. Future work will focus on the acquisition and analysis of images collected at intermediate time points during the breathing cycle in order to create maps of lung displacement throughout the exhalation phase, toward the aim of developing improved techniques for lung cancer treatment.Acknowledgements
This work was supported by NIH grant R21 CA195317.References
- Cai J et al. Dynamic MRI of grid-tagged hyperpolarized helium-3 for the assessment of lung motion during breathing. Int J Radiation Oncology Biol Phys 2009; 75: 276-284.
- Miller GW et al. Regional quantification of pulmonary biomechanics using dynamic MRI of grid-tagged hyperpolarized 3He. ISMRM 2007; 15:945.
- Qing K et al. Rapid acquisition of Helium-3 and proton three-dimensional image sets of the human lung in a single breath-hold using compressed sensing. Magn Reson Med 2015; 74: 1110-1115.
- Lustig M et al. Sparse MRI: the application of compressed sensing for rapid MR imaging. Magn Reson Med 2007; 58: 1182–1195.
Figures