4460
Quantitative Analysis of Peri-Tumor Interface Fat and the Volumetric Fat Percentage and Contrast Enhancement in Three Peri-Tumoral Shells to Differentiate Molecular Subtypes of Breast Cancer1Center for Functional Onco-Imaging, Department of Radiological Sciences, University of California Irvine, Irvine, CA, United States, 2Department of Radiology, E-Da Hospital and I-Shou University, Kaohsiung, Taiwan, 3Department of Radiology, Tzu-Chi General Hospital, Taichung, Taiwan, 4Breast Center, Tzu-Chi General Hospital, Taichung, Taiwan
Synopsis
A 3D morphological analysis method was developed to analyze the fat content on tumor boundary interface and in different peri-tumoral shells away from the tumor. A total of 114 mass type breast cancers were analyzed, including 87 HR(+), 13 HR(-)HER2(+), and 14 TN. The volumetric fat percentage in three shells surrounding the tumor: 150%-100%, 200%-150%, 250%-200% of the tumor convex hall were measured, also the mean contrast enhancement in fibroglandular tissue contained within three shells were measured. The peri-tumor fat content and contrast enhancement is the highest in the most aggressive TN tumors compared to other subtypes.
abstract
Background and Purposes: Evidence suggests that the peritumoral region, the tissue area surrounding the tumor lesion, may possess valuable information and thus have potentially important clinical implications. Peritumoral tissue may be different from normal tissue due to tumor invasion 1, 2, tissue reactions 3, or tissue changes 4, 5. New evidences also indicate tumor-surrounding adipose tissue as a key component of breast cancer progression, and correlated with nodal status 6, 7. Recent imaging studies have shown invasive breast cancer preferably and predominantly occurs adjacent to breast adipose tissue 8, 9. Different molecular subtypes of breast cancer are known to have different growth characteristics and aggressiveness, and also presenting different morphological appearances. For example, triple negative (TN) tumor is the most aggressive among all subtypes, and most likely to present with mass lesion and show rim enhancement, thus it may have different peri-tumoral tissue characteristics compared to other subtypes. In this study we applied four different morphological analysis methods to quantitatively study the fat content on the tumor boundary and in different shells surrounding the tumor. The percentage of fat and the degree of contrast enhancement were compared among three molecular subtypes: Hormonal receptor positive HR(+), HR negative and HER2 positive HR(-)HER2(+), and triple negative TN.
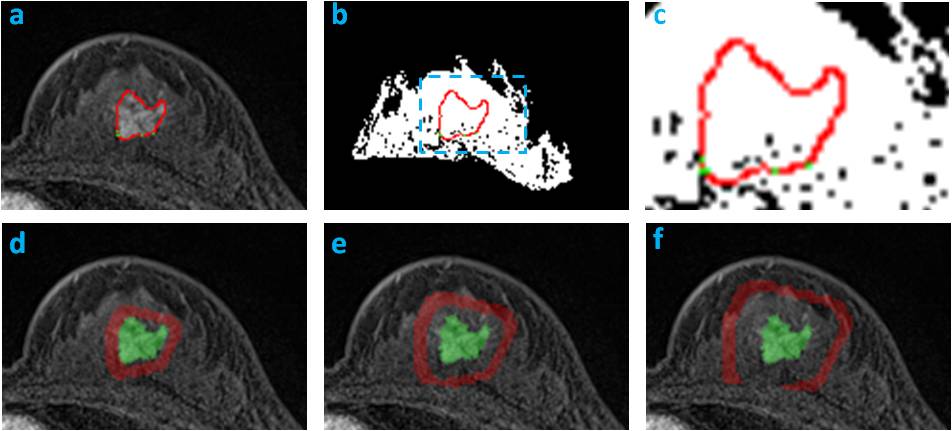
Materials and Methods: 114 women (mean age 48.5 y/o) with pathologically proven, solitary, mass breast cancer were studied (tumor size 0.4-5.0 cm, mean 2.6 cm), 100 with invasive cancer and 14 with pure DCIS. For molecular subtypes, 87 were HR(+), 13 were HR(-)HER2(+), and 14 were TN. MRI was performed on a 1.5T Siemens scanner. The tumor lesion was segmented from the (post – pre) subtraction images using a fuzzy c-means clustering algorithm. The breast segmentation was done by using a chest template exclusion method; and the fibroglandular and fatty tissue was segmented using a N3 bias-field correction and FCM algorithm. Four different parameters related to peri-tumor fat content were calculated, as demonstrated in Figures 1-3. To evaluate the tumor-fat interface, tumor boundary on each slice was identified, and the pixels abutting to fat vs. fibroglandular tissue were counted to calculate peri-tumor interface fat percentage. Three shells (SH1, SH2, SH3) surrounding the convex hall of the 3D tumor were defined, and in each shell the volumetric percentage of fat was calculated. SH1 was defined as the shell between 150% volumetric expansion of the tumor convex hall – the tumor convex hall (150% – 100%); SH2 was (200% – 150%); and SH3 was (250% – 200%). In order to consider the different amount of fat in the whole breast, the analysis was also done controlling for that. Additionally, the mean contrast enhancement from the fibroglandular tissue in the three peri-tumoral shells were calculated and compared among different subtypes.
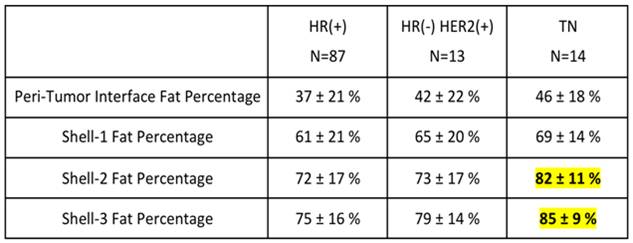
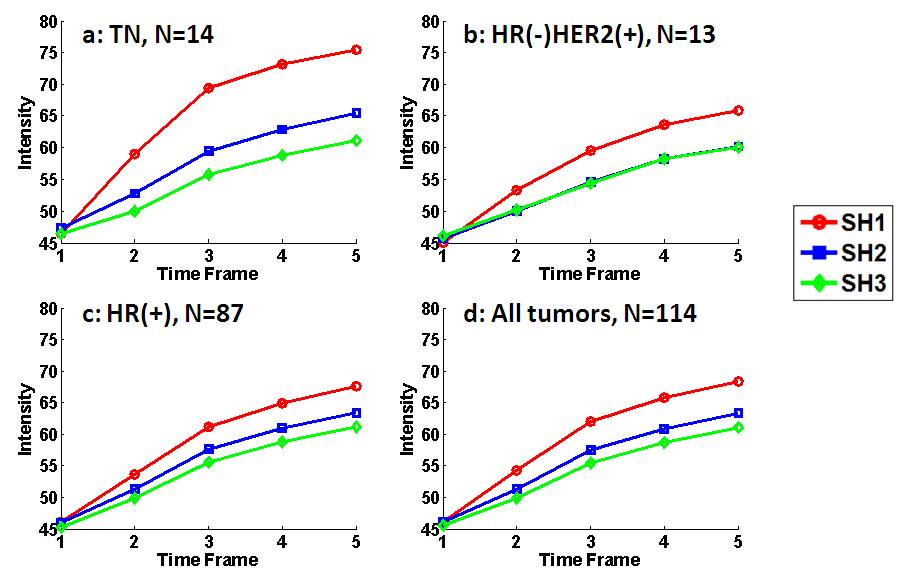
Results: In all 114 tumors, the mean peri-tumor boundary interface fat percentage is 39±20%. The mean volumetric fat percentage in SH1, SH2, and SH3 are 62±20%, 73±16%, 77±15%, respectively. The fat percentage increases from SH1 to SH2 to SH3, all significant, indicating that the tissue becomes fattier and fattier away from the tumor. Since the fibroglandular tissue density is higher in the nipple than the peripheral region of a breast, this finding is highly anticipated. Table 1 shows the measured fat percentage in three different subtypes. In the TN group, the fat percentage on the tumor boundary is 46±18%, the highest among the three subtypes but not significantly different; and the fat percentage in SH2 and SH3 in the TN group is 82±11% and 85±9%, which is significantly higher compared to the two other two subtypes. The results remained after controlling for the whole breast fat percentage. Figure 4 shows the enhancement kinetics from 5 DCE frames calculated from the fibroglandular tissue contained within SH1, SH2 and SH3. The enhancement in SH1 closer to the tumor is higher than in SH2 and SH3, but not significant different among three subtypes.
Conclusions: In this study we developed a 3D morphological analysis methods to analyze the fat content on the tumor boundary as well as in different peri-tumoral shells away from the tumor. The results show that the fat content gradually increases away from the tumor, and the contrast enhancement gradually decreases away from the tumor. Among three different subtypes, peri-tumoral fat content and contrast enhancement is the highest in the most aggressive TN tumors. The method presented in this study provides a feasible tool for quantitative analysis of peri-tumoral tissue characteristics, but whether these parameters are related to aggressiveness and prognosis of breast cancer needs to be further investigated.
Acknowledgements
This work was supported in part by NIH/NCI Grant No. R01 CA127927, R21 CA170955, and R03 CA136071.References
1. Mohammed ZM.
BMC Clin Pathol. 2013;13:31.; 2. Lee AK. J Clin Oncol. 1990;8:1457–65.;
3. Uematsu T. Breast Cancer. 2015
Jan;22(1):66-70.; 4. Chai H. Ann Clin Lab Sci. 2009;39:331–7.; 5. Heaphy CM. Breast Cancer Res Treat. 2009;118:229–39.; 6. Obeid
JP. Clin
Transl Oncol.
2017 Feb;19(2):211-8.; 7. Wang
YY. Cancer
Lett. 2012 Nov
28;324(2):142-51.; 8. Zhu
W. Clin
Breast Cancer.
2017 Feb;17(1):e11-e88. ; 9. Kim
WH. Sci Rep. 2016 Dec 14;6:39085.
Figures