4459
Comparison of 1.0M Gadobutrol and 0.5M Gadoteridol for Kinetic Parameters on Breast Dynamic Contrast Enhanced Magnetic Resonance Imaging at 3T1Division of Clinical Radiology Service, Kyoto University Hospital, Kyoto, Japan, 2Department of Diagnostic Imaging and Nuclear Medicine, Kyoto University Graduate School of Medicine, Kyoto, Japan, 3Department of Radiology, Memorial Sloan Kettering Cancer Center, New York, NY, United States, 4MR Application Predevelopment, Siemens Healthcare GmbH, Erlangen, Germany, 5Department of Breast Surgery, Kyoto University Graduate School of Medicine, Kyoto, Japan
Synopsis
The contrast effects of 1.0M gadobutrol were compared to that of 0.5M gadoteridol in breast cancer at 3T using hybrid MRI protocol which combined conventional DCE (C-DCE) with ultrafast DCE (UF-DCE). The significant differences were observed only in UF-DCE, maximum enhancement ratio (MER) and maximum slope (MS). The slightly higher peak relative enhancement produced by gadobutrol compared with gadoteridol might help in the detection and evaluation of breast lesions in the earlier phases.
Introduction
Gadobutrol (Gadovist, Bayer Healthcare Pharmaceuticals) is a gadolinium-based contrast agent (GBCA) with a high concentration and high T1 relaxation rate. The concentration of gadolinium in gadobutrol is 1.0M (mol/L), which is 2-fold higher than the other GBCA. The T1 relaxation ratio of gadobutrol is 5.0 L/mmol/s at 3 Tesla, 37˚C in human plasma1. Several studies compared the contrast effects of gadobutrol to representatives of the most commonly used 0.5 molar GBCAs for breast MRI2,3. Eva M et al.3 have demonstrated the higher relative enhancement values of benign and malignant lesions in conventional dynamic contrast enhanced (C-DCE) MRI compared with Gd-DOTA at 1.5T. The approach of semi-quantitative and quantitative DCE MRI with higher temporal resolution improves diagnostic accuracy for breast cancer compared to C-DCE MRI4–7. The aim of this study was to compare the contrast effects of gadobutrol with gadoteridol (Prohance, Eisai) in breast cancer at 3T using hybrid MRI protocol which combined C-DCE with ultrafast DCE (UF-DCE).Methods
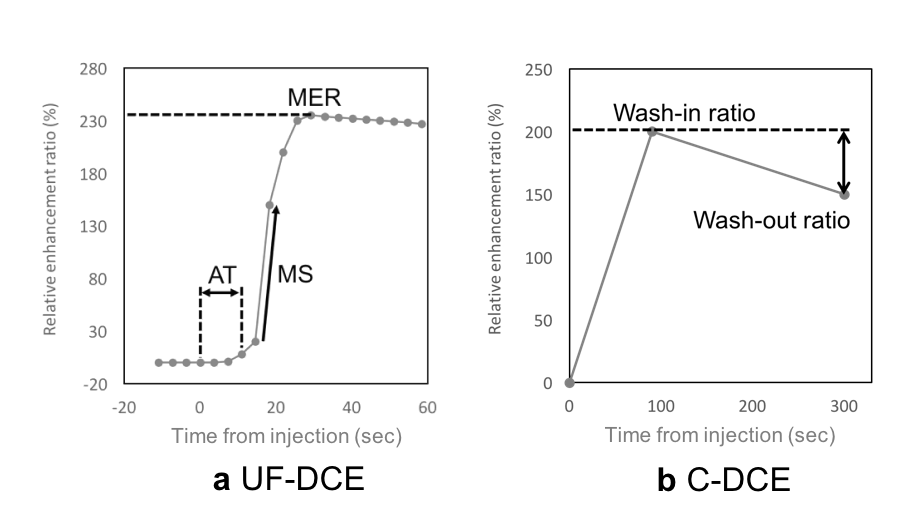
Our institutional review board approved this study with retrospective design. This study compared two groups of patients with historical control design, not intra-individual comparison. Thirty-seven patients pathologically diagnosed with invasive breast cancer who underwent hybrid MRI protocol which is combined C-DCE MRI with UF-DCE MRI were included. Thirty-seven patients were historically separated in two groups. From December 2015 to March 2016, 14 patients administered 0.2 mL/kg body weight of 0.5M gadoreridol. From April 2016 to June 2017, 23 patients administered 0.1 mL/kg body weight of 1.0M gadobutrol. All breast MRI examinations were performed using a 3T system (MAGNETOM Skyra, Siemens Healthcare GmbH, Erlangen, Germany) and an 18-channel breast coil. The hybrid DCE-MRI protocol consisted of UF-DCE using the prototype sequence (from 13 s before to 60 s after contrast injection), followed by C-DCE sequence of initial phase (60-120 s), delayed phase (300-360 s) and high spatial resolution post-contrast images. UF-DCE MRI was performed using a prototypical non-fat-suppressed 3D volumetric interpolated breath-hold examination (VIBE) sequence with the following imaging parameters: repetition time (TR), 5.04 ms; echo time (TE), 2.46 ms; flip angle, 15°; slice thickness, 2.5 mm; 60 partitions; matrix size, 384 x 269; FOV, 360 x 360 mm; compressed sensing acceleration, 16.5; and temporal resolution, 3.65 s. DCE-MRI was sequentially acquired at 20 consecutive time points with a total acquisition time of 73 s. C-DCE using VIBE sequence with fat suppression were performed with the following parameters: TR, 3.84 ms; TE, 1.43 ms; FA, 15°; slice thickness, 1.0 mm; 144 partitions; matrix size, 384 x 346, FOV, 330 x 330 mm; orientation, axial. Image analysis for UF-DCE and C-DCE MRI were performed by measuring relative enhancement ratio, which is the percent increase of MR signal intensity before and after the injection of GBCA. Regions of interest(ROI) were placed in the strongest enhanced lesion with at least 10 pixels by experienced radiological technologist. The same ROI was copied to the other dynamic series to measure signal intensity of ROI. In UF-DCE MRI, maximum enhancement ratio (MER), maximum slope (MS), and arrival time (AT) were measured (Figure 1-a). In C-DCE MRI, wash-in ratio and wash-out ratio were measured (Figure 1-b). If the curve type shows persistent kinetics pattern, wash-out ratio is negative value. These analyses were performed per each lesion.Results
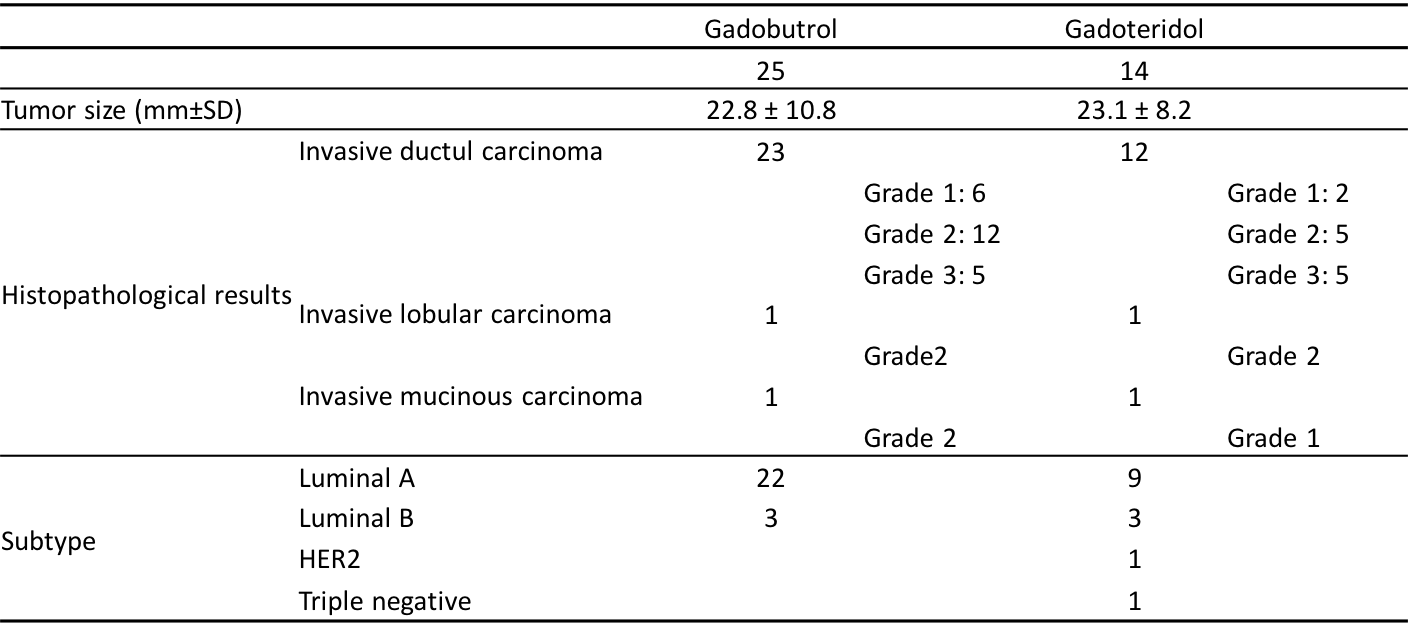
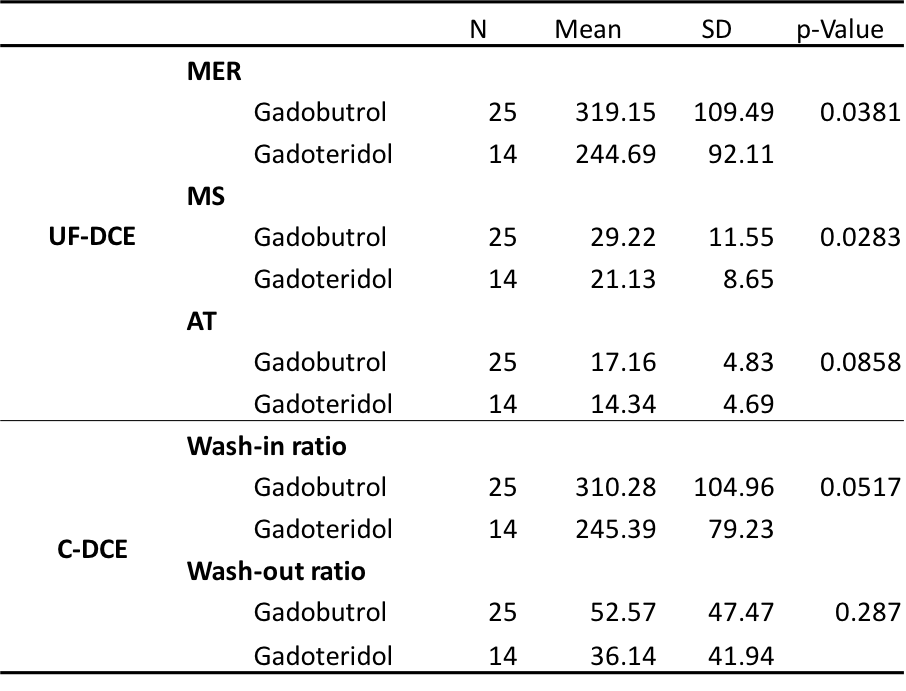
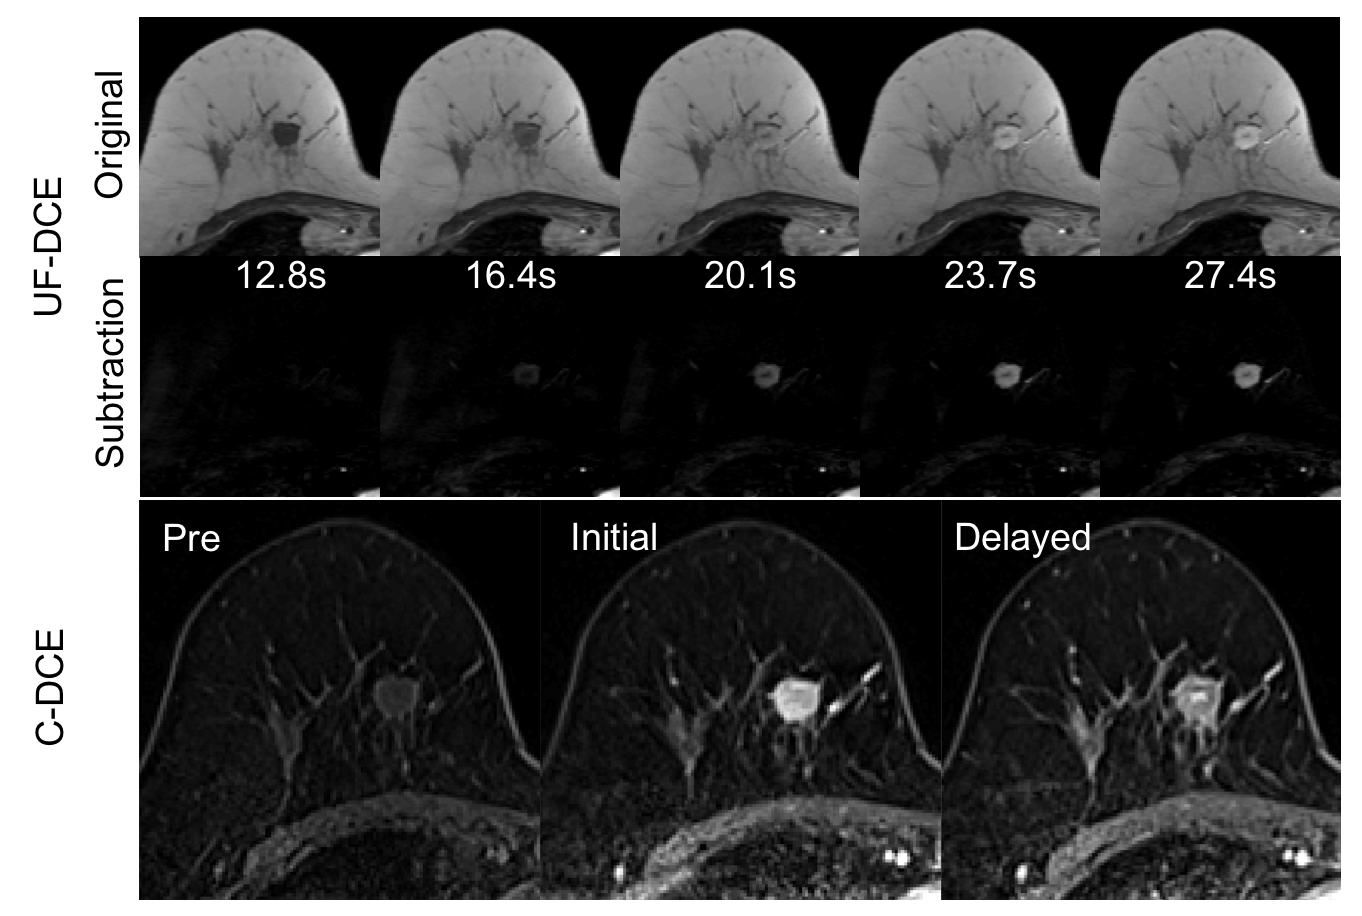
The tumor characteristics are summarized in Figure 2. Results for kinetic parameters are summarized in Figure 3. In UF-DCE MRI, MER and MS for gadobutrol were significantly higher than that for gadoteridol (p<0.05). On the other hand, AT showed no difference between gadobutrol and gadoteridol. In C-DCE MRI, there were no difference for Wash-in ratio and Wash-out ratio. Example of UF-DCE and C-DCE images with gadobutrol and gadoteridol were shown in Figure 4 and 5, respectively.Discussion
The 1.0 M chelate gadobutrol has been shown to allow a narrower bolus profile, resulting in an increased, more compact intravascular concentration and, consecutively a sharper bolus peak during first pass compared with 0.5 M agents 8–10. This might be the reason of significant difference observed in only very early phase, MER and MS. Limitation of the study is the lack of intra-individual control; Variation of breast cancer cases in the two group may affect the results.Conclusion
The present study demonstrated the higher contrast enhanced effect of gadobutrol compared with gadoteridol for breast cancer especially in UF-DCE at 3T MRI. The slightly higher peak relative enhancement produced by gadobutrol compared with gadoteridol might help in the detection and evaluation of breast lesions in the earlier phases.Acknowledgements
This work was partly supported by Grant-in-Aid for Scientific Researchon Innovative Areas “Initiative for High-Dimensional Data-DrivenScience through Deepening of Sparse Modeling”, MEXT grant numbers25120002, 25120008.References
1. Rohrer M, Bauer H, Mintorovitch J. Comparison of Magnetic Properties of MRI Contrast Media Solutions at Different Magnetic Field Strengths. Invest. Radiol. 2005;40(11):715–724.
2. Pediconi F, Kubik-Huch R, Chilla B, et al. Intra-individual randomised comparison of gadobutrol 1.0M versus gadobenate dimeglumine 0.5M in patients scheduled for preoperative breast MRI. Eur. Radiol. 2013;23(1):84–92.
3. Fallenberg EM, Renz DM, Karle B, et al. Intraindividual, randomized comparison of the macrocyclic contrast agents gadobutrol and gadoterate meglumine in breast magnetic resonance imaging. Eur. Radiol. 2014;25(3):837–849.
4. Huang W, Tudorica LA, Li X, et al. Discrimination of Benign and Malignant Breast Lesions by Using Shutter-Speed Dynamic Contrast-enhanced MR Imaging. Radiology. 2011;261(2):394–403.
5. Schabel MC, Morrell GR, Oh KY, et al. Pharmacokinetic mapping for lesion classification in dynamic breast MRI. J. Magn. Reson. Imaging. 2010;31(6):1371–1378.
6. Tudorica LA, Oh KY, Roy N, et al. A feasible high spatiotemporal resolution breast DCE-MRI protocol for clinical settings. Magn. Reson. Imaging. 2012;30(9):1257–1267.
7. Mann RM, Mus RD, van Zelst J, et al. A novel approach to contrast-enhanced breast magnetic resonance imaging for screening. Invest Radiol. 2014;49(9):579–585.
8. Tombach B, Heindel W. Value of 1 . 0- M gadolinium chelates : review of preclinical and clinical data on gadobutrol. Eur. Radiol. 2002;12(6):1550–1556.
9. Hadizadeh DR, Von Falkenhausen M, Kukuk GM, et al. Contrast material for abdominal dynamic contrast-enhanced 3D MR angiography with parallel imaging: intraindividual equimolar comparison of a macrocyclic 1.0 M gadolinium chelate and a linear ionic 0.5 M gadolinium chelate. AJR. Am. J. Roentgenol. 2010;194(3):821–829.
10. Kul S, Cansu A, Alhan E, et al. Contrast-enhanced MR angiography of the breast: Evaluation of ipsilateral increased vascularity and adjacent vessel sign in the characterization of breast lesions. AJR. Am. J. Roentgenol. 2010;195(5):1250–1254.
Figures